 https://orcid.org/0000-0003-3625-0354
https://orcid.org/0000-0001-5700-3956
https://orcid.org/0000-0003-3625-0354
https://orcid.org/0000-0001-5700-3956
Abstract. The main objective of the paper is to present the performance of special economic zones (SEZs) by province over 25 years of their operation and their role in reducing regional economic disparities. SEZs were created with the aim to mitigate the unemployment problem revealed by the transformation of the Polish economy. It was hoped that, thanks to investment incentives, capital would flow primarily to the regions most affected by the transformation. However, these intentions failed to receive statutory protection. As a result, SEZ investments could be found in southern, central and western Poland, i.e., they were scattered across almost the entire country. Only the eastern, poorest voivodeships enjoyed significantly less interest. This was a consequence of the ownership structure of capital because the zones were clearly dominated by foreign investors. The Polish Investment Zone, the successor to the SEZs, brought some changes in this respect. Simple statistical analyses suggest that, contrary to assumptions, the SEZs have not contributed to the reduction in regional disparities measured by GDP per capita, and may even have increased them. Resolving this question would require more in-depth research.
Keywords: special economic zones, zone management company, investment, regional disparities, voivodeships.
Special economic zones (SEZs) were established in Poland on the basis of the Act of 20 October 1994 (Dz.U. [Journal of Laws] of 1994, No. 123, item 600). Between 1995 and 1997, 17 zones were established, which were to operate no longer than until 2017. In 2001, as a result of an amendment to the Act of 1994, several changes were made, including the decisions to phase out some zones and to merger others. As a result, fourteen SEZs remained operational.
Special economic zones were intended to counteract the regional economic, social and territorial disparities revealed by the market transformation of the Polish economy. However, these intentions failed to be reflected in the Act (Act of 1994) and, as a result, subzones were created in all voivodeships, both in the better and less developed ones. The areas of some zones have been developed to a small extent, while others have steadily expanded. Reasons for these differences include the location of the zones. For obvious reasons, those located in richer and better developed, and therefore more attractive for business, parts of Poland performed better.
In addition to location factors, the investment attractiveness of SEZs was influenced by endogenous considerations related to the characteristics of the specific zone, such as its area, the availability of infrastructure and the degree of development of the investment areas. Efforts made by the zone management company (ZMC) to provide efficient services to investors also played an important role (Dorożyński, Świerkocki, Dobrowolska 2021).
Changes in the economy induced by the SEZs can be considered at different levels. Like in other developed economies, in Poland effects at regional and local levels have been crucial.[1] Researchers focused on effects to counties (e.g., Jensen, Winiarczyk 2014) and municipalities (e.g., Jensen 2018). Voivodeships attracted much less attention (one of the exceptions is Ambroziak 2015) as in these large administrative units SEZ investments play a relatively minor role which often escapes statistical analyses.
Therefore, our first goal is to show SEZ performance by voivodeships over 25 years of their history.[2] For that purpose we used data made available for the study by the Special Economic Zones Unit of the Ministry of Development[3] and other sources, mainly the Report(s) on the implementation of the Special Economic Zones Act published annually by the Minister of Economy. Secondly, we seek to find out whether SEZ investment positively contributed to reducing economic disparities between voivodeships in Poland.[4]
The text is organized as follows. We start with a short presentation of SEZs as an investment policy instrument (section 2). Then we discuss in detail the presence of SEZs in regions (voivodeships). Section 4 contains a brief information on Polish Investment Zone – a successor of SEZs. In section 5 we analyse the relationship between investment outlays in SEZs in a regional perspective and GDP per capita. The last section contains conclusions.
There are many more or less elaborate formal definitions of a special economic zone adopted by different jurisdictions. Leaving aside the legislative details, for analytical purposes, a zone can be defined as “a geographically delimited area within which a government facilitates economic activity through fiscal and regulatory incentives and infrastructure support” (World Investment Report 2019: 128). UNCTAD considers the legal regime to be the most important distinctive feature and pre-condition included in this definition. This condition is fulfilled by special economic zones in Poland, which, although not distinguished geographically as a compact area, are separate administrative and legal entities (by virtue of the Act of 1994).
Investing in Polish SEZs provides entrepreneurs with a number of benefits, but is also associated with various costs. Neither of these two categories has fundamentally changed since Poland negotiated the terms of its EU accession. However, the need to adopt the EU state aid rules has weakened the strength of previous preferences (Ministry of Economy and Labour 2005). A summary of the incentives and constraints making up the costs of entry into the zone is provided in Table 1.
| Incentives | Constraints |
|---|---|
| Exemption from income tax | Obtaining an investment permit |
| Developed investment plots | Minimum thresholds for employment, investment value, and own equity share |
| Technical infrastructure | Current charges for using the services offered by the SEZ |
| Organisational and legal assistance when starting a business | Minimum period of stay in the SEZ (3–5 years) |
| Possible exemption from commercial property tax and certain other charges (granted by local and regional authorities) | Repayment of aid received (with interest) if the conditions of the authorisation are not fulfilled |
| Ban on production relocation from the European Economic Area countries |
Investors consider corporate and personal income tax exemptions from part of their activities within the zone to be the most important incentive (KPMG 2014). The basis for calculating the amount of the CIT exemption, the major part of the fiscal support, is the value of the capital expenditure incurred (chosen by the vast majority of investors) or the two-year actual cost of hiring new employees. The exemption applies after the start of operations, as profits are made, until the amount due is exhausted.
The second incentive is developed investment areas, usually in attractive locations, which the investor can purchase or lease at a favourable price through competitive tendering. The plots are developed by the zones themselves, i.e., by their management companies and at their cost, or by local government units and other entities (e.g. GDDKiA (ZMCs) – General Directorate for National Roads and Highways).
A third incentive is access to ready technical infrastructure (equipment and transmission networks) within the zone. The fourth is ZMC’s assistance in legal and organisational matters related to starting up the business, as well as possible cooperation in the search for employees or business partners. A fifth incentive may be commercial property tax exemptions, however, their possible granting rests in the discretion of the municipality hosting the zone, not the ZMC.
Special economic zones in Poland are geographically dispersed. At the end of 2019, they covered investment areas of a total area of 22,949.5 hectares, located in 186 cities and 311 municipalities. This means that zone areas could be found in one in five Polish cities and one in eight municipalities.
Typically, the subzones and investment plots of one zone are scattered across several voivodeships and a dozen or even several dozen counties, often several hundred kilometres away. At the top of the list is the Tarnobrzeg SEZ, whose investment areas can be found in as many as six regions. The Starachowice, Mielec, and Pomorska SEZs have plots in five voivodeships. When it comes to counties, the Katowice (33), Pomeranian (30), and Kostrzyń-Slubice (26) SEZs cover the biggest number of those. Only three SEZs operated in an area smaller than 10 counties.
Two voivodeships, Wielkopolskie and Mazowieckie, proved to be the most attractive for investors. In response to investors’ demand, as many as five SEZs decided to locate their investment plots in these two regions, although none of them had their headquarters (zone management companies) there. Dolnośląskie and Lubelskie voivodeships were only slightly less popular (4 SEZs in each region).
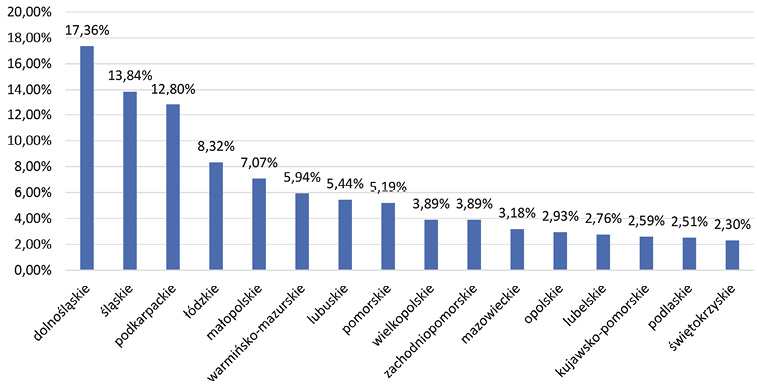
The uneven regional distribution of SEZ investment in the regions is evidenced by statistics on the number of valid permits, the value of investment outlays and the number of jobs created. In terms of the number of valid permits, Dolnośląskie voivodeship emerged as an undisputed leader (Figure 1) with over 17% of all permits granted there. Nearly 80% of them were granted to entities with foreign capital. Two more voivodeships, Śląskie and Podkarpackie, recorded more than 10% of all valid permits, 13.84% and 12.80%, respectively. In the latter, most permits were granted to domestic investors (almost 64%). In total, these three regions accounted for as much as 44% of all valid SEZ permits in Poland. On the other hand, five voivodeships with the smallest share accounted in total for only 13% of permits. The largest share of permits granted to foreign investors was recorded in the Dolnośląskie (79.5%), Lubuskie (66%), Opolskie (64%), Śląskie (63%), and Łódzkie (60%) voivodeships. Domestic entities clearly dominated in the eastern part of the country.
Since the SEZs started operating until the end of 2019, the cumulative value of total investment outlays (made by domestic and foreign investors) incurred in them reached almost PLN 132 billion. Nearly 1/4 of capital expenditures fell on the Dolnośląskie voivodeship. The top three was completed by Śląskie (15.10%) and Łódzkie (11.11%). Thus, only these three regions attracted almost half of the value of all SEZ investments in Poland (Figure 2). Worth noting is that the latter two hosted investment areas of almost exclusively one SEZ (Katowice SEZ and Łódź SEZ, respectively). This may mean that the success of these two regions in attracting SEZ investment can be largely attributed to their management companies.
Figure 1. The share of voivodeships in the total number of permits granted in SEZs (as at 31.12.2019)
Source: authors’ research based on data prepared by the Special Economic Zones Division, Department of Investment Development of the Ministry of Development.
Voivodships at the top of the ranking by the value of investment outlays attracted mainly foreign investors. The undisputed leader in this ranking was again Dolnośląskie, where the share of the value of investment outlays made by businesses with foreign capital was 96.85%. A relatively high indicator, exceeding or close to the average for the whole country (76.57%), was recorded in most of the voivodeships of western and central Poland: Opolskie (89.15%), Wielkopolskie (87.13%), Śląskie (84.31%), as well as in Pomorskie (76.94%), and Łódzkie (76.51%). Domestic enterprises invested the most in the eastern and southern parts of the country.
Nearly half of the almost four hundred thousand jobs in SEZs were created in only three voivodeships, i.e., Śląskie (17.42%), Dolnośląskie (16.94%), and Podkarpackie (12.95%) (see Figure 3). Foreign investors were instrumental in each of them as their share reached, respectively, 93%, 85% and 64% of total jobs in subzones located in these regions.
In voivodeships where domestic entrepreneurs prevailed, SEZ investments did not generate such employment outcomes. In the five regions with the highest share of Polish companies (Lubelskie, Podlaskie, Świętokrzyskie, Małopolskie, and Mazowieckie), only 15.5% of all SEZ jobs were created.
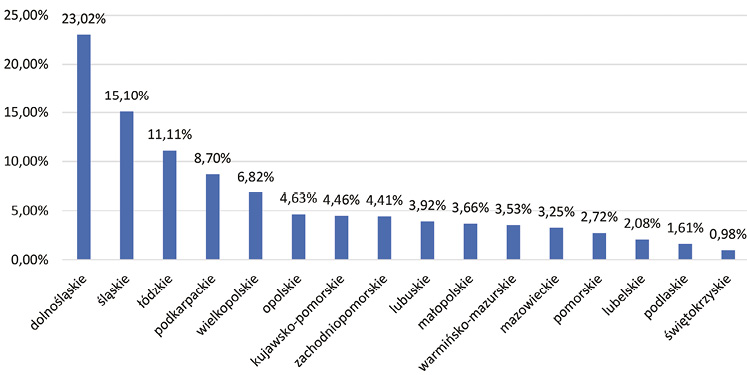
Figure 2. The share of voivodeships in total investment outlays in SEZs (as at 31.12.2019)
Source: see Figure 1.
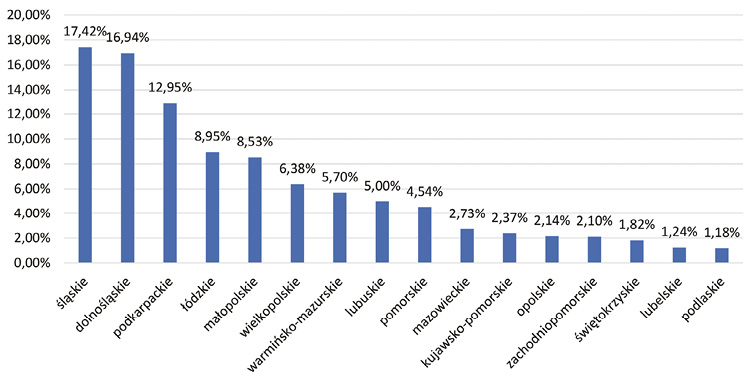
Figure 3. Share of voivodeships in the total number of jobs created in SEZs (as at 31.12.2019)
Source: see Figure 1.
A total of 1,579 companies have invested in the 14 SEZs. Most investments were located in the Dolnośląskie (260), Śląskie (206), and Podkarpackie (184) voivodeships. 63% of the total business population in SEZs were concentrated in six regions (Figure 4).
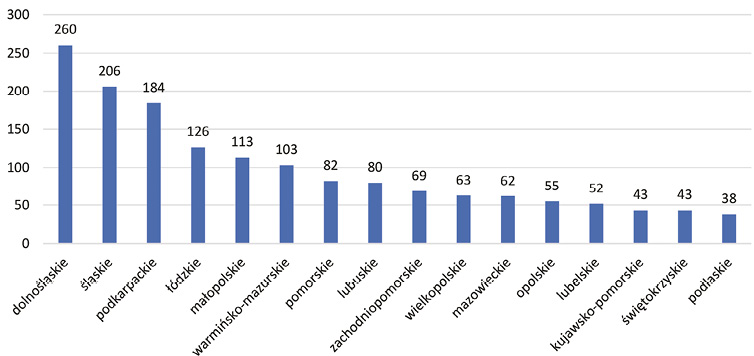
Figure 4. Domestic and foreign companies in SEZs in 16 voivodeships (as at 31.12.2019)
Source: see Figure 1.
In terms of the number of enterprises, voivodeships in south-western and central Poland attracted the greatest interest of foreign investors (Figure 5). A share of over fifty per cent was recorded in the Dolnośląskie, Lubuskie, Opolskie, Śląskie, and Łódzkie regions. The picture was similar to the previously presented share of foreign companies in the number of valid zone permits.
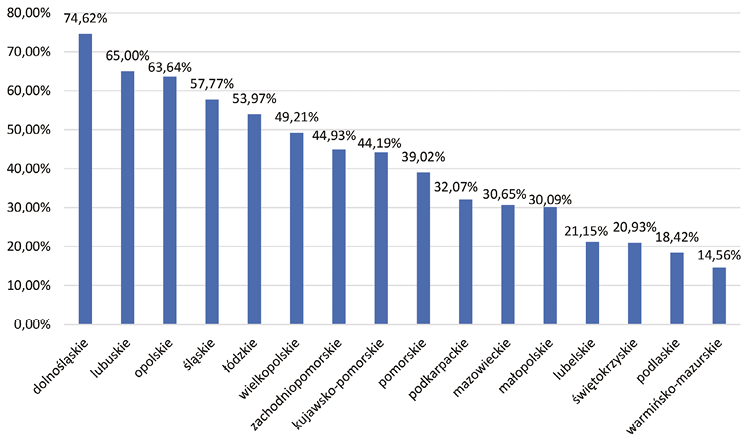
Figure 5. Share of foreign companies in the total population of businesses in SEZs in all 16 voivodeships (as at 31.12.2019)
Source: see Figure 1.
In seven voivodeships large enterprises dominated among SEZ investors. Relatively most of them chose Łódzkie voivodeship as a location for their business. Their share in the total number of domestic and foreign investors there exceeded 64%. Large investors usually prevailed in regions where the highest investment outlays were made by enterprises with foreign capital. These were regions in the western, south-western and central parts of the country (see Figure 6).
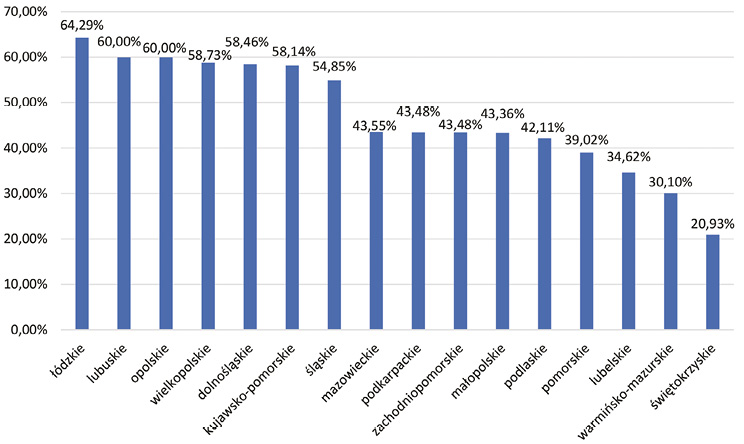
Figure 6. Share of large (domestic and foreign) enterprises in the total population of businesses in SEZs (as at 31.12.2019)
Source: see Figure 1.
The regions were also quite diverse in terms of leading industries among SEZ investors. However, some regularities can be observed if we make a distinction according to the origin of capital. Among foreign investors, there is a clear dominance of the automotive industry. Companies with foreign capital invested the biggest amounts in motor vehicle production (section 29)[5] in as many as seven regions located mainly in the western and southern parts of the country. In the Pomorskie and Kujawsko-Pomorskie voivodeships, foreign investors incurred the greatest outlays on the production of paper and paper products (section 17), in the Łódzkie and Lubelskie voivodeships on the production of fabricated metal equipment (section 25), and in the Podlaskie and Zachodniopomorskie voivodeships on the production of rubber and plastic products (section 22).
When it comes to domestic investors, sectoral concentration is less evident, although even here regional champions can be identified. In four voivodeships in southern and north-western Poland (Śląskie, Małopolskie, Pomorskie, and Zachodniopomorskie), SEZ investments are dominated by the manufacture of fabricated metal equipment (section 25). In the Mazovia region and in two regions in eastern Poland (Lubelskie and Warmińsko-Mazurskie voivodeships), domestic companies invested most in the production of food and food products (section 10). In the two voivodeships of western Poland, i.e., Lubuskie and Opolskie, the leading sector among Polish companies was the automotive industry (section 29). The Podkarpackie and Podlaskie voivodeships were dominated by manufacturers of wood products (section 16), while in central Poland (the Łódzkie and Świętokrzyskie voivodeships), domestic producers of other non-metallic mineral products (section 23) led the way.
In summary, the voivodeships in the west and south of Poland were dominated by the automotive industry. In the east, the main investors were wood product manufacturers and food and grocery producers. Northern Poland was mainly marked by the production of machinery and equipment, rubber and plastic products, as well as paper and paper products. The central part of the country attracted, among others, manufacturers of finished appliances, computers, electronic and optical products, and other non-metallic mineral products.
The Act of 20 October 1994 on Special Economic Zones is to remain in force until the end of 2026, but only for permits issued before 30 June 2018,[6] i.e., before the entry into force of the Act of 10 May 2018 on supporting new investments, which established the so-called Polish Investment Zone (Polska Strefa Inwestycji – PSI). Thus, decisions on support (instead of permits) are now issued by SEZ management companies solely on the basis of the new law that stipulates the criteria and forms of investment support in Poland.[7]
At present, the SEZ management companies (ZMCs) operate within their respective territorial competence set out in the implementing regulation to the Act.[8] Each management company has areas assigned to it, i.e., groups of counties (and cities with county status), in which they may carry out their operations and offer business support services to entrepreneurs.[9] The number of counties within the area varies greatly depending on the company. For example, the Legnica SEZ manages only 9 counties and the Kamienna Góra SEZ manages 11. At the opposite end of the spectrum are companies coordinating investments in at least several dozen counties, e.g., the Łódz SEZ – 45, the Katowice SEZ – 42, the Kostrzyń-Słubice SEZ – 40.
In the first period of the PSI (2018–2019), the Śląskie Voivodeship was the leader of investment outlays, with entrepreneurs declaring projects worth over PLN 3.31 billion. Four more regions in southern and central Poland were at the top, i.e., Małopolska (PLN 2.48 billion), Opolskie (PLN 1.89 billion), Dolnośląskie (PLN 1.88 billion), and Łódzkie (PLN 1.84 billion). The total share of these five regions in the declared value of total investment outlays was almost 55%. In four voivodships (except Małopolska), higher outlays were declared by foreign investors. In Dolny Śląsk this proportion exceeded fifteen times the value of domestic investments. On the other extreme were voivodeships from the eastern and north-eastern parts of the country (Warmińsko-Mazurskie PLN 0.57 billion, Świętokrzyskie PLN 0.24 billion, Podlaskie PLN 0.18 billion, Pomorskie PLN 0.62 billion, and Mazowieckie PLN 0.81 billion), where the value of investments did not exceed PLN 1 billion. In terms of value (declared investment outlays) and quantity (number of investment projects), domestic companies definitely dominated there.
Interesting conclusions can be drawn from comparing the rankings of voivodeships by the value of investments in SEZs and under the Act of 2018 on supporting new investments (Table 2). In both cases, regions situated in southern, central and western Poland proved to be the most attractive for investors. These were mainly voivodeships where companies with foreign capital were in the lead (among SEZ investors) (e.g., Dolnośląskie, Śląskie, Łódzkie). An exception were two regions, i.e., Małopolska and Podkarpackie, which owed their relatively high positions in the rankings mainly to domestic companies.[10]
| No. | Voivodeship | Share of voivodeships in total investment outlays in SEZ | No. | Voivodeship | Share of voivodeships in total investment outlays in PSI |
|---|---|---|---|---|---|
| 1 | 2 | 3 | 4 | 5 | 6 |
| 1 | Dolnośląskie | 23.02 | 1 | Śląskie | 15.85 |
| 2 | Śląskie | 15.10 | 2 | Małopolskie | 11.86 |
| 3 | Łódzkie | 11.11 | 3 | Opolskie | 9.08 |
| 4 | Podkarpackie | 8.70 | 4 | Dolnośląskie | 8.98 |
| 5 | Wielkopolskie | 6.82 | 5 | Łódzkie | 8.81 |
| 6 | Opolskie | 4.63 | 6 | Wielkopolskie | 8.07 |
| 7 | Kujawsko-Pomorskie | 4.46 | 7 | Podkarpackie | 6.67 |
| 8 | Zachodniopomorskie | 4.41 | 8 | Kujawsko-Pomorskie | 5.32 |
| 9 | Lubuskie | 3.92 | 9 | Zachodniopomorskie | 4.98 |
| 10 | Małopolskie | 3.66 | 10 | Lubelskie | 4.89 |
| 11 | Warmińsko-Mazurskie | 3.53 | 11 | Lubuskie | 3.98 |
| 12 | Mazowieckie | 3.25 | 12 | Mazowieckie | 3.88 |
| 13 | Pomorskie | 2.72 | 13 | Pomorskie | 2.94 |
| 14 | Lubelskie | 2.08 | 14 | Warmińsko-Mazurskie | 2.71 |
| 15 | Podlaskie | 1.61 | 15 | Świętokrzyskie | 1.15 |
| 16 | Świętokrzyskie | 0.98 | 16 | Podlaskie | 0.84 |
Statistical data suggest that between 2002 and 2020,[11] i.e., when 14 SEZs were in operation, disparities between voivodeships measured with average GDP per capita and gross fixed assets in the manufacturing sector decreased while differences in unemployment rate slightly deepened (Table 3).
The average value of GDP per capita in the voivodeships in 2020 compared to 2002 increased by 178%. The differentiation was small (the coefficient of variation did not exceed 21%) and decreased by 6 percentage points, i.e., by more than one-fourth. Over the same period, the average gross value of fixed assets in manufacturing increased threefold. The disparity was relatively large (coefficients of variation amounted to 71% in 2004 and 63% in 2020) but they also decreased (by 8 pp, i.e., by more than one-tenth). The average unemployment rate in the voivodeships in Poland between 2002 and 2020 decreased by nearly 13 pp, which represented a reduction by as much as 64%. The variation was small, although, contrary to the two other indicators, it increased by 2.24 pp in the period under review (less than one tenth). On the whole, we can conclude that regional disparities were reduced between 2002 and 2020.
| Voivodeship | GDP per capita (PLN, current prices) |
Gross fixed assets in manufacturing (in thousands of PLN, current prices) |
Unemployment rate (%) | |||
|---|---|---|---|---|---|---|
| 2002 | 2020 | 2004 (a) | 2020 | 2002 | 2020 | |
| Dolnośląskie | 21,193 | 67,104 | 22,526,595 | 97,842,566 | 22.4 | 5.6 |
| Kujawsko-Pomorskie | 18,635 | 50,246 | 15,520,469 | 44,678,493 | 22.5 | 9.0 |
| Lubelskie | 14,300 | 42,370 | 6,201,444 | 23,096,005 | 15.7 | 8.2 |
| Lubuskie | 17,850 | 50,209 | 6,898,842 | 23,735,645 | 26.0 | 6.3 |
| Łódzkie | 18,492 | 59,529 | 16,216,317 | 51,289,756 | 18.4 | 6.2 |
| Małopolskie | 17,659 | 55,138 | 18,328,342 | 59,771,651 | 13.8 | 5.3 |
| Mazowieckie | 31,115 | 53,288 | 42,393,512 | 61,185,256 | 13.8 | 5.2 |
| Opolskie | 16,738 | 48,834 | 6,623,473 | 24,840,364 | 19.4 | 6.9 |
| Podkarpackie | 14,569 | 42,501 | 12,461,540 | 41,892,279 | 16.9 | 9.1 |
| Podlaskie | 15,719 | 45,345 | 4,872,515 | 17,776,796 | 15.1 | 7.8 |
| Pomorskie | 20,346 | 57,680 | 12,953,706 | 47,552,713 | 21.3 | 5.9 |
| Śląskie | 22,627 | 61,641 | 39,558,971 | 126,574,131 | 16.5 | 4.9 |
| Świętokrzyskie | 15,977 | 44,789 | 8,281,784 | 21,848,070 | 18.5 | 8.5 |
| Warmińsko-Mazurskie | 15,528 | 43,662 | 7,067,526 | 24,313,024 | 28.9 | 10.2 |
| Wielkopolskie | 21,072 | 66,499 | 29,837,945 | 92,093,548 | 15.9 | 3.7 |
| Zachodniopomorskie | 20,196 | 51,790 | 7,571,254 | 25,174,569 | 26.6 | 8.4 |
| Min. | 14,300 | 42,370 | 4,872,515 | 17,776,796 | 13.8 | 3.7 |
| Max. | 31,115 | 67,104 | 42,393,512 | 126,574,131 | 28.9 | 10.2 |
| Mean | 18,876 | 52,539.06 | 16,082,139.69 | 48,979,054.1 | 19.48125 | 6.95 |
| Standard deviation | 3,986.992 | 7,874.941 | 11,494,849.38 | 31,007,697.5 | 4.5509915 | 1.7790447 |
| Vs | 21% | 15% | 71% | 63% | 23, 36% | 25.60% |
SEZs should have had some influence on these processes. Indeed, a statistically significant relationship can be observed between the level of regional growth measured by GDP per capita and the value of capital expenditures in SEZs on a regional basis (at the end of 2019). The correlation diagram 1 (Fig. 7a) and the low value of the coefficient of determination (R2) indicate that the relationship between the studied characteristics is curvilinear. Thus, Spearman’s rank correlation coefficient was used to assess the relationship between the variables. Its value (0.547) suggests that there is a moderate positive correlation and means that investments flowed mainly into SEZs based in the richest voivodeships. In contrast, the value of this coefficient for 2002 was lower, at 0.415 (Fig. 7b), showing weaker but still positive correlation between the variables.
This confirms the conclusion that the capital was not accumulated in the poorest voivodeships that initially were supposed to benefit the most from SEZ policy. Therefore it can be argued that SEZs probably did not contribute to declining regional disparities or might even act as factor that was increasing them. Clarifying this matter would require further, more detailed research. In particular, attention would need to be paid to the changes that SEZ investments have caused in their surroundings, i.e., in the economies of the host voivodeships.
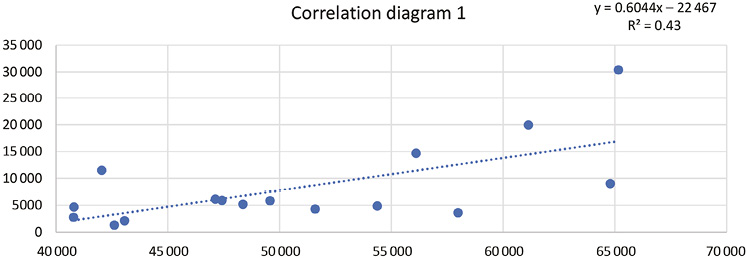
Figure 7a. Relationship between investment outlays in SEZs at a regional perspective and GDP per capita (at the end of 2019)
Source: authors’ research based on data of the Statistics Poland.
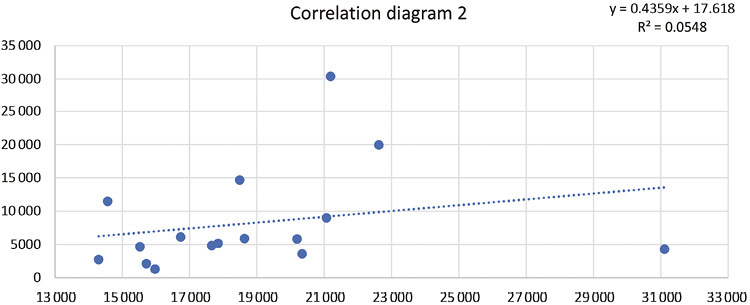
Figure 7b. Relationship between investment outlays in SEZs at a regional perspective and GDP per capita (at the end of 2002)
Source: authors’ research based on data of the Statistics Poland.
The investments that flowed into the special economic zones could be found in southern, central and western Poland, i.e., they were scattered across almost the entire country. Nonetheless the leaders were Dolnośląskie and Śląskie, both characterized by above average GDP levels per capita in 2002. Śląskie kept its advantage and Dolnośląskie increased it significantly in 2020.
However, the economically weakest voivodeships should have been the main beneficiaries of this policy. Yet, this did not happen. It was mainly due to a low foreign investors’ interest in choosing such locations. As a result, the zones probably failed to contribute to reducing the disparities between voivodeships in the level of development inherited from the command economy.
Act of 10 May 2018 on supporting new investments, Journal of Laws of 2018, item 1162, with further amendments.
Act of 20 October 1994 on Special Economic Zones, Journal of Laws of 2019, item 482, with further amendments.
Ambroziak A.A. (2015), The Effects of Granting State Aid in Special Economic Zones after Poland’s Accession to the European Union, [in:] G. Wojtkowska-Łodej, H. Bąk (eds.), Selected Aspects of Functioning of Poland in the European Union. The Balance of Ten Years of Membership, Warsaw School of Economics Press, Warsaw.
Crane B., Albrecht Ch., McKay Duffin K., Albrecht C. (2018), China’s Special Economic Zones: An Analysis of Policy to Reduce Regional Disparities, “Regional Studies, Regional Science”, vol. 5(1), pp. 98–107. https://doi.org/10.1080/21681376.2018.1430612
Dorożyński T., Świerkocki J. (2022), Specjalne Strefy Ekonomiczne w Polsce. Doświadczenia i perspektywy, Wydawnictwo Uniwersytetu Łódzkiego, Łódź.
Dorożyński T., Świerkocki J., Dobrowolska B. (2021), Governance of Special Economic Zones and Their Performance: Evidence from Poland, “Entrepreneurial Business and Economics Review”, vol. 9(3), pp. 149–167. https://doi.org/10.15678/EBER.2021.090310
Hornok C., Raeskyesa D.G.S. (2023), Economic Zones and Local Income Inequality: Evidence from Indonesia, “Journal of Economic Inequality”. https://doi.org/10.1007/s10888-023-09581-x
Jensen C. (2018), The Employment Impact of Poland’s Special Economic Zones Policy, “Regional Studies”, vol. 52(7), pp. 877–889. https://doi.org/10.1080/00343404.2017.1360477
Jensen C., Winiarczyk M. (2014), Special Economic Zones – 20 Years Later, CASE Research Paper, no. 467, Warsaw.
KPMG (2014). 20 years of special economic zones in Poland.
Ministry of Economy and Labour (2005), Special Economic Zones in Poland as at 31 December 2004, Warsaw.
Regulation of the Minister for Entrepreneurship and Technology of 29 August 2018 on the delimitation of territories and territorial competence of managing entities, Dz.U. RP [Journal of Laws of the Republic of Poland] of 4 September 2018, item 1698.
World Investment Report (2019), Special Economic Zones, United Nations Conference on Trade and Development (UNCTAD), New York, Geneva.
Abstrakt. Głównym celem artykuły jest zaprezentowanie wyników specjalnych stref ekonomicznych (SSE) w układzie wojewódzkim osiągniętych w ciągu 25 lat działalności oraz ich roli w ograniczaniu regionalnych nierówności gospodarczych. SSE utworzono z myślą, aby łagodzić trudności związane z bezrobociem, które ujawniła transformacja polskiej gospodarki. Liczono, że dzięki zachętom inwestycyjnym kapitał napłynie przede wszystkim do regionów najbardziej dotkniętych zmianami. Intencje te nie znalazły jednak ustawowego zabezpieczenia. W efekcie inwestycje strefowe koncentrowały się w południowej, centralnej i zachodniej Polsce, czyli znalazły się na terenie niemal całego kraju. Tylko wschodnie, najbiedniejsze województwa cieszyły się wyraźnie mniejszym zainteresowaniem. Było ono pochodną struktury własnościowej kapitału. W strefach zdecydowanie dominowali bowiem inwestorzy zagraniczni. Pewne zmiany w tym zakresie przyniosła Polska Strefa Inwestycji, następczyni SSE. Proste analizy statystyczne sugerują, że, wbrew założeniom, strefy nie przyczyniły się do zmniejszenia regionalnych dysproporcji mierzonych poziomem PKB na mieszkańca, a nawet mogły oddziaływać w kierunku ich wzrostu. Rozstrzygniecie tej kwestii wymagałoby bardziej pogłębionych badań.
Słowa kluczowe: specjalne strefy ekonomiczne, spółka zarządzająca strefą, inwestycje, dysproporcje regionalne, województwa.
