Abstract. North Macedonia can improve its economic growth by addressing the infrastructure gap by at least full capital budget utilisation. The outturn/execution of capital budget expenditures is low and in relative terms decreasing. The planned public finances for regional balanced development are also low and non-compliant with the legally set levels. A test of several hypothetical scenarios of full capital budget utilisation it is expected to positively contribute to the economic growth immediately and in the period to follow. Even if total debt increases in nominal terms, in relative terms the debt-to-GDP on a longer-run reduces through generating additional economic output.
Key words: regional development, infrastructure, external debt, North Macedonia, capital expenditure, public investments.
North Macedonia as part of the Western Balkan (WB) region aspires to become an integral part of the European Union (EU). Meanwhile, the EU enlargement process continues to be the key reform-driving mechanism for the region as candidate countries are obliged to implement the EU acquis. The European Commission’s strategy for ‘A credible enlargement perspective for an enhanced EU engagement with the Western Balkans’ (EC, 2018) foresees an Action Plan with six flagship initiatives targeting specific areas of common interest. One of the flagship initiatives is the improvement of transport, and energy connectivity. Aligning the quality of infrastructure with that of the EU is one of the European Commission’s (EC) priorities for the region. Public infrastructure is considered to be an essential driver for economic growth and job creation, thus the WB took steps towards greater connectivity following the 2015 WB Summit. In the period from 2014 to 2020, the EU pledged up to one billion EUR for infrastructure in the WB and has distributed over 70% (as of 2018) of those funds, providing support for 31 infrastructure projects (EC, Connectivity Agenda, 2018).
The paper focusses on the following questions: What is the size of under-executed public capital expenditures as a ‘gap’ reflecting the capital infrastructure needs in North Macedonia (reflected through the capital expenditure budget of the local governments) and the level of actual implementation (through the execution of capital budgets)? What are the differences in and among the eight statistical planning regions? Would the debt be significantly affected if these infrastructure finances were actually fully completed and financed through external debt? Would these potential investments have contributed positively to the economic growth?
There is no general consensus on the degree of importance of public investments as productivity factors in the economic development process, however, it is generally agreed that it complements productivity and thus economic output. The role of infrastructure (as a significant part of public investment) on sub-national development has also been examined. The availability and quality of infrastructure appears to have an impact on the economic productivity and the social wellbeing at least through: direct output contribution, increased aggregate demand, and influences on private sector investment location. The potential growth benefits from addressing infrastructure gaps are likely to be significant especially for developing countries and emerging markets, more than for developed economies. A study on public infrastructure for WB showed that closing the infrastructure gap by 20 pp would generate higher annual real GDP growth rates by about 0.2 to 0.3 pp over the medium term (Atoyan et al., 2018).
In the framework of the Berlin Process, the EC estimated a total transport infrastructure investment volume of 7.7 billion EUR. According to estimates, over a period of 15 years, this would cause an additional GNP growth impulse of about 1 pp and a positive employment effect of up to 200,000 people or about 4% of the workforce (Holzner et al., 2015).
Regarding North Macedonia, IMF (2016b) forecasted that the four ongoing highways and railway investment projects would result in 2% to 3% annual GDP growth for the period from 2014 to 2018 and were likely to raise the real GDP growth rate by 0.5 pp on average each year from 2014 to 2020; furthermore, the study forecasted that enhancing public investment efficiency could increase growth effects by up to 0.8 pp.
It should be noted that despite the fact that infrastructure projects have a positive effect on economic performance in general, one could expect their financing to have the opposite effect on the economy and that not all types of financing would be equally desirable (Pereira, 2013). For instance, since Chinese funds move in exclusively in the form of loans, this can create risks of unsustainable debt burdens for some countries in the WB region (Hurley et al., 2018).
In industrial countries, infrastructure investment is decentralised to a significant extent (Estache and Sinha, 1995). However, studies suggest that revenue mobilisation efforts of local governments (and or other sub-national governments) in most developing countries need to be increased if local governments are to assume more responsibility for delivering infrastructure services. Public infrastructure is of great interest for reaching more balanced regional economic development because of the positive spill-over effects on the local economy (Fisher and Sullivan, 2016). Larger public investments, especially in infrastructure, are considered essential for long-term growth though they induce rising public deficits, and debt-to-GDP ratios, at times coupled with the inability of the public sector to deliver efficient investment spending (OECD, 2015).
The purpose of this paper is to provide an overview and analysis of the topic of public capital budget deficiencies in North Macedonia by offering an overview of the level of public investments, compare and contrast their distribution and structure per statistical planning regions, as well as to identify the mismatch between the planned and executed capital expenditure at the statistical planning regions’ level (hereinafter referred to as regions[1]). Furthermore, we conclude with several hypothetical simulations of the possible macroeconomic effects of debt-financed infrastructure projects.
The data on the magnitude of regional investments is measured through the size of capital expenditure per statistical regions, calculated as a sum of the public capital investments of each municipal budget and the final accounts within the planning region. Individual municipal data is collected from the enacted budgets and the final annual budget accounts.
Firstly, the paper gives an overview of the budgetary data on capital expenditure in North Macedonia, over the course of the last decade at the central and regional level. The data was obtained from the Ministry of Finance’s final accounts of the Budget of the Republic of North Macedonia (RNM) for the period from 2008 to 2019, the State Statistical Office (SSO) Databases, the Ministry for Local Self-government, and the Bureau for Regional Development of North Macedonia. The capital expenditure in North Macedonia can be categorised into three groups depending on the source of funding: 1) capital expenditures financed from the central government budget; 2) capital expenditures financed through the municipal budgets, and 3) capital expenditures at the statistical planning regions’ level funded by the Reginal Development Programs (RDP).
As we analyse the trends related to capital expenditure we indicate the unbalanced capital expenditure size among the eight regions in North Macedonia.[2] The data indicates the size of the recurrent budget, capital budget, and the outturn rate of capital expenditure, overall on a central level and per region, for the period 2008–2019. Furthermore, we provide an overview of the structure of capital budget expenditure per sub-category: equipment and machinery, buildings, other construction, furniture, strategic goods and reserves, non-financial assets, vehicles, and capital subsidies to public enterprises and NGOs.
To qualify the infrastructure gap is a challenging task and beyond the scope of the paper due to limitations, thus we will assume that planned budgetary capital expenditures reflect the needs in terms of investment size. Thus we will use it as an estimate of the gap (as a difference of the planned and executed capital budget) as a value of the minimum ‘mismatch’ between the needs and the public sector’s capacity to invest (as true data to identify the infrastructure gap is not attainable). Thirdly, under specific assumptions we estimate the possible effect over the debt-to-GDP if the full execution of the planned capital budgets in North Macedonia takes place and is financed by debt.
For the purpose of estimating the macroeconomic effect of foreign external debt financing of infrastructure mismatch (defined as the difference between the plan and the execution of the capital budget), we use the Macroabc[3] model. The model is a financial programming model based on behavioural equations calibrated to the Macedonian economy. We analyse several different scenarios related to debt-financing the identified gap between the planned and actual capital budgets of the local governments in North Macedonia from a regional perspective.
The Baseline scenario is calculated based on historical data, Scenario 1 measures the effect on the total debt-to-GDP if the identified infrastructure mismatch is completely financed by foreign debt during 2020, Scenario 2 measures the effect on the total debt-to-GDP if the identified infrastructure mismatch is completely financed by foreign debt during 2020 under the assumption of full capital budget execution over the next five years.
In the last decade the construction sector in North Macedonia was marked by the Skopje 2014 infrastructure project, which was estimated to a value of over 600 million EUR, primarily consisting of buildings and monuments located in the capital City of Skopje. In the meanwhile, there have been regular and significant underexecutions of the central budget’s capital expenditure plans, even subsequent to the frequent supplementary budgets (almost every fiscal year), predominantly with significant capital budget cuts. The underlying reasons are manifold, starting from the absorptive capacity of institutions, a lack of fully developed programs and multi-annual planning, deficiency of performance assessments, or other structural hindrances. Overall, capital budget outturn contributed 10% to the total state budget (10-year average), ranging from the decade highest of 14% in 2008, to lowest 6% in 2018. The average annual absolute value of the capital budget of North Macedonia (central level) in the last decade (2009–2019) amounted to 17 billion Macedonian denars[4] (MKD) or around 277 million EUR. In the same period, the planned annual average capital budget was 349 million EUR after the supplementary budgets, resulting in an average execution rate of 79%, with the lowest rate of 66% in 2018 and the highest of 88% in 2012 (Fig. 1).
During the same period, according to the World Bank’s Logistics Performance Index (LPI), the quality of trade and transport-related infrastructure was moderately low and even lower compared to 2010. In 2018, investments continued to contract due to delayed large public infrastructure projects, while in 2019 the economic growth rate increased to 2.8% as a result of the continued infrastructure investment because of the lifting of moratoria on building permits issuance in large municipalities (IMF, 2016a).
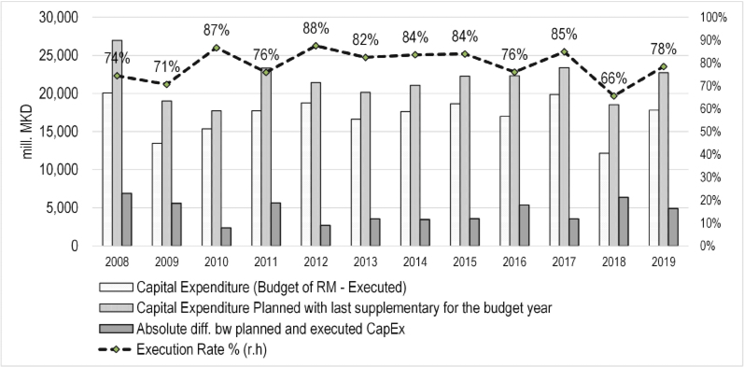
Fig. 1. Execution of the capital budget at the central government level (million MKD) 2008–2018)
Source: own work based on data from the Ministry of Finance of North Macedonia’s Treasury reports, Enacted Budgets, Supplementary Budgets and Final Account for the period from 2008–2019.
Regional development imbalances in the Republic of North Macedonia have created concerns over time due to the continuous expanding of the gap since 2011, measured by the GDP variation coefficient across the eight statistical planning regions (Nikolov, 2017) and have continued to be significantly large (Fig. 2).
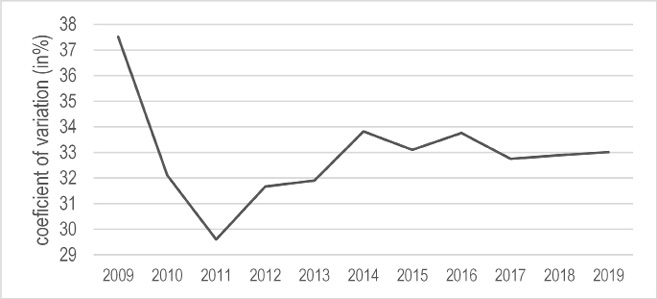
Fig. 2. Coefficient of variation of regional per capita output)
Source: own work based on data for GDP per statistical region of the SSO.
One of the mechanisms in place for inducing more balanced regional development in RNM is the Balanced Regional Development Program (BRDP), which in the adequate Law (OG of RM 63/2007) stipulates that annually at least 1% of the GDP is to be allocated to the BRDP. However, neither the planned budget nor the implemented projects jointly match to the legally set amount (Fig. 3). Most of the projects financed by the program are short-termed and for basic local infrastructure (such as waste water, sewerage, local road maintenance, etc.) with low per project value (on average: 30,000 EUR). The distribution of BRDP capital expenditures per a planning region indicate that the highest absolute values in infrastructure investments are allocated in the Northeast planning region (~17%) and the lowest in the Skopje Region (8%). The underlying reason is of a methodological nature since the Northeast planning region is among the least developed, and thus absorbs the largest part of the funds, unlike the Skopje Planning Region which receives the lowest portion of capital expenditure BRDP funds as it is the most developed.
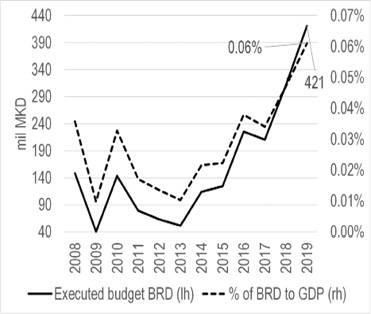
Fig. 3. Regional Development Program Funds
Source: own work based on data from the enacted budgets & budget final account of RNM.
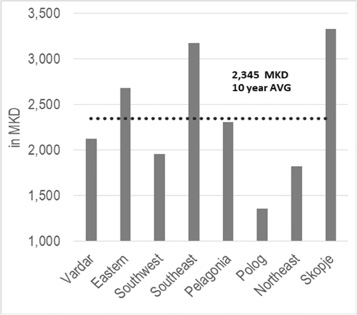
Fig. 4. Ten year average capital expenditure per capita per region
Source: own work based on data from the enacted budgets & budget final account of RNM.
Another source of public investments are the local (municipal) budgets which are part of specific statistical regions. The average capital expenditure per capita showed an increase from 1,455 MKD in 2008 to 3,078 MKD in 2019, however, with significant standard deviation among the regions, and lower per capita expenditure in the least developed regions (Fig. 4). The average contribution of capital expenditure to the total planned budget expenditure (in local budgets) increased by 6 pp from 2010 to 2017 but then it dropped again which may have reflected a slight improvement in the local governments’ efforts towards increased capital budget expenditures. Nevertheless, the actual budget execution rate has remained steady at 18% on average of the total budget expenditure, with a significant gap between the planned and actual implementation of the local investments (Fig. 5). Furthermore, the ratio between the capital-to-total budgets confirms the large differences among the least and the most developed regions. The decade average contribution of the capital budget for the least developed regions, such as Polog and Northeast planning regions’ municipalities was 12% and 15% accordingly, while Skopje region with 28% (average for 2010–2019).
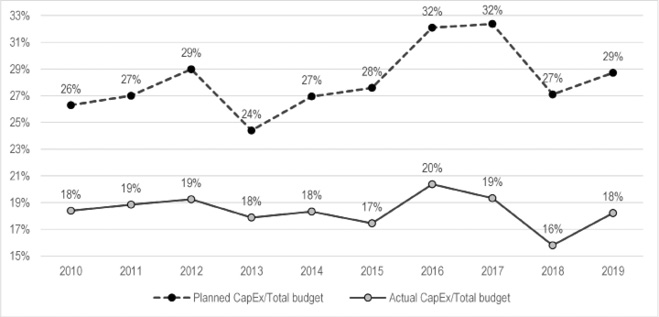
Fig. 5. Cumulative municipal planned and actual capital budget expenditure percentage of the total budget )
Source: own work based on data of the State Budget of the Republic of Macedonia 2010–2019.
As shown in Fig. 6, in 2019 the Southwest Region had the highest execution rate of planned capital expenditures, with 63.5%, followed by the Eastern Region with 62.7%, the Southeast Region 59.2%, and the Skopje Region with 57.2%. The execution rate of capital budgets was somewhat lower in the Northeast with 60%, Polog and Vardar with 53%, and Pelagonia with 40%.
Overall in absolute figures, in 2017 the Skopje Region had the largest capital investments of 3.3 billion MKD, followed by the Southeast Region with 590.6 million MKD, Eastern Region with 577.5 million MKD, and Pelagonia Region with 572.5 million MKD. The value of capital expenditure was somewhat lower in the Southwest Region with 528.6 million MKD, followed by 390.4 million MKD in the Polog Region, and 382.34 million MKD in the Vardar Region, while the lowest value was recorded in the Northeast Region with only 301.9 million MKD. There was a noticeable difference between the size of capital investments between the Skopje Region and all remaining regions in North Macedonia.
The capital expenditure in Skopje region represents 50% of the total capex, i.e. all the remaining regions invest together as does the Skopje region. This confirms the severe discrepancy between the public investments in the capital and the other regions.
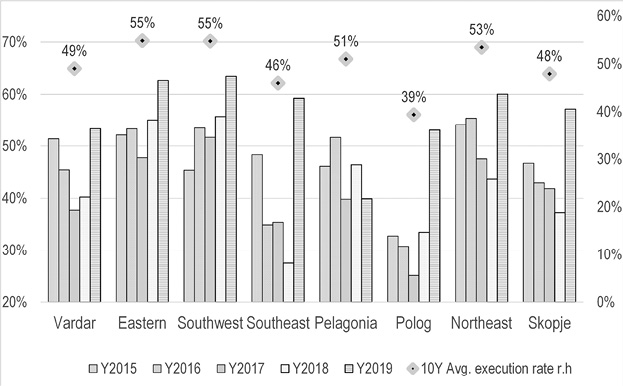
Fig. 6. Capital budget outturn in percentage per region (based on the cumulative municipal budgets))
Source: own work based on data of the State Budget of the Republic of Macedonia 2009–2019.
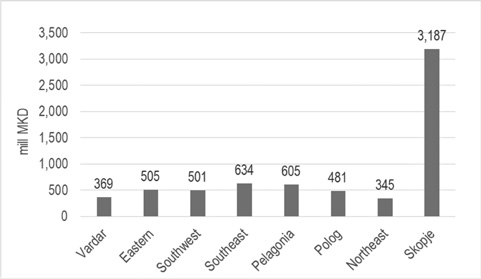
Fig. 7. 10-year absolute value average of capital expenditure per planning region (in million MKD))
Source: own work based on data of the State Budget of the Republic of Macedonia 2010–2019.
According to a local budgets’ economic classification, the public capital expenditures are sub-categorised as: 1) purchase of equipment and machinery; 2) construction of buildings; 3) other construction buildings; 4) purchase of furniture; 5) strategic goods and reserves; 6) non-financial assets investments; 7) purchase of vehicles; and 8) capital transfer subsidies to PUC and NGOs.
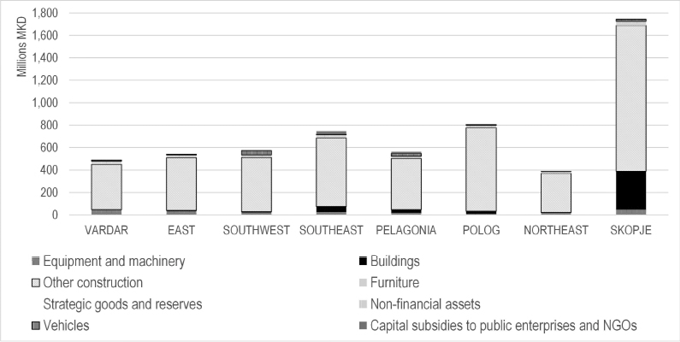
Fig. 8. Capital expenditure structure in 2019 per region and subcategory)
Source: own work based on data of the State Budget of the Republic of North Macedonia 2019.
The predominant sub-category is Other constructions (Fig. 7), with investment value of 5.6 billion MKD in 2019, (or 76% of total capital expenditure), which was seven times higher than the next capital expenditure sub-category – Construction of buildings, with a value of 0.76 billion MKD in 2019.
The Other construction sub-category covered a wide variety of capital expenditures, including road infrastructure, building bridges, water systems and infrastructure, waste infrastructure, sewerage systems, communication infrastructure, monuments, energy infrastructure, and other items (Fig. 8). The road infrastructure expenditure covered the design, construction and reconstruction of streets and roads and was by far higher when compared to other public infrastructure expenditure. On average, in the last five years (2015–2019), road expenditure increased by 30%, amounting to 3 billion MKD (~49 million EUR). Relative to other expenses, the second highest sub-category was expenditure associated with ‘Other buildings’, an all-inclusive and a wide category of general constructions (such as squares, maintenance of side road infrastructure, other urban equipment, etc.)
Further examination of the ‘Other constructions’ sub-category at the regional level indicates that road infrastructure expenses and other construction subcategory expenses were mainly centred in the Skopje Region and the City of Skopje as a separate local self-government unit. The highest road infrastructure expenditure in 2019 (as was the case in the previous years) was recorded in the City of Skopje, amounting to 386 million MKD or 6.3 million EUR, and the lowest infrastructure expenditure was in the Northeast Region, with 163.8 million MKD or 2.66 million EUR. However, when considered per capita in MKD, the lowest per capita expenditure was again among the least developed regions (measured as GDP per capita) (Fig. 10).
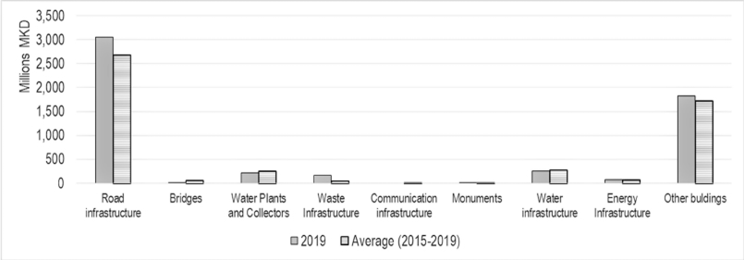
Fig. 9. Composition of sub-category Other constructions)
Source: own work based on data of the State Budgets of the Republic of Macedonia 2013–2019.
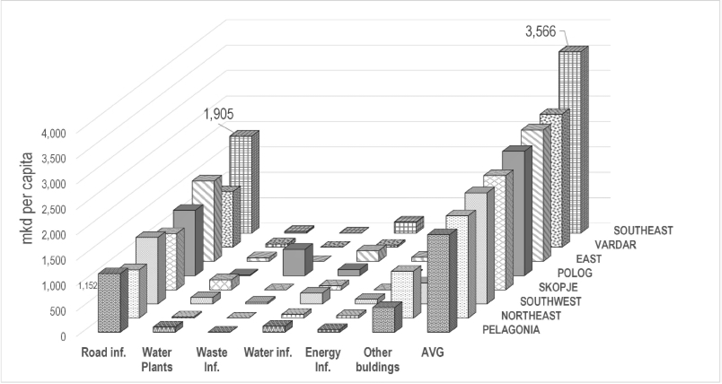
Fig. 10. Other construction expenditure in 2019 per region per capita (in MKD))
Source: own work based on data of the State Budget of the Republic of Macedonia 2019.
Since there is no one method for measuring the infrastructural gap, although as a term it is used as the difference between the estimated requirement needs and the actual level of investments, the consensus is that it is possible to achieve only approximations. We made an attempt to identify the gap as the difference between the needs based on local strategic documents of the municipalities; however, due to a lack of projected financial data it was excluded. Thus, in this text, we refer to the infrastructure gap as a mismatch, estimated as a difference between the planned capital expenditure and executed capital expenditure, under the assumption that the planned expenditures are based on previous analyses and strategic planning reflecting the needs and priorities of a wide spectrum of stakeholders.
The total cumulative financial difference between the planned and executed capital expenditure for all municipalities in 2019 in North Macedonia was 5.2 billion MKD (or 84.6 million EUR) (Fig. 11) which amounted to an average 58.2% of annually planned capital expenditure. As per the eight separate statistical planning regions’ municipalities, the difference between planned and actual expenditure in its absolute value was the highest in the Skopje Region, followed by the Polog Region, etc.
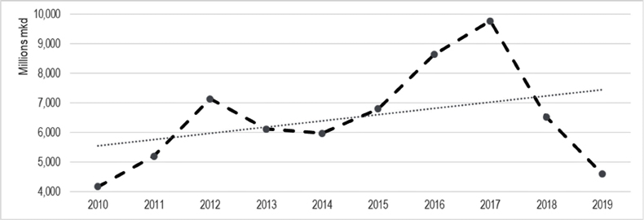
Fig. 11. Total value of under-executed capital budget (cumulative of all municipalities)
Source: own work, based on data of the State Budget of the Republic of Macedonia 2010–2019.
In relative terms, as a percentage of the total planned capital expenditure in 2019, the execution rate was the highest among the municipalities in the Southwest Region with 63.5%, followed by the East Region with 63%, Northeast with 60%, and the lowest in the Pelagonia Region with 40%.
The difference between planned and actual capital expenditure for all municipalities in all eight statistical planning regions in North Macedonia for 2019 was 84.6 million EUR and 121.3 million EUR in 2018. Theory suggests that public investments have positive effects on the economic output, thus if the difference covered that is expected to lead to an increase in the GDP and support the economic growth in North Macedonia, and that was what actually happened. In the following simulations, we project the effect on the total government debt-to-GDP ratio in the case when this difference is ‘closed’ and financed by external debt.
The baseline scenario presents the status quo, i.e., historical data and estimates of future planned capital expenditure and the total debt-to-GDP ratio, based on historical data and the budget plan. Scenario 1 illustrates the effect on the total debt-to-GDP ratio when the identified annual infrastructure mismatch is fully financed by foreign debt (ceteris paribus) in 2020 and Scenario 2 illustrates the potential effect on the total debt-to-GDP when the identified annual infrastructure gap is executed and the same level is maintained/continued for the following years.
The results of the simulations (ceteris paribus) show that under the baseline scenario where all the capital expenditures are executed as planned (all other assumptions are unchanged), the total government debt-to-GDP rises to 51.5% and then it starts to reduce. In Scenario 1, it reaches 52.7% as the assumption is that it will be fully financed by debt and thus the financing needs will increase followed by a slower pace reduction, compared to the baseline scenario, and in Scenario 2 it reaches its peak in 2022 with 53.8% after which it starts to reduce.
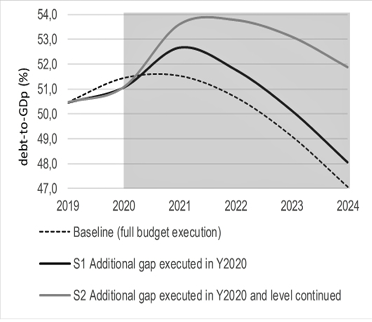
Fig. 12. Government debt-to-GDP per different scenarios
Source: own work calculations as per the Macroabc Model.
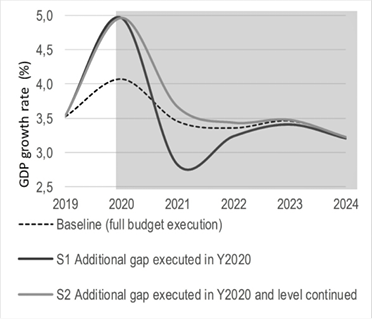
Fig. 13. GDP growth rate per the different scenarios
Source: own work calculations as per the Macroabc Model.
Despite the total debt increase in absolute terms, in relative terms (as percentage of GDP), debt deceases to levels below the levels below those when initiated. Thus, it is likely due to the economic impulse provided by increased public investments, consumption, and economic activity increase in the short run while in the longer run it contributes to enhanced productivity and higher economic output. Accordingly in the short-term, the full execution of planned capital expenditures is associated with an increase in the GDP growth rate of 0.9 p.p. under Scenarios 1 and 2 in the first year of investments. In the medium term, over the following five years, under the baseline scenario, the average annual GDP growth rate of approximately 3.5% is expected. Given that the GDP growth rate in the following five years is almost equal to that in the baseline and Scenario 1, in Scenario 2 there is an average growth of 0.25 pp per annum.
Regional development instruments used across the counties vary and their impact has not been necessarily uniform, thus it is challenging to isolate the impact of specific instruments, as balanced regional development is a complex entanglement of activities. Mutually fiscal policy, monetary policy, and public expenditures have been the norm for attaining balanced regional development.
Nonetheless, fiscal policies have traditionally focused on attracting private investments as well as investments in the public goods. In developing and emerging markets, public investments have been predominantly infrastructure investments. In the case of North Macedonia, the imbalance of regional development is significant and the gap does not narrow, as is typical in trends. One of the specifically designed programs for balanced regional development, which has been implemented for over a decade, has not been executed with the intended magnitude, as out of the intended 1% of the annual GDP, the actual size amounted to a maximum of 0.06% in 2019. Theory suggests that covering the infrastructure gap can lead to significant improvements in economic growth. Nevertheless, North Macedonia’s public finances show significant under-execution of the planned public capital investments, both centrally and at the local level, in addition to the regular capital budget cuts.
The average capital expenditure execution rate at the planning region level (based on the municipal budgets) is low and in 2019 amounted to 58% (significantly lower than the state budget utilisation rate of 78% in the same year). Compared to ten years ago (2009), the rate increased by 5 pp reflecting some of the governmental efforts to increase public capital investments. Regionally, the utilisation rate of capital expenditure is in addition lower among the least developed regions compared to the more developed regions. Thus, the economic development divergence between the regions in North Macedonia, coupled with the lowest per capita investments in the least developed regions, further contribute to widening the gap of unbalanced regional development. The Skopje planning region, as the most developed among the eight regions, has manifold higher capital investments compared to the remaining regions.
The structure of the municipal capital budgets indicates investments predominantly in local roads and road maintenance infrastructure, followed by an all-inclusive subcategory ‘Other buildings’ without specific details on its composition. The largest road infrastructure expenditure in 2019 (as was the case in the past years) was in the City of Skopje, amounting to 386 million MKD or 6.3 million EUR, and the lowest infrastructure expenditure absolute value in the Northeast Region was 163.8 million MKD or 2.66 million EUR. Presented on a per capita level, the lowest expenditure was hitherto again among the least developed regions.
The difference between the plan and outturn of the capital expenditure budget for 2019 was cumulatively near 85 million EUR. The statistical planning region with the highest ‘gap’ or mismatch is the least developed region with low utilisation rate, demonstrating further the serious deficiency in annual planning, fortified by a lack of multi-annual budget planning framework neither at central nor local level, then the absorption capacities of institutions, the lack of fully-developed programs, the shortage of performance assessments, and other structural bottlenecks.
Loans are an underutilised funding source for capital investments, nonetheless under the current fiscal capacities and the limitations of the lower tier governance it is not a likely viable option for most of the municipalities. Under our hypothetical scenario exercise we suggest that with full utilisation of the budgeted public capital investments, i.e. by closing at least this gap even if fully covered with foreign debt funding, all else equal, the debt-to-GDP will in the long-run decrease in relative terms (as a percentage of GDP) by dint of expected contribution onto the economic productivity, output, and consequently the prospect to decrease the level of debt. Furthermore, with such a scenario, it might be expected that the GDP growth rate will gain an immediate impulse by additional 0.9 pp, followed by approx. 0.2 pp in subsequent years.
This conclusion is in line with theory and the empirical findings that public investments positively contribute to economic performance and ultimately may contribute to the convergence of the regions’ economic development.
ATOYAN, R., BENEDEK, D., CABEZON, E., CIPOLLONE, G., MINIANE, J., NGUYEN, N., PETRI, M., REINKE, J. and ROAF, J. (2018), Public Infrastructure in the Western Balkans: Shifting Gears—Opportunities and Challenges, Washington, D.C.: International Monetary Fund.
EHLERS, T. (2014), ‘Understanding the Challenges for Infrastructure Finance’, Working Paper, 454, Bank for International Settlements BIS.
ESTACHE, A. (2007), ‘Infrastructure and Development: A Survey of Recent and Upcoming Issues’, Washington, D.C.: Global Annual World Bank Conference on Development Economics 2007, The World Bank.
ESTACHE, A. and SINHA, S. (1995), ‘Does Decentralization Increase Spending on Public Infrastructure?’ Policy Research Working Paper, 1457, The World Bank.
EUROPEAN COMMISSION (2018), Communication from the Commission to the European Parliament, the Council, the European Economic and Social Committee and the committee of the regions, ‘A credible enlargement perspective for and enhanced EU engagement with the Western Balkans’, COM(2018) 65 final.
FISHER, R. C. and SULLIVAN, R. (2016), ‘Why is State and Local Government Capital Spending Lower in the New England States than in Other U.S. States?’, Policy Reports Paper, 16 (1), New England Public Policy Centre.
GOVERNMENT OF THE REPUBLIC OF NORTH MACEDONIA (2017), Program of the Government 2017–2020.
HOLZNER, M. (2016), ‘Policy options for competitiveness and economic development in the Western Balkans: The case for infrastructure investment’, Studies, Policy Notes and Reports, 16, Vienna: Vienna Institute for International Economic Studies.
HOLZNER, M. and SCHWARZHAPPEL, M. (2018), Infrastructure Investment in the Western Balkans: A First Analysis, Vienna: Vienna Institute for International Economic Studies and the European Investment Bank.
HOLZNER, M., STEHRER, R. and VIDOVIC, H. (2015), Infrastructure investment in the Western Balkans, Vienna: Vienna Institute for International Economic Studies.
HURLEY, J., MORRIS, S. and PORTELANCE, G. (2018), ‘Examining the Debt Implications of the Belt and Road Initiative from a Policy Perspective’, CGD Policy Paper, 121, Washington D.C.: Center for Global Development.
INTERNATIONAL MONETARY FUND (2014), ‘Is it Time for an Infrastructure Push? The Macroeconomic Effects of Public Investment’, International Monetary Fund, World Economic Outlook: Legacies, Clouds, Uncertainties, Chapter 3, pp. 75–114. https://doi.org/10.5089/9781484372265.081
INTERNATIONAL MONETARY FUND (2016a), ‘Former Yugoslav Republic of Macedonia – Selected issues, Country Report, 19/32, International Monetary Fund. https://doi.org/10.5089/9781475554861.002
INTERNATIONAL MONETARY FUND (2016b), ‘Former Yugoslav Republic of Macedonia – Selected issues’, IMF Country Report, 16/357. https://doi.org/10.5089/9781475554861.002
NIKOLOV, M. (2017), Determinants for influence of the civil society organisations in policy creation for balanced regional development, Open Society Foundation.
OECD (2015), Infrastructure financing instruments and incentives, OECD Publishing.
OFFICIAL GAZETTE OF REPUBLIC OF NORTH MACEDONIA (2007), 63/2007, Law on balanced regional development.
PEREIRA, M. A. and ANDRAZ, M. J. (2013), ‘On the economic effects of public infrastructure investment: A survey of the international evidence’, Working Paper, 108, College of William and Mary Department of Economics.
THE WESTERN BALKAN INVESTMENT NETWORK (2018), Connectivity Agenda – Co-financing of investment projects in the Western Balkans, European Commission.