

Abstract. The world is facing a series of changes that will modify the way we envisage transport planning in our cities. Demographic ageing as a consequence of higher life expectancy and lower fertility rates is a world-wide phenomenon. While ageing is indeed a triumph of scientific progress and increasing longevity is perceived as one of humanity’s greatest achievements, the transition in society needs to be managed. In the urban context, any increase in age, health, and economic conditions determines one’s ability to enjoy the urban milieu and the so-called economies of urbanisation (advantages gained from an urban location, e.g., proximity to a market, labour supply, good communications, and financial and commercial services) longer. As there are more and more elderly people in cities, urban mobility becomes crucial in making the urban environment more inclusive. In order to provide suitable policy guidelines, it is, therefore, necessary to investigate and understand senior traveller behaviour.
In this study, we investigate urban travel characteristics of people aged 65 years and over living in the city of Genoa (one of the cities with the largest population of the elderly in the EU). By utilising a structured questionnaire, the paper explores the satisfaction and motivations of approx. 600 elderly public transport users in the city. In particular, exploratory factor analysis has been used to determine the key dimensions of the satisfaction and mobility motivations, and subsequently to use them to investigate the cost sensitivity of elderly people.
Key words: the elderly, urban mobility, cost sensitivity of elderly people.
Life expectancy at birth has reached 80 years in over 30 countries. While at present only Japan has an elderly population accounting for more than 30% of its population, by 2050 64 countries are expected to join Japan.[1] (UN, 2013). The ageing process is most advanced in high-income countries. Japan (33% were aged 60 years and over in 2015) is followed by Italy and Germany (28% aged 60 years and over), and Finland (27%) (UN, 2015).
The number of elderly people in the world is projected to grow by 56%, from 0.9 billion to 1.4 billion between 2015 and 2030 (Szeto et al., 2017). The demographic shift, as a consequence of higher life expectancy and lower fertility rates, is occurring worldwide, and particularly in developed economies (Oeppen and Vaypel, 2002; Bricocoli et al., 2018).
A rise in age, health, and economic conditions increases the opportunities to enjoy what the urban environment and the milieu have to offer (Alsnih and Hensher, 2003; Banister and Bowling, 2004; Lutz et al., 2008; Coughlin, 2009; Rosenbloom, 2009; Dobbs et al., 2016). However, that use is bound (or limited) by the accessibility to places or services. Urban mobility planning becomes a vital tool towards a more friendly and inclusive urban environment (Banister and Bowling, 2004; Beria et al., 2012; van den Berg et al., 2016).
Today’s elderly significantly differ from previous generations: they are wealthier, healthier, and more mobile, as well as more numerous than in the past as a consequence of the generation of baby boomers reaching old age (Rosenbloom, 2001; Currie and Delbosc, 2010). This is the first time that such a change has taken place between two generations (Lutz et al., 2008; Lanzieri, 2011; Szeto et al., 2017; Mariotti et al., 2018).
While today’s elderly live longer than any generation before them, they are not necessarily happy to retire at 65 and count the days until they enter a nursing home. Life after retirement has been growing over the years (Fig. 1) and this causes a longer period of activity and opportunities for current generations compared to the previous ones. On average, in 2020 the life expectancy at birth was 74 years for women and about 70 years for men; however, the valuesare forecast to increase. The same projected growth is observed for life expectancy after age 65 which now stands at 17 years and is expected to rise to 19 years by 2050; that is a considerable time that is worth living well (OECD, 2019).
As Hjorthol et al. (2010) have indicated for for Northern Europe, car ownership and use by the elderly has been increasing over the last 20 years, with a higher trip rate and more activities outside the home compared to the same age groups of 20–25 years ago.
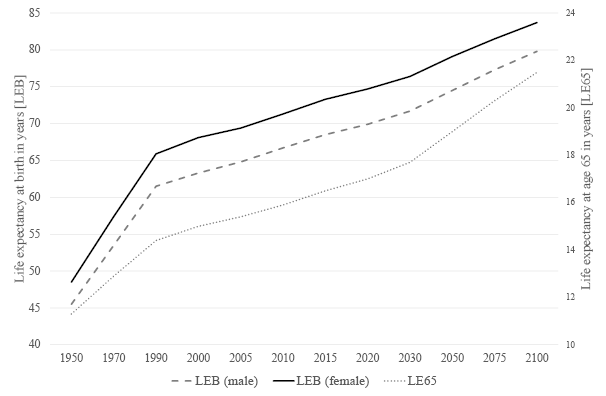
Fig. 1. Life expectancy at birth (male vs female) and life expectancy at age 65 from 1950 to 2100
Source: UN, Department of Economic and Social Affairs, Population Division. World Population Prospects 2019, Volume II: demographic profiles.
A longer post-retirement life, along with better health and economic conditions, generate the desire and opportunities for mobility, whose link to the quality of life has been widely acknowledged in literature (Metz, 2000; Banister and Bowling, 2004; Preston and Rajé, 2007; Nordbakke, 2013; Nordbakke and Schwanen, 2014; Ryan et al., 2015). It has become necessary to re-think urban transport options to match the needs of an ageing population while maintaining their well-being and quality of life. This is a complex task requiring in depth studies of senior travel patterns and mobility needs in order to implement successful planning strategies. To provide suitable polices it is necessary to first investigate travel behaviours and the needs of elderly people.
Within this context, our analysis aims at studying travel behaviour of elderly people, through an exploratory factor analysis performed in order to evaluate the key dimensions of satisfaction and mobility motivations, and investigate the cost sensitivity of elderly people.
The survey applied to Genoa. Why is one Italian city such an interesting scenario to investigate the connection between ageing and urban mobility planning? Statistics are a useful tool to answer this question (Burlando and Cusano, 2018).
Italy is one of the countries with the longest life expectancy: almost 81 years for men and 85 for women. While facing a decrease in the birth rate, the country also shows a significant demographic imbalance. With 170 elderly people for every 100 young people, Italy is the second oldest country after Japan (ISTAT, 2018), with 20-year forecasts estimating an even greater imbalance: 265 elderly people for every 100 young people (ISTAT, 2018).
Eurostat figures (2018) have revealed that Italy has the highest number of people aged 65 and more in Europe, accounting for 22.3% of the population (followed by Greece at 21.5%, and Germany at 21.2%) and the worst elderly dependency index at 34.8% (in comparison to the EU average of 29.9%).
The average life span of Italians (around 85 years for women and 81 years for men: ISTAT, 2018) tops the EU ranking. After retirement, a 65-year-old men can expect to live another 19.1 years, while women may live up to a further 22.3 years on average (ISTAT, 2016).
Among all urban areas with populations exceeding 250,000 in the EU Member State with the oldest population (according to ISTAT data), Genoa has the highest share of people aged 65 and more (28.6%), the worst elderly dependency index (47.5%), and the highest average age in Italy (48.9). Genoa as the oldest city in the country with the oldest population in the EU is an obvious candidate for a case study.
Therefore, it seems crucial to ensure that within the ageing process quality of life is ensured at a certain level. Sadly, these aspects appear to be underestimated in Italy by the academia, urban transport planners and practitioners, as well as in policymakers’ agendas. This great demographic change demands significant strategic (Buffel et al., 2012; van den Berg et al., 2016) given the effects of ageing on the environment, on mobility patterns (Rosenbloom, 2001), and on transport systems (Alsnih and Hensher, 2003; Buehler and Nobis, 2010; Van den Berg et al., 2016).
Italy has one of the oldest populations in the EU, while the population of Liguria and its capital Genoa are the oldest in Italy. Located in the historically industrialised North West of Italy, with a population of 580,000 and 240 sq. km, Genoa displays one of the worst demographic trends in Europe: 28% of its inhabitants are aged over 65, the old-age index (the ratio of people over 65 to people under the age of 14) exceeds 250% and the average age is over 48. We consider the city as a significant possible example and believe that the findings and their discussion can be “food for thought” for policymakers and researchers working on urban transport planning in the context of ageing.
The empirical research was based on the development of a structured questionnaire based on personal interviews of a sample of approx. 605 elderly public transport users (over 65 years of age) from the city of Genoa. The sample was proportionally stratified on the basis of gender and age of respondents. The random sample was interviewed following the CAPI (computer assisted personal interviewing) method.
In particular, the sample was divided into 4 different age groups: 65–70, 71–75, 76–80, and over 80; the need for a proper age segmentation has been confirmed by several studies that disaggregated the “elderly” category into different sub-categories with very specific needs (Alsnih and Hensher, 2003; Currie and Delbosc, 2010; Mandl, 2013; Coughlin, 2009; Haustein, 2012; Kim and Ulfarsson, 2004; Siren and Haustein, 2013).
| SEX | sample [%] | population [%] | AGE | sample [%] | population [%] | |
|---|---|---|---|---|---|---|
| Male | 42 | 44 | 65–69 | 21 | 23 | |
| Female | 58 | 56 | 70–74 | 24 | 24 | |
| 75–79 | 26 | 21 | ||||
| > 80 | 29 | 32 |
After the data has been cleaned, the sample is adequately balanced with respect to the stratification variables. In particular (Table 1), the sample comprised for the most part women (58%), the average age being 75, with a significant share of people over 80 (approx. 30%). Most interviewees (64%) still held a driving license, while 16% no longer held one. The number of driving license holders remained high (40%) even among the over 80 bracket.
The questionnaire consisted of three sections: the first section included biographical information of the respondents (sex, age, employment status, and qualification); the second one investigated their urban mobility habits (daily number of movements, frequency of movements, means of transportation, etc.); the last section evaluated the satisfaction regarding local public transport and the motivation to use it. This section includes questions concerning user opinions on the quality of public transport, pedestrian mobility, and the use of urban roads in general. These questions were organised as sets of ten-point scales comprising 18 items divided into two sections: satisfaction about public transport (related to elements such as frequency, punctuality, information, security, and comfort), and about road and sidewalk conditions (related to maintenance, cleaning, lighting, and security).
Data analyses were performed in two steps. First, an exploratory factor analysis (EFA) was performed on the 18 items included in the last part of the questionnaire in order to better understand the multivariate structure of the satisfaction measures (Table 2).
| Explained variance [%] | Cronbachʼs alpha | Factor loadings | Mean | SD | |
|---|---|---|---|---|---|
| Factor 1. Pedestrian Mobility (PMOB) | 41.86 | 0.854 | |||
| Sidewalk condition | 0.678 | 3.891 | 0.088 | ||
| Street maintenance and cleaning | 0.722 | 3.988 | 0.089 | ||
| Crosswalk | 0.644 | 5.992 | 0.085 | ||
| Street lighting | 0.642 | 6.104 | 0.081 | ||
| Urban security | 0.663 | 5.787 | 0.078 | ||
| Condition of stairs | 0.582 | 4.779 | 0.080 | ||
| Factor 2. Time factor (TIME) | 12.02 | 0.867 | |||
| Travel time | 0.505 | 5.860 | 0.073 | ||
| Waiting time at bus stop | 0.795 | 5.202 | 0.083 | ||
| Frequency | 0.782 | 5.198 | 0.080 | ||
| Punctuality | 0.642 | 5.949 | 0.083 | ||
| Factor 3. Security perception (SECU) | 6.05 | 0.818 | |||
| Information on board | 0.541 | 5.555 | 0.101 | ||
| Information at bus stop | 0.501 | 6.159 | 0.092 | ||
| Security at the bus stop | 0.617 | 6.365 | 0.078 | ||
| Security on board | 0.565 | 5.874 | 0.081 | ||
| Courtesy of the driving staff | 0.575 | 6.617 | 0.088 | ||
| Factor 4. Overall comfort (COMF) | 5.33 | 0.834 | |||
| Comfort at the bus stops | 0.627 | 5.316 | 0.083 | ||
| Comfort on board | 0.696 | 5.008 | 0.084 | ||
| Ease of entry/exit | 0.573 | 5.050 | 0.088 |
The factors were extracted using the principal component method. The total number of factors (4) was defined using the Keiser criterion. Thus, we guaranteed the percentage of cumulative explained variance greater than 65%. To measure the appropriateness of the factor analysis, we have calculated Bartlett’s sphericity test (p-value < 0.001) and the Keiser Meyer Olkin index (KMO = 0.9143) and we have concluded that correlations in the dataset exist and are appropriate for the factor analysis, and sampling adequacy is good. In order to simplify the factor structure and make its interpretation more reliable, we performed a varimax rotation. To check the reliability of each factor, we finally calculated the Cronbach’s alpha among items, for each extracted factor.
As reported in Table 2, Factor 1 (PMOB) included six items (i.e., sidewalk conditions, street maintenance and cleaning, pedestrian crossings, road lighting, urban security, and the condition of stairs). The internal consistency was good as Cronbach’s Alpha for this factor was 0.854. This factor explains 41.86% of the total variance and, due to its inner composition, was called pedestrian mobility.
Factor 2 (TIME) explained 12.02% of the total variance and loaded all items related to punctuality and frequency of local transport (travel time, waiting time at the bus stop, bus frequency, and punctuality). The internal consistency was also good (Cronbach’s Alpha = 0.867).
Factor 3 (SECU) included all items connected to passenger perception of security and peace of mind (information on board and at the bus stop, security on board and at the bus stop, and courtesy of on-board personnel). It explained 6.05% of the overall variance and had a good internal consistency.
Finally, factor 4 (COMF) included all items connected to the ease and comfort of travel (comfort at the bus stop, comfort on board, and ease of entry/exit) explaining 5.33% of variance.
After Exploratory Factor Analysis (EFA), the four factors extracted were used to investigate the determinant of cost sensitivity of elderly people. Thus, a regression model was performed to test the impact of the four factors (PMOB, TIME, SECU, COMF) on cost sensitivity (CSEN). The dependent variable was obtained from a specific question in the second part of the questionnaire which asked respondents to evaluate the importance of the cost of public transport (on a four-point scale ranging from 1 to 4). Being the dependent variable an ordinal variable, a proportional odds model (ordered logistic regression) was used instead of ordinary least square regression.
In addition, seven control variables were included in the regression analysis as extant literature identified them as relevant drivers for cost sensitivity (Hunt, 2001; Paulley et al., 2006; Craig and Tienoven, 2019). Most of them were related to biographical characteristics (Meyer and Speare, 1985; Rosenbloom, 2004; Scheiner and Holz-Rau, 2012; Chao, 2019): SEX, AGE, QUAL (qualification), DLIC (driving license), EMPL (employment), WMOV (work-motivated movement), FMOV (family-motivated movement), and CARR (car usage reduction). All variables were operationalised as reported in Table 3.
| Code | Variable | Operationalisation |
|---|---|---|
| Dependent variable | ||
| CSEN | Cost sensitivity | four-point scale from 1 to 4 |
| Independent variables (Satisfaction factors extracted from EFA) | ||
| PMOB | Pedestrian mobility | The operationalisation of the four independent variables were based on factor analysis (FA) outcomes. Each variable was calculated as a mean of all the items included in the corresponding factor |
| TIME | Time factor | |
| SECU | Security and self-confidence | |
| COMF | Comfort factor | |
| Control variables | ||
| SEX | Sex of respondent | Dummy variable: 1 male; 0 female |
| AGE | Age of respondent | Integer number >= 65 |
| QUAL | Qualification of respondent | Dummy variable: 1 if a respondent had a Bachelor’s degree or higher; 0 otherwise |
| DLIC | Driving licence | Dummy variable: 1 if a respondent did not have a driving licence; 0 otherwise |
| EMPLO | Employment | Dummy variable: 1 if employed; 0 otherwise |
| WMOV | Work-motivated movement | Number of weekly movements due to working motivations on the total movements of the week |
| FMOV | Family-motivated movement | Number of weekly movements due to family motivations on the total movements of the week |
| CARR | Car usage reduction | Dummy variable: 1 if a respondent had the intention to reduce car usage; 0 otherwise |
The results of the ordered logistic regression model, reported in Table 4, show an overall high significance of the model (LR Chi-squared = 52.38, dof = 12, p-value < 0.001).
The results of the regression (Table 4) show that two of the four components extracted with EFA, pedestrian mobility (PMOB) and Security and self-confidence (COMF), present a significant impact on cost sensitivity of elderly people. Both affect cost sensitivity negatively. Moreover, three other variables seem to affect cost sensitivity: two of these negatively (SEX and AGE) and the third positively (CARR). However, the other seven variables do not seem to be significant. To check the robustness of the results, we compared the Full model results (regression model which considers all the variables previously introduced) with the model obtained by selecting variables with a stepwise criterion. After a stepwise selection, the resulting model is preferable in terms of AIC (Akaike Information Criterion): the significance and sign of all variables are confirmed; in addition, another variable is now significant and negatively signed (QUAL).
| Full Model | Stepwise regression model | ||||||||
|---|---|---|---|---|---|---|---|---|---|
| Estimate | SE | z-value | Estimate | SE | z-value | ||||
| PMOB | - 0.2124 | 0.0878 | - 2.420 | ** | - 0.2289 | 0.0866 | - 2.640 | *** | |
| TIME | 0.0415 | 0.0907 | 0.460 | ||||||
| SECU | - 0.0702 | 0.0969 | - 0.720 | ||||||
| COMF | - 0.1935 | 0.0998 | - 1.940 | * | - 0.2002 | 0.0983 | - 2.040 | ** | |
| SEX | - 0.3201 | 0.1629 | - 1.970 | ** | - 0.3658 | 0.1550 | - 2.360 | ** | |
| AGE | - 0.0257 | 0.0121 | - 2.120 | ** | - 0.0271 | 0.0118 | - 2.290 | ** | |
| QUAL | - 0.2894 | 0.1700 | - 1.700 | - 0.3247 | 0.1621 | - 2.000 | ** | ||
| DLIC | 0.3010 | 0.2098 | 1.430 | ||||||
| EMPLO | 0.1895 | 0.3443 | 0.550 | ||||||
| WMOV | - 0.0038 | 0.0125 | - 0.310 | ||||||
| FMOV | 0.0133 | 0.0088 | 1.510 | ||||||
| CARR | 0.5654 | 0.1655 | 3.420 | *** | 0.5559 | 0.1646 | 3.380 | *** | |
| cut1 | - 3.5776 | 0.9713 | - 3.9446 | 0.9199 | |||||
| cut2 | - 1.6820 | 0.9613 | - 2.0790 | 0.9081 | |||||
| cut3 | 0.4808 | 0.9626 | 0.0626 | 0.9081 | |||||
| AIC | 762.79 | 753.27 | |||||||
| p-values codes: *p < 0.10; **p < 0.05; ***p < 0.01 | |||||||||
The data provided in the previous sections highlights some interesting results, namely concerning the importance attributed to the out-of-pocket cost compared to other factors influencing travel demand patterns and their variability.
As far as demographics are concerned, the most interesting evidence appears to be related to the age and gender of respondents. From the first point of view, it emerges that as user age increases, the importance ascribed to the monetary cost decreases. This is certainly due to fewer trips being made (from about 4 trips per day on average in the 65–70 class to 3 trips per day for those aged 80 and more) and probably to the higher share of pedestrian trips and journeys as car passengers, both resulting from available data.
Then the importance assigned to the monetary cost seems to be smaller for men than women. This is probably (at least partly) due to a higher average level of income and wealth of the former compared to the latter. In Italy, the average amount of net workplace pensions for women amounts to only 60.5% of those for men (see ISTAT, 2019). Furthermore, the sample includes some professionally active people, who more often were men (6.4%) than women (1.6%) (see OECD, 2017) – whose price-flexibility of travel demand is lower than for journeys for leisure and family organisation.
Moreover, a higher level of education of users is normally associated with less importance assigned to the monetary cost of trips. This factor is possibly responsible for the direct link between the importance ascribed to the cost and the intention to reduce the use of private transport, which may be due to a greater awareness of the issues related to transport sustainability, which in turn could be the consequence of a higher level of education. However, such a link appears to be far more complex and requires further research.
Finally, and possibly connected to previous elements, it appears that the higher a respondent’s evaluation on the quality of pedestrian mobility, the lesser the importance attributed to the monetary cost of trips. It follows that the higher evaluation of pedestrian mobility, the more trips are made on foot and the less importance given to the cost of public transport.
Predictably, a positive assessment of the level of comfort in public transport does result in less importance given to its monetary cost, as indicated by, e.g., Smith, 1988; Hebel and Wyszomirski, 2018; and Ingvardson and Nielsen, 2019. Conversely, the level of comfort which is judged inadequate will cause greater attention to the out-of-pocket cost, as this will be more likely to be considered unacceptably high by the users.
From the point of view of possible policy guidelines – albeit the evidence of this survey should be confirmed and strengthened by ad hoc analysis – it is worthwhile indicating that some “natural” trends push towards the reduced importance of the monetary cost as a factor influencing how the elderly travel. This is the case of ageing itself, not only as the natural individual process, but also an increase in the average age of population, both overall and (what is more relevant here) in the segment of elderly people. The growing activity rate of an older population is also significant, not only as far as jobs are concerned, but also in other lifestyle domains that imply a more active and dynamic use of time. These aspects are revealed, also in our survey, by the lower importance assigned by male users to the monetary cost of transport.
Similarly, an overall higher cultural level, be it the outcome of an autonomous societal trend or of policies not directly related to transportation, and – even more specifically – a growing awareness amongst people of issues related to environmental sustainability, push towards reduced importance given to the out-of-pocket component compared to the overall (direct and external) cost.
In this context, most policy guidelines should consider this trend by easing the aspects of comfort improvement rather than by targeting merely the speed and/or the cost-effectiveness of transport. Regarding urban public transport, this should push the search for solutions involving modes, vehicles and service organisation that give priority to comfort rather than other aspects of efficiency and effectiveness (of course, this should under no circumstances justify any possible waste of resources). As regards private transportation, special effort should be made through policies that enhance and promote pedestrian mobility, particularly through specific attention to the pleasure and safety of walking (pedestrian areas, management of crossroads/junctions, covered walkways, and street furniture), and through a greater attention to urban design and land use, so that average distances from origin to destination are eventually reduced to ranges suitable for elderly people. Furthermore, in the long term, the benefits arising from such policies would positively affect not only the costs of urban mobility but also those related to healthcare.
A possible interesting future research area concerns the particular impact of Covid-19 on the urban mobility of the elderly. As stated by Basu and Ferreira (2021), COVID-19 has generated a fear of infection that leads to shunning mass transit. Consequently, there is a probable increased usage of alternative modes, particularly private cars, and older drivers, especially aged over 75, are suffering from increasing “navigational” problems particularly when travelling through unfamiliar areas (Burlando et al., 2021). In addition to the increase in car use, pandemic fears related to mass mobility are causing increases in the use of micro-mobility modes (Bergantino et al., 2021; Hosseinzadeh and Kluger, 2021). In both cases, the elderly population is likely to be marginalised by a model of travel that relies more on the use of cars or the use of new means of mobility that require greater technological expertise (sharing, apps, smartphones, etc.) or special physical skills (use of segways, kick scooters, electric bikes, etc.) This analysis, however, should be conducted when the post-pandemic phase has consolidated and mobility patterns have stabilised. It is clear that the pandemic has serious repercussions on the mobility of the elderly. Nonetheless, what is important is whether there will be an effective and lasting change in the pattern of movement of seniors once the fear linked to the virus is left behind. Lifestyle-related urban mobility has moments of disruption that are linked to particular changes in the lives of individuals (Van Acker et al., 2016). The pandemic has been an immensely significant event and it is necessary to understand whether it will determine a deep and stable change in mobility patterns. To do this it will be necessary to wait until the post-pandemic phase is also over.
ALSNIH, R. and HENSHER, D. A. (2003), ‘The mobility and accessibility expectations of seniors in an ageing population’, Transportation Research Part A, 37, pp. 903–916. https://doi.org/10.1016/S0965-8564(03)00073-9
BANISTER, D. and BOWLING, A. (2004), ‘Quality of life for the elderly: The transport dimension’, Transport Policy, 11 (2), pp. 105–115. https://doi.org/10.1016/S0967-070X(03)00052-0
BASU, R. and FERREIRA, J. (2021), ‘Sustainable mobility in auto-dominated Metro Boston: Challenges and opportunities post-COVID-19’, Transport Policy, 103, pp. 197–210. https://doi.org/10.1016/j.tranpol.2021.01.006
BERGANTINO, A. S., INTINI, M. and TANGARI, L. (2021), ‘Influencing factors for potential bike-sharing users: an empirical analysis during the COVID-19 pandemic’, Research in Transportation Economics, 86. https://doi.org/10.1016/j.retrec.2020.101028
BERIA, P., MALTESE, I. and MARIOTTI, I. (2012), ‘Multicriteria versus Cost Benefit Analysis: A comparative perspective in the assessment of sustainable mobility’, European Transport Research Review, 4, pp. 137–152. https://doi.org/10.1007/s12544-012-0074-9
BRICOCOLI, M., BROUWER, A. E. and GARGIULO, C. (2018), ‘Editorial Preface’, TeMA Journal of land use, mobility and environment, Special Issue, 2, pp. 3–8.
BUEHLER, R. and NOBIS, C. (2010), ‘Travel Behavior in Ageing Societies: A Comparison of Germany and the United States’, Transportation Research Record: Journal of the Transportation Research Board, 2182 (1), pp. 62–70. https://doi.org/10.3141/2182-09
BUFFEL, T., PHILLIPSON, C. and SCHARF, T. (2012), ‘Ageing in urban environments: Developing age-friendly cities’, Critical Social Policy, 32 (4), pp. 597–617. https://doi.org/10.1177/0261018311430457
BURLANDO, C. and CUSANO, M. I. (2018), ‘Growing old and keeping mobile in Italy’, TeMA, Journal of Lend Use, Mobility and Environment, Special Issue, 2, pp. 43–52.
BURLANDO, C., IVALDI, E. and CIACCI, A. (2021), ‘Seniors’ Mobility and Perceptions in Different Urban Neighbourhoods: A Non-Aggregative Approach’, Sustainability, 13, 6647. https://doi.org/10.3390/su13126647
CHAO, Y., MENG, X., XUAN, D., WENWEN, T., YONG, Z., JIE, C., LEI, L. and XINYUE, Y. (2019), ‘Exploring human mobility patterns using geo-tagged social media data at the group level’, Journal of Spatial Science, 64 (2), pp. 221–238. https://doi.org/10.1080/14498596.2017.1421487
COUGHLIN, J. F. (2009), ‘Longevity, lifestyle, and anticipating the new demands of ageing on the transportation system’, Public Works Management & Policy, 13, pp. 301–311. https://doi.org/10.1177/1087724X09335609
CRAIG, L. and TIENOVEN, T. P. (2019), ‘Gender mobility and parental shares of daily travel with and for children: A cross-national time use comparison’, Journal of Transport Geography, 76, pp. 93–102. https://doi.org/10.1016/j.jtrangeo.2019.03.006
CURRIE, G. and DELBOSC, A. (2010), ‘Exploring public transport usage trends in an ageing population’, Transportation, 37, pp. 151–164. https://doi.org/10.1007/s11116-009-9224-x
DOBBS, R., MANYIKA, J., WOETZEL, J., REMES, J., PERRY, J., KELLY, G., PATTABIRAMAN, K. and SHARMAN, H. (2016), Urban World: The older consumer to watch, McKinsey Global Institute.
EUROSTAT (2018), ‘Population structure indicators, Record high old-age dependency ratio in the EU’, Eurostat News, DDN-20180508-1, May-2018.
HAUSTEIN, S. (2012), ‘Mobility behaviour of the elderly: an attitude-based segmentation approach for a heterogeneous target group’, Transportation, 39, pp. 1079–1103. https://doi.org/10.1007/s11116-011-9380-7
HEBEL, K. and WYSZOMIRSKI, O. (2018), ‘Transportation preferences and travel behaviour of senior citizens in Gdynia in the light of marketing research’, Transport Economics and Logistics, 76, pp. 167–177. https://doi.org/10.26881/etil.2018.76.14
HJORTHOL, R. J., LEVIN, A. L. and SIREN, A. (2010), ‘Mobility in different generations of older persons: The development of daily travel in different cohorts in Denmark, Norway and Sweden’, Journal of Transport Geography, 18, pp. 624–633. https://doi.org/10.1016/j.jtrangeo.2010.03.011
HOSSEINZADEH, A. and KLUGER, R. (2021), ‘Analyzing the Impact of COVID-19 Pandemic on Micromobility Transportation’, International Conference on Transportation and Development 2021, 8–10 June 2021. https://doi.org/10.1061/9780784483541.005
HUNT, J. D. (2001), ‘Stated Preference Analysis of Sensitivities to Elements of Transportation and Urban Form’, Transportation Research Record: Journal of the Transportation Research Board, 1780 (1), pp. 76–86. https://doi.org/10.3141/1780-09
INGVARDSON, J. B. and NIELSEN, O. A. (2019), ‘The relationship between norms, satisfaction and public transport use: A comparison across six European cities using structural equation modelling’, Transportation Research Part A: Policy and Practice, 126, pp. 37–57. https://doi.org/10.1016/j.tra.2019.05.016
ISTAT (2016), Rapporto annuale 2016.
ISTAT (2018), I.STAT- Popolazione – Indicatori demografici.
ISTAT (2018), Rapporto annuale 2018.
ISTAT (2019), Condizioni di vita dei pensionati – Anni 2016–2017.
KIM, S. and ULFARSSON, G. F. (2004), ‘Travel mode choice of the elderly: Effects of personal, household, neighbourhood and trip characteristics’, Transportation Research Record: Journal of the Transportation Research Board, 1894, pp. 117–126. https://doi.org/10.3141/1894-13
LANZIERI, G. (2011), ‘The greying of the baby boomers: A century long-view of ageing in European populations’, Eurostat statistics in focus, 23/2011.
LUTZ, W., SANDERSON, W. and SCHERBOV, S. (2008), ‘The coming acceleration of global ageing’, Nature, 451, pp. 716–719. https://doi.org/10.1038/nature06516
MANDL, B., MILLONIG, A. and FRIENDL, V. (2013), ‘The variety of the golden agers: identifying profiles of older people for mobility research’, Poster presented at the Transportation Research Board 92nd annual meeting, pp. 13–17.
MARIOTTI, I., BROUWER, A. and GELORMINI, M. (2018), ‘Is Milan a City for Elderly? Mobility for Aging in Place’, TeMA, Journal of Lend Use, Mobility and Environment, Special Issue, 2, pp. 95–104.
MARIOTTI, I., BURLANDO, C. and LANDI, S. (2021), ‘Is Local Public Transport unsuitable for elderly? Exploring the cases of two Italian cities’, Research in Transportation Business & Management, 40, 100643. https://doi.org/10.1016/j.rtbm.2021.100643
METZ, D. (2000), ‘Mobility of older people and their quality of life’, Transport Policy, 7, pp. 149–152. https://doi.org/10.1016/S0967-070X(00)00004-4
MEYER, J. and SPEARE, A. (1985), ‘Distinctively elderly mobility: Types and determinants’, Economic Geography, 61 (1), pp. 79–88. https://doi.org/10.2307/143676
NORDBAKKE, S. (2013), ‘Capabilities for mobility among urban older women: barriers, strategies and options’, Journal of Transport Geography, 26, pp. 166–174. https://doi.org/10.1016/j.jtrangeo.2012.10.003
NORDBAKKE, S. and SCHWANEN, T. (2014), ‘Well-being and mobility: A theoretical framework and literature review focusing on older people’, Mobility, 9 (1), pp. 104–119. https://doi.org/10.1080/17450101.2013.784542
OECD (2017), Preventing Ageing Unequally, OECD Publishing.
OECD (2019), Pensions at a Glance 2019: OECD and G20 Indicators, OECD Publishing.
OEPPEN, J. and VAYPEL, J. W. (2002), ‘Broken limits to life expectancy’, Science, 296 (5570), pp. 1029–1031. https://doi.org/10.1126/science.1069675
PAULLEY, N., BALCOMBE, R., MACKETT, R., TITHERIDGE, H., PRESTON, J., WARDMAN, M., SHIRES, J. and WHITE, P. (2006), ‘The demand for public transport: The effects of fares, quality of service, income and car ownership’, Transport Policy, 13 (4), pp. 295–306. https://doi.org/10.1016/j.tranpol.2005.12.004
PRESTON, J. and RAJÉ, F. (2007), ‘Accessibility, mobility and transport-related social exclusion’, Journal of Transport Geography, 15 (3), pp. 151–160. https://doi.org/10.1016/j.jtrangeo.2006.05.002
ROSENBLOOM, S. (2001), ‘Sustainability and automobility among the elderly: An international assessment’, Transportation, 28 (4), pp. 375–408. https://doi.org/10.1023/A:1011802707259
ROSENBLOOM, S. (2004), ‘Mobility of the elderly: Good news and bad news’, [in:] Transportation in an ageing society: A decade of experience. Conference Proceedings, Washington DC: Transportation Research Board of the National Academies, 27, pp. 3–21.
ROSENBLOOM, S. (2009), ‘Meeting Transportation Needs in an Aging-Friendly Community’, GENERATIONS – Journal of the American Society on Aging, 33 (2), pp. 33–43.
RYAN, J., WRESTRAND, A. and SCHMIDT, S. M. (2015), ‘Exploring public transport as an element of older persons’ mobility: A capability approach perspective’, Journal of Transport Geography, 48, pp. 105–114. https://doi.org/10.1016/j.jtrangeo.2015.08.016
SCHEINER, J. and HOLZ-RAU, C. (2012), ‘Gender structures in car availability in car deficient households’, Research in Transportation Economics, 34 (1), pp. 16–26. https://doi.org/10.1016/j.retrec.2011.12.006
SIREN, A. and HAUSTEIN, S. (2013), ‘Babyboomers’ mobility patterns and preferences: What are the implications for future transport?’ Transport Policy, 29, pp. 136–144. https://doi.org/10.1016/j.tranpol.2013.05.001
SMITH, G. C. (1988), ‘The spatial shopping behaviour of the urban elderly: A review of the literature’, Geoforum, 19 (2), pp. 189–200. https://doi.org/10.1016/S0016-7185(88)80028-9
SZETO, W. Y., LINCHUAN YANG, WONG, R. C. P., LI, Y. C. and WONG, S. C. (2017), ‘Spatio-temporal travel characteristics of the elderly in an ageing society’, Travel Behaviour and Society, 9, pp. 10–20. https://doi.org/10.1016/j.tbs.2017.07.005
United Nations, Department of Economic and Social Affairs, Population Division (UN) (2013), World Population Prospects: The 2012 Revision, Highlights and Advance Tables. Working Paper No. ESA/P/WP.228.
United Nations, Department of Economic and Social Affairs, Population Division (UN) (2015), World Population Ageing 2015, United Nations, New York.
VAN ACKER, V., GOODWIN, P. and WITLOX, F. (2016), ‘Key research themes on travel behavior, lifestyle, and sustainable urban mobility’, International Journal of Sustainable Transportation, 10 (1). https://doi.org/10.1080/15568318.2013.821003
VAN DEN BERG, P., KEMPERMAN, A., DE KLEIJN, B. and BORGERS, A. (2016), ‘Ageing and loneliness: The role of mobility and the built environment’, Travel Behaviour and Society, 5, pp. 48–55. https://doi.org/10.1016/j.tbs.2015.03.001


Received: 20.01.2021. Revised: 14.05.2021. Accepted: 10.11.2021.