
Spatio-temporal and demographic distribution of public transport accessibility: A GIS-based method using OpenTripPlanner
Michał KACZOROWSKI  *
Wiktor WRÓBLEWSKI *
Abstract. This study develops and demonstrates an open-source, reproducible workflow for measuring the temporal (service-time) accessibility of public transport for a specific age group (university students), and translates it into an operational, planner-oriented metric. Using OpenTripPlanner, GTFS and OpenStreetMap data, campus accessibility in six Polish cities is computed at one-minute resolution over a 16-hour window, as the cumulative minutes a campus is reachable within 30 minutes. Combined with census data, this yields the share of the student-aged population with access. The results consistently link rail infrastructure to higher, more stable accessibility and reveal marked central–peripheral disparities, offering planners a transparent diagnostic tool.
Key words: GIS, public transit, accessibility, spatio-temporal analysis, open-source.
1. Introduction
Continuity of public-transport access to university campuses plays a key role in shaping students’ travel behaviour and everyday quality of life (De Vos et al., 2025). Irregular or episodic service constrains students’ ability to plan classes and part-time work, increases trip uncertainty and can exacerbate transport-related time-poverty for those without access to a car (Aitken et al., 2024). Empirical research shows that better objective and perceived availability of transport services is associated with higher use of active and public modes and lower car dependence, with attendant implications for emissions and local air quality (van der Vlugt et al., 2022). Perceptions and lived experiences of accessibility also feed into housing and scheduling decisions, producing spatial inequalities in access to higher education and other opportunities (Kenyon, 2011).
Transport accessibility, understood as the ease with which residents can reach their activity-related locations, remains a central dimension of contemporary urban functioning. Although conceptually straightforward, accessibility is a complex phenomenon contingent on transport-network density, timetable provision, and local topography. Early studies linking accessibility to spatial development date back to the mid-20th century (Hansen, 1959), and subsequent work has highlighted its role in reinforcing social exclusion and spatial inequality (Wachs and Kumagai, 1973). In recent decades, and in line with the rise of sustainable mobility policy, accessibility has regained prominence in planning analyses (Miller, 2018). High car dependency generates a range of adverse outcomes, elevated greenhouse-gas emissions, increased noise and congestion, leading to public-health consequences, while effective public transit supports the development of more resilient cities. Addressing these challenges through accessibility analysis and improved passenger transport provision is, therefore, a key instrument for mitigating the negative externalities of urban mobility (Mavoa et al., 2012; Ford et al., 2015; Malekzadeh and Chung, 2020).
The literature proposes several methods for measuring accessibility (Bruinsma and Rietveld, 1998). There is broad consensus regarding the five principal methods for accessibility research (Baradaran and Ramjerdi, 2001; Geurs and Van Wee, 2004; Rosik, 2012). This study employed the cumulative (isochrone) method, which measures accessibility by counting opportunities reachable within a specified travel-time or cost threshold, e.g., inhabitants reachable within 15 minutes or hospitals within 1 hour (Rosik, 2012, p. 24).
The measurement of transport accessibility began with simple gravity-based methods proposed by Hansen (1959). Over the years, continuous technological development and the breakthrough of the 1990s, associated with the popularisation of Geographic Information Systems (GIS), have accelerated research and improved the accuracy of studies in this field (O’Sullivan et al., 2000; Liu and Zhu, 2004). The use of advanced computer algorithms integrated with a GIS environment first enabled a shift from simple Euclidean buffers (equidistants) to isochrones that account for the actual layout of the road and pedestrian network (O’Sullivan et al., 2000). In the next step of this methodological evolution, a temporal aspect was added to the analysis, which was largely enabled by the widespread adoption of the General Transit Feed Specification (GTFS) standard. This format allows public transport operators to share detailed timetable data in a unified manner (Fortin et al., 2016). GTFS data can then be used in both public journey planners and in advanced temporal accessibility analyses that integrate the network, routes, and schedules within a standardised framework (Fayyaz, Liu, and Zhang, 2017). It is worth emphasising that contemporary research in this field aims to standardise measurement methods, and the increasing use of free and open-source tools enhances the transparency and replicability of the research process.
GIS provides the ability to spatially link data, allowing us to obtain information about the location of a given phenomenon. OpenTripPlanner (OTP) is a free and open-source tool based on a path-finding engine used for multimodal route planning and transport analysis. OTP utilises the Java environment for pathfinding; operations can be conducted via R (otpr package) or from Python using custom scripts built around OTP’s scripting API (Python-OTP). Pedestrian and cycling trips are calculated using the A-star algorithm, while public transport routing employs a combination of A-star and the Tung-Chew heuristic (Higgins et al., 2022). Its advanced functionalities allow for the construction of complex transport models by integrating data on pedestrian and road networks, mostly from the OpenStreetMap (OSM) database, with data on public transport timetables in the GTFS format. A notable advantage of OTP is its ability to model door-to-door journeys, explicitly accounting for access and egress times, waiting, in-vehicle travel and transfers, an aspect identified as relatively underexplored in the literature (Mavoa et al., 2012). Such a constructed, integrated network model becomes the basis for conducting detailed calculations, such as temporal accessibility analysis.
Despite its significant capabilities, the application of this methodology is associated with certain limitations, which stem from both the nature of the tools and the quality of the input data. Although standardised, data in GTFS format most often represents the planned schedule rather than the actual one. This may lead to overly optimistic analysis results, as the model does not account for delays, cancelled services or road congestion affecting the actual travel time (Fayyaz, Liu, and Zhang, 2017). Furthermore, the quality and completeness of GTFS data are varied. In many cities, Polish ones included, these data do not cover all operators or are not regularly updated, which can lead to an incomplete picture of the transport system (Malekzadeh and Chung, 2020; Zmuda-Trzebiatowski et al., 2025). OTP engine itself, although powerful, also has its limitations, especially in older versions, such as high computational requirements for analyses of large areas and in high temporal resolution (Fortin et al., 2016). Awareness of these limitations is crucial for the proper interpretation of the results and the formulation of cautious conclusions.
2. Literature review
Contemporary approaches to transit accessibility span a spectrum from simple spatial indices to high-resolution, time-sensitive metrics. Traditional location-based measures remain common. Cumulative measures count opportunities reachable within a fixed travel-time threshold, while gravity measures weight opportunities by travel cost (Geurs and Van Wee, 2004). The same reachability relation can be read from two complementary perspectives: active (origin-based) accessibility, describing how easily a resident can reach activities such as work or education, and passive (destination-based) accessibility, describing how easily a given location can be reached by its potential users, for example workers or students (Cascetta et al., 2016; Lee and Salih, 2024). The choice of cost function or threshold strongly influences results.
Public Transport Accessibility Levels (PTAL) and frequency-based methods (used primarily for buses) emphasise service presence, frequency and reliability. Due to the technical limitations these methods do not consider travel time (Wu and Hine, 2003). They are well suited for quick local area studies in urban situations. Studies concerning the temporal dimension of accessibility often calculate measures for a single, specific time of day (Krizek et al., 2009; Benenson et al., 2010; Mavoa et al., 2012; Owen and Levinson, 2012). Such single-point approaches omit information on service duration and intra-day variability (Farber et al., 2014; Fayyaz, Liu and Porter, 2017). Even studies adopting broader temporal windows often apply relatively coarse aggregation, Fan et al. (2012) reported hourly accessibility estimates, Goliszek (2021), used 15-minute intervals, and Owen and Levinson (2015) and Pönkänen et al. (2025) computed minute-level accessibility but only for selected peak periods. Such choices can reduce the accuracy of accessibility assessments and provide systematically obscure conditions outside the sampled intervals. They influence notably off-peak performance and short-lived accessibility spikes or troughs (Fayyaz, Liu and Porter, 2017). A pervasive methodological issue across the reviewed studies is the computation of accessibility indicators within administrative units (e.g., municipalities), whose spatial extent and population structure differ substantially. The aggregation units may vary markedly in scale, from entire municipalities down to neighbourhoods or individual city blocks depending on the study. The analysed areas differ both in size and in resident counts. Since such units are heterogeneous and non-standardised, their use risks introducing aggregation bias (including Modifiable Areal Unit Problem (MAUP) effects) (Wong, 2009), which may systematically overestimate accessibility in some areas and underestimate it in others (Qu et al., 2025).
Alongside OTP, other tools are widely utilised, such as ArcGIS Pro with the Network Analyst extension, R5, and Emme, each characterised by a specific set of advantages and limitations. Findings from Higgins et al. (2022) clearly indicate varied performances across these engines depending on the analytical scale. For small-scale local analyses (1x100 origin-destination pairs), OTP-R demonstrated relatively high efficiency, completing calculations in approximately 20 seconds, whereas ArcGIS Pro required 1 minute and 37 seconds. However, as task complexity increases, the performance disparities become dramatic. For a larger number of origin-destination pairs (1,000x1,000), the R5 engine executed the calculations in just 9 seconds, while ArcGIS Pro required 6 minutes and 56 seconds. In this scenario, OTP-R proved insufficient, failing to complete the calculations even after 24 hours. Furthermore, R5 was the only engine capable of conducting regional-scale analyses (100,000x100,000 origin-destination pairs), with a computation time of 18 hours and 16 minutes, highlighting its scalability in the context of large datasets. Mean travel times also differ substantially between tools. It was found that OTP and R5 consistently indicated mean travel times 6 to 7 minutes longer than ArcGIS Pro (70 minutes), while the longest mean travel time was recorded in the Emme package (86 minutes). This discrepancy resulted from Emme’s inclusion of network congestion data, suggesting that these tools differ not only in performance but also in the degree of realism regarding the modelling of traffic conditions. This underscores the necessity of an informed tool selection based on research specificity and the expected level of detail in reflecting actual transport conditions. Defining parameters, such as the maximum walking distance to and from a stop, maximum door-to-door travel time, pedestrian speed, and the minimum service level considered acceptable for residents, seems crucial for this type of transport network model.
The traditional planning approach, which assumes fixed access distance thresholds of 400 meters for buses and 800 meters for rail, is increasingly being questioned (Kaszczyszyn and Sypion-Dutkowska, 2019; Van Soest et al., 2020; Tennøy et al., 2022). Indeed, contemporary research indicates that the actual distances walked by public transport passengers are characterised by significant variation, and the current state of knowledge on this topic remains incomplete, especially in the context of cities of different sizes. An extensive literature review by Van Soest et al. (2020) shows that many factors influence the distance people are willing to walk. However, discrepancies may arise at the data collection stage depending on whether researchers rely on subjective methods, such as surveys, or objective methods, such as GPS traces. Passengers tend to inaccurately report the distances they have walked and round their travel times to five-minute intervals, which can significantly affect analysis results in dense urban fabric where every minute matters (Chia et al., 2016).
Acceptable walking distance to a transit stop varies by mode and context but empirical studies place typical values roughly between 200 and 1 400 m (Van Soest et al., 2020). National and city-level evidence illustrates this spread. British surveys report mean walking times of 5.9 minutes (400 m) to a bus stop and 9 minutes (600 m) to a rail station (Krygsman et al., 2004), while Oslo averages were 520 m to a public transport (PT) stop and 688 m to rail (Tennøy et al., 2022). Broad comparative data from the Organisation for Economic Co-operation and Development (OECD) indicate that 71% of residents in functional urban areas have a PT stop within a 10-minute walk, with a strong spatial gradient (84% of population in centres as opposed to 56% in the suburbs). In Poland the same report shows an even greater contrast between the centres and the suburbs (97% vs 68%) (OECD, 2024). A comparable Polish picture emerges in the Tricity agglomeration (Gdańsk, Gdynia, Sopot), where 83.5% of residents reach their nearest stop within a five-minute walk and only 0.45% face unfavourable access, although coverage deteriorates markedly in peripheral districts such as south-western Gdynia (Soldatke et al., 2024). Transfer requirements and perceived inconvenience also reduce acceptable walking distances, except in some rapid-transit contexts, such as metro (Alshalalfah and Shalaby, 2007). Syntheses and meta-analyses typically suggest using thresholds in the 300–800 m range for modelling purposes (Mavoa et al., 2012; Malekzadeh and Chung, 2020). 800 m as the maximum walk catchment was adopted for the present study, both to accommodate the young student cohort`s higher walk tolerance and because the OTP implementation used does not allow mode-specific walk thresholds.
Empirical evidence indicates substantial variation in students’ commute durations, driven largely by context and individual motivation. National and city studies report modal and temporal differences. German sources cited by Pfertner (2023) have found that 50–70% of work commutes are shorter than 30 minutes, while large-sample surveys in Germany showed mean travel times of about 30–35 minutes (George et al., 2025). Observing students’ behaviours yields wider spreads. Warsaw surveys report average PT journeys of 39–44 minutes (Monkiewicz et al., 2005), Amsterdam students averaged 50 minutes (44% commuted by train, 24% by bus/ metro/ tram) (Kobus et al., 2015), and Poznań respondents indicated that 63% reach university within one hour by PT (Oleśków-Szłapka et al., 2020). EUROSTUDENT VII report places the EU mean at 40 minutes for students living with parents and 15 minutes for those in dormitories (Hauschildt et al., 2021). Studies conducted across German and Polish universities reported 28–30 minutes of travel time (Diebig et al., 2021; Jażdżewska et al., 2022). Comparative work for Russia and Bavaria reports similar averages of 32–34 minutes with markedly different modal shares (Starikova, 2019). Overall, Western European students display a more multimodal distribution of commute modes, whereas in several Central/ Eastern contexts (notably Poland) PT dominates student travel. For the purposes of the computational model, a travel time of 30 minutes was considered the maximum acceptable value for students.
Pedestrian walking speed is one of the most important factors in building an urban transport system. However, unlike vehicular traffic, few data on pedestrians are collected (International Transport Forum, 2019; Giannoulaki and Christoforou, 2024). Many studies assume a speed of 1.2 m/s (Biuro Inżynierii Transportu, 2019; International Transport Forum, 2019; OECD, 2024), which in a broad generalisation may be appropriate but becomes less precise in more specific cases. According to a 2024 literature review, the factors that influence speed include: age, gender, walking in a group, holding a phone or luggage, crowd density, and the measurement method. Crowd density, i.e., the number of people per square meter, appears to be the factor with the greatest impact on pedestrian speed (Giannoulaki and Christoforou, 2024). In a 2011 meta-analysis considering 41 studies, an average walking speed of 1.35 m/s was observed for men aged 20−29 and 1.34 m/s for women aged 20−29 (Bohannon and Williams Andrews, 2011). According to a literature review by Stępniak and Goliszek (2017), pedestrian speed ranged from 3.2 to 5.4 km/h. Thus, in their accessibility study, they decided to use a value of 4.5 km/h, which corresponds to 1.25 m/s. This sensitivity to the assumed group is confirmed by field measurements: Willberg et al. (2023) recorded an average walking speed of 5.15 km/h (≈1.43 m/s) for working-age adults in the Helsinki Metropolitan Area, roughly one fifth faster than older pedestrians (4.3 km/h), confirming that the speed parameter should reflect the target population – here, a young student cohort. The model used in this study applied a constant walking speed of 1.3 m/s, which corresponds to 4.68 km/h.
The establishment of a minimum level of transport service, expressed in the number of hours of service availability per day, is more recent and less explored aspect in accessibility analyses (Järv et al., 2018). Traditional methods, focusing on single points in time, often overlooked this dimension, leading to an incomplete picture of the transport system’s functionality. It was only the development of computational tools that enabled analyses over broad time windows, which in turn raised the question of defining a ‘sufficient’ level of service. There is currently no single, universally accepted standard. The approaches in literature are varied, they often result from the specifics of the study areas and the objectives of the analysis. The Transit Cooperative Research Program (TCRP) defines Level of Service (LOS) introducing ranges from A, where transport is available for 18 or more hours a day, to F, where the operating range is from 0 to 4 hours (Transportation Research Board and National Academies of Sciences, 2013). However, it should be noted that these indicators do not consider the travel time to a given location, only the duration for which transport is available. Experiences gathered from 35 European Union cities indicate a service time span ranging from 14 to 21 hours per day. Longer service times were correlated with a higher number of passengers (Finn et al., 2011).
In literature, static accessibility analyses, which measure access to specific destinations at a single point in time, remain common. However, such an approach often overlooks the crucial temporal dimension, failing to fully capture the fluctuations in the quality of transport services throughout the day. The issue of dynamic transport accessibility, which considers the variability of timetables and the resulting changes in network reach, remains a relatively less explored area. Although the last decade has seen a growing interest in dynamic modelling, and several important works have appeared in the literature on this topic (Farber et al., 2014; Fayyaz, Liu, and Zhang, 2017; Stępniak and Goliszek, 2017; Järv et al., 2018; Pfertner et al., 2023; Niedzielski et al., 2024), there is still a need for further development and standardisation of methods. Moreover, spatial aggregation practices remain heterogeneous. Many studies compute accessibility within administrative units (ranging from municipalities to neighbourhood blocks) whose extent and population structure vary considerably, thus risking aggregation bias and MAUP effects which can influence results greatly (Vale and Lopes, 2023; Lindner et al., 2024). To enhance comparability, researchers increasingly advocate for standardised spatial units like regular hexagonal grids (Pfertner et al., 2023) or population-weighted aggregation. The effectiveness depends on their design and scale, so explicit sensitivity testing and justification of the chosen scheme are still required. One of the more recent works suggests conducting the analysis in 15-minute intervals, maintaining a balance between accuracy and the time required for calculations (Stępniak et al., 2019). Another approach suggests calculating the median travel time from 1-minute intervals for each origin-destination pair to verify accessibility (Conway et al., 2018). Temporal variation in walking accessibility has also been documented at the individual level: Willberg et al. (2023) have showed that diurnal, seasonal, and age-related variation substantially alter walking accessibility landscapes in Helsinki, highlighting the need to move beyond the ‘average person’ assumption in accessibility modelling. A significant limitation of some of the previous research is its reliance on commercial, closed-source software. Its algorithms often operate as a ‘black box,’ which hinders the full verification and replication of the results (Liu and Zhu, 2004; Mesbah et al., 2012; Ford et al., 2015). In response to the challenge, the methodology presented here is based entirely on a transparent ecosystem of open-source tools, which constitutes one of its fundamental strengths. Educational destinations have occasionally been examined in the Polish context. Rosik et al. (2021) applied a potential accessibility model to upper secondary schools in Kraków, using the population aged 15–19 as a demand proxy and the supply of school places, and identified spatial inequities that informed recommendations for new school locations. Such studies, however, remain static and centred on the school level, leaving temporal accessibility to higher-education campuses largely unaddressed. Furthermore, previous analyses of dynamic transport accessibility have largely focused on commuting to workplaces. This has resulted in other travel destinations, such as academic centres, being relegated to an area of lesser scientific significance, even though the student population is highly dependent on public transportation.
3. Knowledge GAP and AIM
Despite growing interest in dynamic accessibility measures (Fayyaz, Liu and Porter, 2017; Järv et al., 2018), most studies either sample a single time point or use coarse temporal aggregation (Fayyaz, Liu, and Porter, 2017; Stępniak et al., 2019), and few provide a replicable, open-data workflow focused on specific social groups (Pfertner et al., 2023; Pönkänen et al., 2025). This paper addresses that gap by developing and demonstrating a service-time metric that measures the cumulative duration of access across a 16-hour daily service window (6 a.m.–10 p.m.) at one-minute resolution. The method is implemented entirely with open tools and data (GTFS, OSM, OTP), and explicitly links space-time accessibility to a specific age group – young adults, potential university students – to reveal potential educational exclusion and time-poverty for non-car users. Our contribution is, therefore, methodological and substantive by providing transparent, replicable metric and evidence on how urban morphology and rail provision spatially select who can realistically study without a car and at what quality of life.
Contemporary research on transport accessibility often employs advanced indicators and complex mathematical formulas (Boisjoly and El-Geneidy, 2017; Malekzadeh and Chung, 2020). While precise, such approaches risk low readability of the results for audiences outside a narrow circle of experts, such as residents or urban decision-makers, which can limit the practical application of these analyses in the planning process, a gap repeatedly documented between accessibility instruments and planning practice (Boisjoly and El-Geneidy, 2017; Shi et al., 2020). In response to this challenge, the methodology adopted in this study places particular emphasis on the communicativeness and transparency of the research process, without sacrificing analytical precision. The fundamental assumptions that guided the chosen research approach were:
- The use of open-source tools: the entire analytical process, from data processing to visualisation, was based on free and open-source software (including QGIS, OTP, R/Python). This choice ensures full transparency and eliminates licensing barriers that often restrict access to advanced research.
- Reliance on publicly available, free data: the research is based on commonly available data, such as GTFS and OSM. This allows for the full replicability of the presented methodology by other researchers in different urban contexts.
- Transparency and applicability of the method: each stage of the workflow, from data acquisition to obtaining the final results, has been described in detail. This ensures the easy implementation of the proposed model and to guarantee its high applicability in planning practice.
- Communicativeness of the results: particular attention was paid to presenting the results in a form that is intuitively understandable to a wide range of urban planning community members, including those who are not experts in the field of transport. The priority was to create visualisations that directly and clearly communicate the spatial differentiation of accessibility.
The aim of this study is to develop and demonstrate an open-source, reproducible workflow for measuring the temporal (service-time) accessibility of public transport for a specific age group (university students), and to translate it into an operational, planner-oriented metric. The pillars of the approach are the use of open tools and freely available data, ease of implementation in urban planning practice, and the communicability of results for a wide audience including non-technical planners. While individual methodological components, such as OTP routing, GTFS data, hexagonal spatial units, and temporal accessibility analysis, are each established in the literature, the contribution of this study lies in their integration into a single transparent and replicable operational framework, and in the application of a service-time coverage metric at one-minute temporal resolution across six Polish cities. The distinctive feature of this metric is the focus on how many hours per day each residential location is served within an acceptable travel time, and how this distribution maps onto the student-age population, an aspect neglected by standard accessibility analyses, which treat accessibility as time-invariant. Findings from the six evaluated cities may inform planning practice and form a basis for targeted policy recommendations.
Throughout this paper, the term ‘temporal continuity of accessibility’ refers to the cumulative duration – expressed in minutes – during which a given origin remains within the travel-time catchment of the destination across the analysis window. The term is used in the sense of temporal service coverage rather than uninterrupted sequential access; it is positioned within the growing body of literature on dynamic and time-varying accessibility (Farber et al., 2014; Fayyaz, Liu and Porter, 2017; Järv et al., 2018)
4. Methodology
4.1. Study area
Considering the data from Statistics Poland (Central Statistical Office of Poland) for the 2023/24 academic year (Statistics Poland, 2024b), six cities were selected for the study. The cities were curated by the number of students, and the largest campus in each city was analysed. Table 1 reports actual university enrolment figures for 2023/24 (Statistics Poland, 2024b), included as contextual background for city selection. The accessibility analysis uses a separate dataset, the population aged 20–29 from the 2021 National Census (Table 2), as a freely available proxy for the student-age population, which can be easily mapped. The two measures serve different purposes and are not directly comparable. The spatial delimitation covered the area of the municipality where the campus was located.
| City | University | Number of students | Population aged 20–29 |
|---|---|---|---|
| Warsaw | University of Warsaw | 35,543 | 231,078 |
| Poznań | WSB Merito University in Poznan | 33,991 | 79,864 |
| Kraków | Jagiellonian University in Krakow | 33,515 | 115,019 |
| Łódź | University of Lodz | 23,188 | 71,011 |
| Wrocław | Wroclaw University of Technology | 20,320 | 97,405 |
| Gdańsk | University of Gdansk | 19,697 | 66,022 |
Source: Statistics Poland (2024).
4.2. Data acquisition
The municipal boundaries were obtained from a spatial dataset collected in the Database of Topographic Objects (BDOT10K). OSM network data was collected with OSM by The Slice website (2025) which enables the export of municipal-bounded extracts and, thus, produces spatially smaller datasets. This improves the spatial fidelity of travel-time rasters, whose default extents in OTP are otherwise constrained, and aligns with our spatial-standardisation approach. Suburban areas, characterised by mixed land use and weaker service provision, are especially sensitive to data resolution and therefore benefit most from this targeted extraction strategy (Qu et al., 2025). GTFS data concerning public transport and urban rail timetables were obtained from the websites of municipal transport companies or from platforms that aggregate this type of data (e.g., https://mkuran.pl/gtfs/, https://www.transit.land/, and https://mobilitydatabase.org/) (Zmuda-Trzebiatowski et al., 2025). It should be noted that the number and type of operators included in the GTFS dataset varies between cities, which may influence the comparability of results. Cities with more complete GTFS coverage – covering a greater number of operators – may show higher accessibility values not solely due to superior transport provision, but partly as a reflection of richer data availability. This potential bias should be considered when interpreting cross-city comparisons. Timetables were downloaded for public transport modes such as bus, tram, and urban rail. Datasets for rail carriers (PolRegio, PKP Intercity) and long-distance bus services (Flixbus) were not downloaded, as they are not transport modes frequently chosen by students for commuting to university. Accordingly, throughout this paper the term ‘rail’ refers to urban rail and metro only, not to long-distance services, which are absent from the GTFS feeds used. GTFS timetables were downloaded incrementally as each city was added to the analysis, with all datasets obtained during the academic year on weekday schedules. Given the limited and uneven GTFS coverage in Poland, concentrated primarily around the largest agglomerations, some datasets were accessible only at the time of the original download and are no longer available for retrieval. The final timetable dataset was downloaded on 1 August 2025. It should be noted that urban timetables in Poland typically operate on a consistent weekday schedule throughout the academic year, with significant changes occurring only during summer holiday periods; the present study does not use summer schedules. Importantly, the download date is distinct from the analysis date: for each city, the routing date supplied to OTP was set to a typical weekday within the academic year, covered by the validity period of the corresponding GTFS feed. Routing dates, therefore, differed between cities, reflecting the staggered data acquisition described above.
4.3. Model structure
The process of building the temporal accessibility model began with the generation of a regular hexagonal grid with a side length of 500 meters, which served as the basic unit for spatial analysis. The use of a hexagonal grid, compared to the commonly used square grid, allowed for a reduction in the number of analysed cells by approximately 30%, which optimised the computational process (Burdziej, 2019). The choice of the grid cell size was a compromise between the required level of detail and the readability of the final visualisations (Shoman et al., 2019). Moreover, the application of hexagons provided a standardised spatial grid, well suited for accessibility analysis. The locations corresponding to the main entrances of each of the analysed campuses were designated as the travel destinations. This was based on the assumption that crossing the campus gate is equivalent to reaching the destination. In the next step, public transport timetable data in the GTFS format were acquired from data repositories for the studied cities. The analysis was conducted for a 16-hour time window, from 6 a.m. to 10 p.m., which was considered representative of a typical student’s weekday activity. The calculations were performed using a locally run OTP server, which is an open-source engine for multimodal route planning. Communication with the server was carried out via the R language and the dedicated otpr package, which is an addition to base software, based on publicly available instructions and workflows (Young, 2021, 2022). The study utilised OTP version 1.5.0. Although newer releases of OTP (2.x series) are available, version 1.5.0 was specifically selected because it is the last version to support the “create_surface” function within the otpr package, the core capability used to generate per-minute raster accessibility surfaces. This analytical functionality was removed in OTP 2.x, making the earlier version a necessary choice for the presented workflow.
The OTP engine employed in this work represents an advanced tool for multimodal route planning, with inter-modality being one of its core features. This means that OTP is capable of integrating various modes of transport—pedestrian, cycling, and public (buses, trams, rail)—within a single, coherent analysis. By default, the model imposes no limits on the number of transfers between individual public transport modes, enabling a more realistic behaviour within urban networks. However, it is possible to modify parameters such as the transfer penalty (transferPenalty) and the minimum transfer time (minTransferTime), which influence the frequency of modal shifts. The OTP algorithm focuses on minimising the cumulative door-to-door travel time, which encompasses access time to the stop, waiting time, in-vehicle travel time, and transfer time. The objective is, thus, to identify the fastest path from the origin to the destination, accounting for all available modal options and their interconnections. Such an approach allows for a realistic representation of accessibility, particularly in the context of the dynamic needs of students, for whom temporal travel efficiency is often a priority.
One of the key advantages of OTP is the ability to precisely define travel parameters, which allows for a realistic representation of passenger behaviour. Based on a prior literature review, the following parameters were defined in the model:
- maximum walking distance to a stop: 800 m,
- minimum transfer time: 60 s,
- transfer penalty: 60 s,
- walk reluctance: 3,
- wait reluctance: 2,
- walking speed: 1.3 m/s (which corresponds to 4.68 km/h).
The values of walkReluctance and waitReluctance were set above the OTP defaults (2 and 1, respectively) to better reflect the travel preferences of public transport users, for whom walking and waiting are typically more burdensome than in-vehicle time. The otpr package documentation explicitly recommends setting waitReluctance above 1 and below walkReluctance (Young, 2022), a condition satisfied by the chosen values. The transferPenalty and minTransferTime (60 s each) introduce a conservative transfer buffer, reflecting real-world imperfect schedule adherence and the cognitive cost of transfers, both set above the OTP default of zero.
To capture the dynamic nature of accessibility, the process of generating raster-based reachability maps was automated. Using a loop and the “create_surface” function in otpr package, a raster was created every minute, illustrating the area from which it was possible to reach the campus within 30 minutes at that specific moment. Subsequently, in the QGIS environment, the 960 rasters (16 hours x 60 minutes) obtained in this way were combined into a single virtual raster. The final stage involved processing this data using a PyQGIS script, which, for each cell of the hexagonal grid, counted in how many one-minute intervals during the day it was covered by the 30-minute reachability zone. The resulting values (from 0 to 960 minutes) were then classified into four categories describing access to the transport service:
- constantly accessible (12–16 hours),
- regularly accessible (6–12 hours),
- periodically accessible (3–6 hours),
- episodically accessible (0–3 hours).
We defined the thresholds as an operational classification, given the absence of an established standard for service-time categorisation in the literature. The upper category boundary (12 h) is informed by the Level of Service framework in the TCRP Transit Capacity and Quality of Service Manual, which defines LOS A as 18 or more hours of daily service availability (Transportation Research Board and National Academies of Sciences, 2013); the remaining boundaries were set to produce gradual interval widths across the 0–16-hour analysis window. This classification is intended to support intuitive interpretation by planners and is acknowledged as a methodological choice subject to sensitivity testing in future work. The proposed metric builds on the classical cumulative accessibility measure (Geurs and Van Wee, 2004):
 (1)
Where:
Ai : Cumulative accessibility of hexagon i
Oj : Number of opportunities at destination j
cij : Travel time between i and j
θ : Travel time threshold
f(cij) : Binary impedance function equal to 1 if cij ≤ θ and 0 otherwise
The classical (active) measure counts destinations reachable from i at one departure time. Whereas passive cumulative accessibility counts the number of users at origin locations who can reach a given destination within a given time threshold. In the study Sᵢ counts minutes during which a single destination remains reachable from i across the day. Formally, for each hexagonal cell i, the service-time coverage Sᵢ is defined as:
 (2)
Where j denotes the campus destination, T = {6:00, 6:01, …, 21:59} is the set of 960 one-minute departure times, cij(t) is the door-to-door travel time from hexagon i to campus j departing at time t, θ = 30 min is the travel time threshold, and f(cij(t)) is the binary impedance function defined in Equation (1) – equal to 1 if cij(t) ≤ θ and 0 otherwise. The resulting value Si ∈ [0, 960] represents the total number of minutes within the analysis window during which the campus is accessible from cell i. This measure is a special case of cumulative accessibility (Geurs and Van Wee, 2004; Rosik, 2012), extended to the temporal dimension: whereas the classical measure sums reachable destinations at a single departure time, Si sums reachable time intervals for a single fixed destination.
This categorisation not only facilitates the identification of areas with limited accessibility but also makes the analysis results more understandable for a wide range of audiences. Subsequently, demographic data obtained from the 2021 National Census (Statistics Poland, 2024a) were used to estimate the population with passive accessibility to public transport service-time. Census data were provided at the level of statistical enumeration units (obwody spisowe). To transfer population counts to the hexagonal grid, each enumeration unit was intersected with the hexagonal grid in a QGIS/PyQGIS environment. Population was then allocated to each hexagon proportionally to the share of a enumeration unit’s area falling within that hexagon (areal weighting). This standard approach assumes a uniform intra-unit population distribution, which may introduce some MAUP-related uncertainty in units with highly heterogeneous internal density patterns. The 20–29 age group was adopted as a demographic proxy for the student population. While actual student residential data would provide a more precise estimate, such datasets are not publicly accessible. The use of freely available census data is a deliberate methodological choice: it ensures that the workflow can be replicated for any city in Poland – or any country with comparable open census data – without requiring institutional data access agreements. The workflow was illustrated in Figure 1.
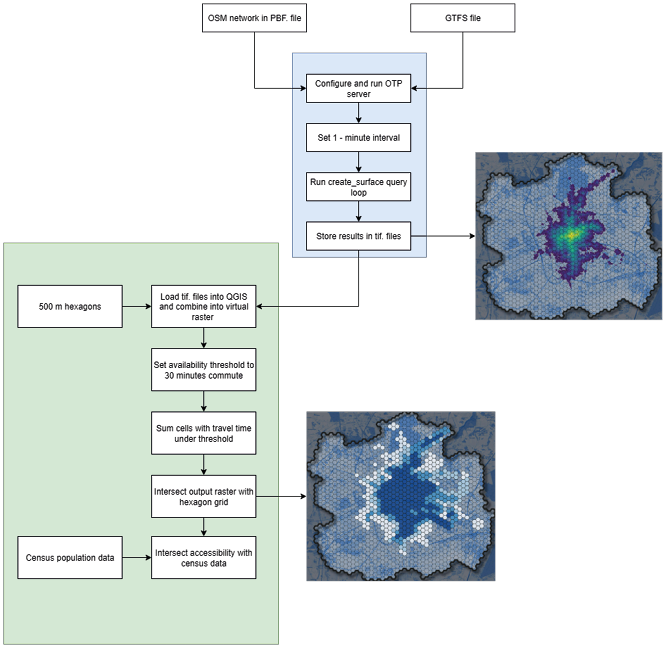
Source: own work.
The measures above describe active (origin-based) accessibility, the ease with which a resident at cell i can reach the campus. The complementary passive (destination-based) perspective describes the ease with which the campus can be reached by its potential users, here the student-aged population (Cascetta et al., 2016; Lee and Salih, 2024). Aggregating the cell-level coverage Si by resident population yields a city-level passive accessibility indicator, the share of the population aged 20–29 able to reach the campus:
 (3)
Where Pi is the resident population aged 20–29 in cell i, τ is the minimum service-time threshold defining access (here Si > 0, i.e. the campus is reachable in at least one departure minute), and g(Si) is a binary indicator equal to 1 when cell i qualifies. Active and passive accessibility are duals of the same reachability relation, differing only in whether opportunities or users are summed; consequently, the coverage figures reported in the Results section are passive accessibility measures.
5. Results
This section presents the results of the accessibility study in the form of maps and tabular summaries. The research was methodological in nature. The selected cities served to test the algorithm and demonstrate its functionality in various urban centres. Further in-depth work on the comparative analysis of the results obtained from the individual samples is necessary.
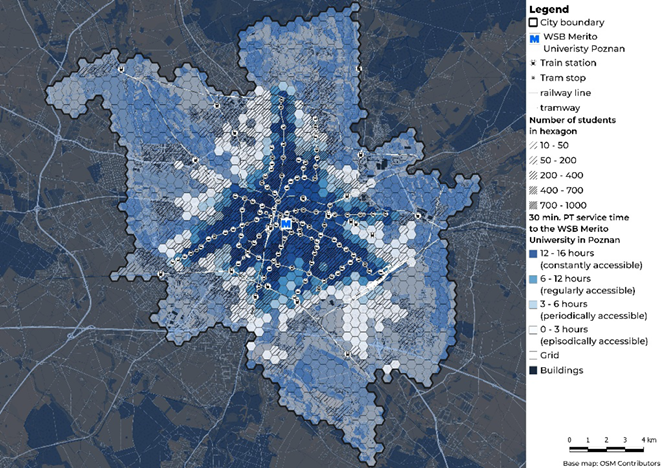
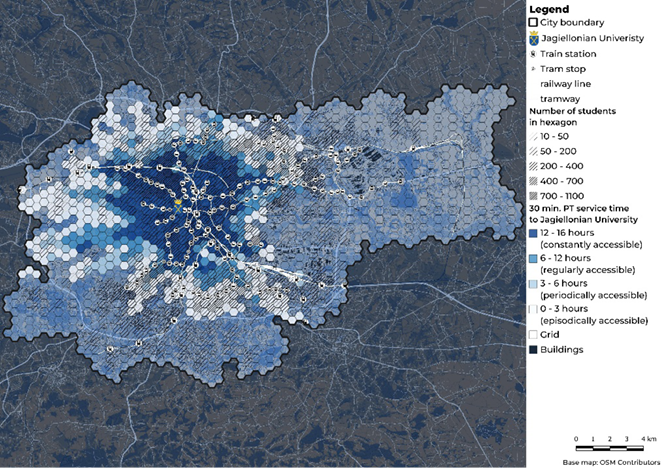
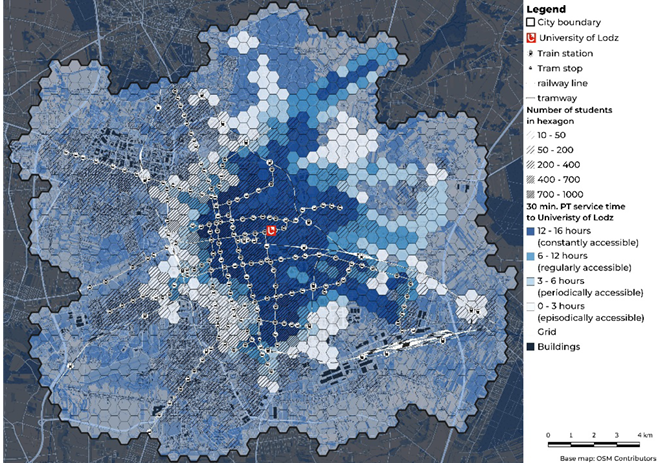
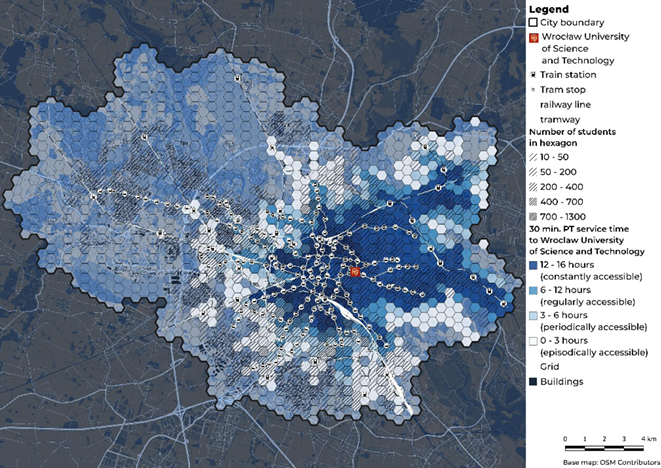
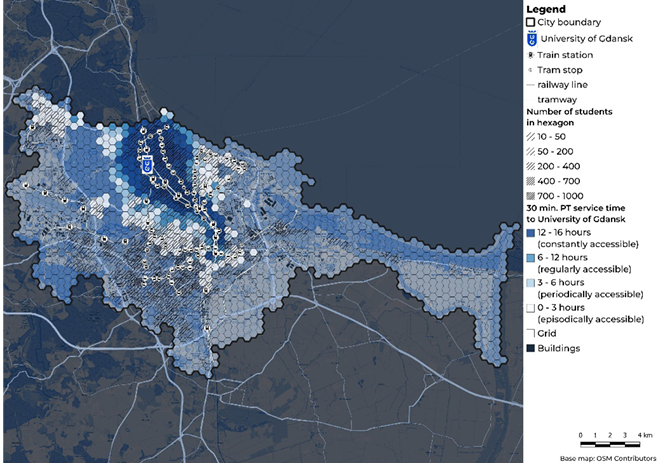
In all observed cases, certain general relationships were noted. The central location of a campus, in most cases, correlated with a higher share of constant accessibility. The closer the campus was to the city centre, the higher the accessibility. This situation is most likely caused by access to a longer service span of the lines and higher service frequencies, which translates into a greater number of hours per day during which these areas remain reachable within the designated time limit. A well-developed rail transport system is consistently linked to a higher share of areas with constant accessibility. This pattern is visible on the maps of all six cities. It is also supported by a simple proximity comparison. For each city, we compared hexagons located within 500 m of a tram or urban-rail stop (including metro in Warsaw) with all remaining cells. Hexagons close to rail stops reached a mean service-time of about 9.3 hours, while cells outside this catchment reached about 5.1 hours. In other words, rail-proximate areas offered roughly 1.8 times longer daily accessibility. This comparison is descriptive and spatial rather than a formal statistical test, but it reinforces the impression from the maps that proximity to rail-based public transport coincides with substantially longer service-time coverage. Where urban or agglomeration rail systems operate, a phenomenon of ‘accessibility islands’ is observed. The zones immediately surrounding the rail stations are characterised by significantly better accessibility values than neighbouring areas. These islands create spatial disparities that can mask weaker accessibility in intermediate areas. A high share of areas with episodic accessibility points to suburbanisation processes and the spatial expansion of housing beyond areas with good transport services.
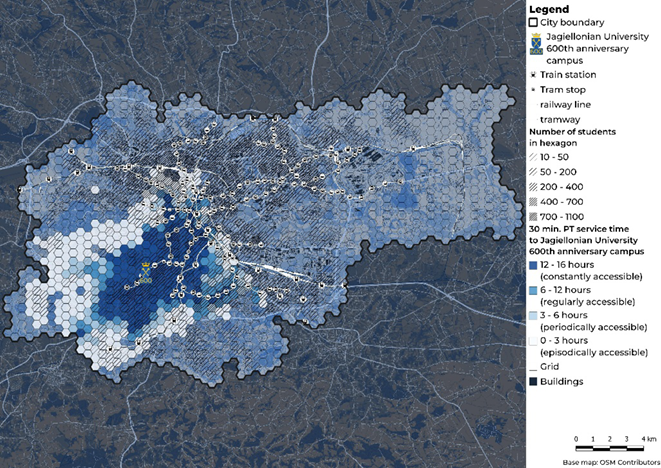
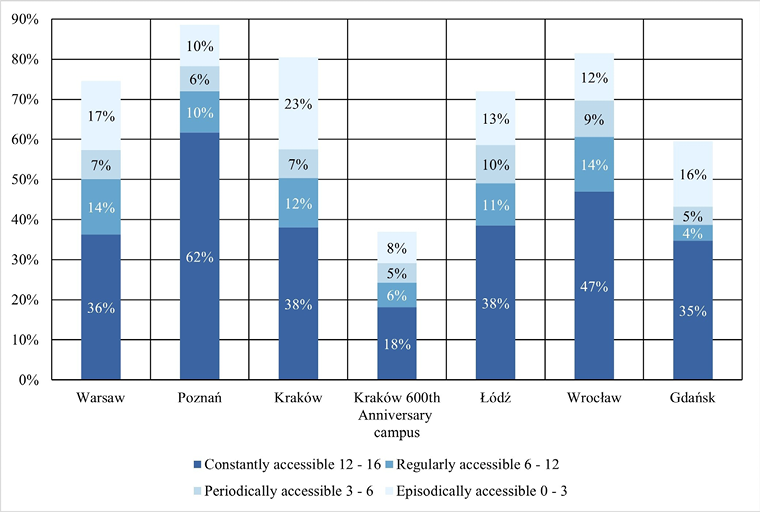
In terms of passive (destination-based) accessibility, the highest percentage of student-age young adults with access to their campuses within the studied time limit is achieved by Poznań (89%), followed by Wrocław (81%), Kraków (80%), Warsaw (75%), Łódź (72%), and Gdańsk (60%). An interesting case is Kraków, where the second campus, the 600th Anniversary Campus, achieved a result of only 37%. The dominant relationship is the increase in the total percentage of students with access as the share in the ‘constant’ category (12–16 hours of accessibility) increases. Poznań stands out with a very high share of constant access (62%), which strongly correlates with its best aggregated result. A high share of the episodic category (0–3 hours) signals a problem of fragmented service or intensifying suburbanisation processes, which is particularly visible in the case of Kraków (central campus). The spatial accessibility patterns for the individual cities are presented in Figures 2–8, while the aggregate distribution of the population across the four service-time categories is summarised in Table 2 and Figure 9.
In Warsaw, 75% of student-age population have accessibility within the studied time limit, with constant areas accounting for 36%. Visual analysis of the results on maps shows the relationship between the location of metro and urban rail stops and better accessibility. This link between rail infrastructure and accessibility has been quantified directly for Warsaw by Niedzielski et al. (2024): tram signal priority deployed at 187 intersections between 2015 and 2022 raised job accessibility by 8.3–8.5% at the 15 and 30-minute thresholds, with the largest gains in peripheral residential zones. Areas with episodic accessibility are largely served by buses. Poznań achieves the highest aggregated result (89% of students with access) and has the largest share of constant accessibility areas (62%). This distribution is linked to the very favourable location of the WSB Merito University campus in Poznań and the largest number of carriers included in the GTFS file. For Kraków, an 80% overall accessibility was noted, with a relatively high share of areas with episodic accessibility (23%). This can be linked to increased suburbanisation compared to other cities and a well-developed network of bus connections. The 600th Anniversary Campus shows a much lower level of accessibility. Only 37% of student-age population are within reach in the designated time, with constant areas at a level of 18%. This example shows that a single, peripheral campus location and the lack of multimodal transport in the immediate vicinity of the centre can significantly worsen accessibility conditions for its users. In Łódź, 72% of students have access, with a 38% share of constant areas. Similar to the other cases, a clear relation between rail transport and longer accessibility time can be observed on the results maps. Wrocław is characterised by a high level of accessibility (81%) and a constant share of 47%. This is related to its location in close proximity to a transport hub and a large transport offer. Gdańsk has the lowest aggregated result (60% of student-age population with access) and a relatively low share of regular (4%) and periodic (5%) categories. This is linked to the campus’s location away from the city centre.
An analysis of the collected research material enables one to formulate a fundamental conclusion regarding the modal structure of transport in the studied centres: tram communication and metropolitan rail constitute the absolute foundation of transport service continuity. In each of the analysed cities, a pattern was observed whereby areas located in the immediate vicinity of tram stops and railway stations are characterised by incomparably higher stability of access than zones relying solely on bus communication. Rail infrastructure, due to its independence from road congestion (in the case of dedicated tracks and railway lines) and high service frequency, generates corridors with the highest level of temporal reliability. In contrast, areas served only by bus transport tend to exhibit accessibility of an episodic or periodic nature, rendering them zones of increased risk of transport exclusion during dynamic changes in traffic intensity or schedule reductions. In every city, there were areas where public transport failed to provide access to the campus within 30 minutes. The percentage of individuals at risk of transport exclusion—those located outside any accessibility zone—ranged from 11% (Poznań) to 63% (Kraków’s 600th Anniversary Campus), with a mean value of 29%. Decisive factors for poor accessibility included the peripheral location of the campus and residential locations in suburbs far from the urban core. Generating the accessibility maps via the OTP server took an average of 25 minutes per city.

Source: own work.
Source: own work.
Source: own work.
Source: own work.
Source: own work.
Source: own work.
Source: own work.
| City | Population aged 20–29 | Population in accessibility zone | |||
|---|---|---|---|---|---|
| Constantly accessible 12–16 hours |
Regularly accessible 6–12 hours |
Periodically accessible 3–6 hours |
Episodically accessible 0–3 hours |
||
| Warsaw | 231,078 | 83,893 | 31,712 | 16,995 | 39,690 |
| Poznań | 79,864 | 49,261 | 8,217 | 5,072 | 8,163 |
| Kraków | 115,019 | 43,710 | 14,148 | 8,343 | 26,352 |
| Kraków (600th Anniversary campus) | 115,019 | 20,918 | 7,043 | 5,532 | 8,978 |
| Łódź | 71,011 | 27,316 | 7,517 | 6,778 | 9,532 |
| Wrocław | 97,405 | 45,733 | 13,308 | 8,761 | 11,568 |
| Gdańsk | 66,022 | 22,929 | 2,601 | 3,022 | 10,771 |
Source: own work.
Source: own work.
6. Discussion
Research on transport accessibility is gaining importance, yet there is still a lack of widely available, free, and open-source tools that enable its dynamic analysis. Recent studies indicate that increasing the temporal resolution is a promising and developing methodological direction (Fayyaz, Liu and Porter, 2017; Pfertner et al., 2023; Pönkänen et al., 2025). The conducted analyses allow for a more precise spatial definition of gaps in urban transport compared to static isochrones, which only show the potential reach at a single moment in time. The presented model not only spatially demonstrates the accessibility but also combines the temporal dimension. The result is precise information about the duration of service within a defined space. The inclusion of an additional layer of demographic data allows for linking the results with population distribution and indicates the relationships between the network structure and the residential locations of selected population groups. Static analyses present only the spatial reach, without information on the potential number of people who could use the transport service. The high 1-minute temporal resolution used, which is finer than the 15 minutes recommended by Stępniak (2019) and the 10 minutes used by Fayyaz (2017), appears to be the appropriate direction for urban studies where public transport travel times can be short, and the extended analysis time remains within an acceptable range. The model is also highly flexible: parameters such as walking speed, maximum access distance, or transfer penalties can be easily modified, enabling the adaptation of the analysis to different social groups and research scenarios. An extensive literature review of the model’s fundamental parameters and a detailed description of the methodology ensure the transparency and replicability of the research process.
The application of a regular hexagonal grid in accessibility analyses proved useful because it standardises spatial aggregation. Uniform cells eliminate cases where some administrative areas or city blocks are substantially larger or less densely populated than others, which complicates comparison and interpretation of results. Hexagons also improve the legibility of visualisations. It should be emphasised, however, that these benefits depend on selecting a hexagon size appropriate to the built-up density and the scale of the study.
A key methodological characteristic of the proposed workflow is the extension of the analysis window beyond the morning or afternoon transport peak, which has been a common practice in recent years (Krizek et al., 2009; Benenson et al., 2010; Mavoa et al., 2012; Owen and Levinson, 2012, 2015; Goliszek, 2021), a point also noted by (Fayyaz, Liu and Porter, 2017), but considers the entire daily transport activity. According to Liu and Zhu (2004), adding such functionality to the ACCESS program would significantly improve the analyses.
Crucial to the existence of the presented model and similar ones is the widespread and easy access to data in the GTFS format. In Poland, this information is available for only 35% of the country’s area and is concentrated around the largest agglomerations, which complicates analysis in rural areas (Zmuda-Trzebiatowski et al., 2025). The quality and quantity of data are important factors that influence the analysis result. One of the reasons for the highest accessibility indicator in Poznań was the largest number of public transport operators included in the GTFS file, which significantly affected the measurement. However, uneven GTFS and OSM completeness can systematically bias cross-city resilience proxies by overstating robustness where schedule coverage is richer or understating redundancy where services are missing. Future work should quantify and mitigate this bias using data-completeness metrics to produce uncertainty-aware resilience comparisons. The GTFS-RT standard includes real-time data collected from vehicles via GPS transmitters; however, this system is susceptible to data loss (e.g., sensor failure).
Several limitations should be considered when interpreting the results. The most important one concerns the heterogeneity of GTFS data coverage between cities. The number and type of operators included in the GTFS feeds differ from city to city, and the feeds represent planned rather than realised timetables, so they do not capture delays, cancellations or congestion (Fayyaz, Liu and Zhang, 2017). Because richer feeds, covering more operators, mechanically increase the number of reachable services, a city with more complete GTFS data (such as Poznań) may display higher accessibility partly as an artefact of data availability rather than of genuinely superior transport provision. Cross-city comparisons should, therefore, be read as indicative rather than strictly equivalent, and the reported values interpreted as a lower bound conditioned on the available feeds. This is compounded by the limited and uneven national coverage of GTFS in Poland, which is concentrated around the largest agglomerations (Zmuda-Trzebiatowski et al., 2025), and by the staggered acquisition of feeds, which meant that routing dates differed between cities (although all were typical academic-year weekdays).
A significant limitation is the high computational cost of the models (Fayyaz, Liu, and Porter, 2017; Pfertner et al., 2023), a relatively simple solution seems to be transitioning to newer solutions such as the R5 engine (Pereira et al., 2021). However, this would require additional time investment to learn another tool, although it should be noted that this is a promising direction for future research. Another factor contributing to the low popularity of using OTP routing engines is their high entry barrier and problems with processing or creating data in the GTFS format, which constitutes a barrier for spatial planners and urbanists unfamiliar with the IT environment (Wu et al., 2023). Although the OTP used in this work is an effective tool, future, more advanced analyses may rely on the newer R5 engine. As Higgins et al. (2022) have indicated, R5 offers significantly higher computational performance and enables the modelling of complex infrastructure change scenarios in near real-time. Higgins also emphasises the problem of algorithmic dependency, suggesting that the choice of engine (e.g., via the r5r package) is of crucial importance for the precision of statistical accessibility measures.
Limitation of OTP approaches is their dependence on the quality and completeness of OSM data. Incomplete or uneven mapping of pathway networks can distort accessibility metrics. Low-density areas typically exhibit poorer OSM coverage, which may lead to underestimation of actual accessibility. This, in turn, introduces spatial inequities between better-mapped urban zones and more sparsely documented rural areas.
7. Conclusion
The paper presents a reproducible, fully open-source workflow for measuring public transport accessibility with an emphasis on temporal service coverage. The study’s main contribution is methodological and substantive at once: it delivers a transparent, fully reproducible open-data workflow that converts per-minute routing into an intuitive service-time metric, and it demonstrates, across six Polish university cities, that urban form and rail provision are the decisive determinants of who is served continuously throughout the day. The method is time-dependent, with an emphasis on service time, i.e., the cumulative duration of hours throughout the day when public transport is available within a specified travel time threshold. The literature review places the work in the context of the evolution of accessibility research: from classical gravity-based measures and static isochrones, through the development of GIS tools and the GTFS standard, to the growing interest in dynamic modelling. A multitude of approaches for implementing various factors influencing the computational model have been presented, such as walking speed, maximum access distance to a stop, maximum travel time, and acceptable transport service time. Methodologically, the approach integrates GTFS schedules and OSM network with a locally hosted OTP engine, operated via R with otpr package and QGIS/PyQGIS. Analyses employ a 500 m hexagonal grid as the reporting unit, a 6 a.m.–10 p.m. analysis window with per-minute sampling, and a 30-minute door-to-door travel threshold. For each hex cell we count minutes of coverage, a cumulative-duration (active) measure, and classify cells into four service-time categories (constantly, regularly, periodically, episodically accessible); combining these with population data yields a passive (destination-based) accessibility indicator: the student population able to reach each campus.
By focusing on a concrete social group (students) and on service continuity rather than single-moment reach, this study aligns with priority on the social and spatial dimensions of mobility and on transport as a means to influence quality of life. The proposed open workflow offers planners and researchers an actionable metric to diagnose inequities, design targeted interventions, and evaluate how urban form and rail infrastructure select for different travel behaviours and life outcomes.
Applied to six Polish university cities, the method revealed pronounced space–time heterogeneity. Aggregate indicators show notable differences in both coverage and temporal continuity: Poznań exhibited the highest overall coverage (89%) and the largest share of constantly served population (62%), while Gdańsk recorded the lowest aggregate coverage (60%). Kraków displayed substantial episodic service pockets (23%), and the peripherally located 600th Anniversary Campus showed particularly low coverage (37% total, 18% constant). Two empirical patterns recur, central campus locations and presence of rail infrastructure correlate with greater service continuity, and train stations generating ‘accessibility islands’ that can mask poor service in adjacent areas. The obtained findings highlight the value of a space–time metric for diagnosing operational and equity issues which are unclear when static isochrones are used.
The conclusion drawn from the conducted study is the recognition of rail transport as a determining factor in counteracting transport exclusion. It is precisely the stability and high capacity of the tram network and metropolitan rail that guarantee actual, rather than merely nominal, accessibility to academic centres. The study has proven that rail systems are the foundation of modern urban transport, creating durable and predictable spatial links. In this context, bus transport should be perceived as a necessary but merely complementary link in the system, serving to feed passengers to the main rail axes. Effective combating of student transport exclusion thus requires prioritising investment in rail infrastructure and striving to locate key traffic generators within its range of influence, which emerges from the present study as a key determinant of stable transport coverage throughout the daily service window. This study also points to the potential consequences of such exclusion, such as forced motorisation, where students, despite financial constraints, are compelled to use individual transport. This has negative implications for both the environment and social equity. This underscores the urgent need to integrate dynamic accessibility analyses into spatial and transport planning processes to effectively counteract transport exclusion and support sustainable mobility for all social groups, including students.
To sum up, the principal strengths of the conducted study are methodological transparency, fine temporal resolution, and the practical interpretability of the service-time metric for planners. Principal limitations include uneven GTFS coverage (national coverage in Poland is limited and concentrated in large agglomerations), variable OSM path network completeness and a technical entry barrier for non-technical spatial planners. In general, the workflow constitutes a practical, open alternative for embedding temporal analyses into accessibility assessment.
Autorzy
REFERENCES
AITKEN, I. T., PALM, M. and FARBER, S. (2024), ‘Exploring the interplay of transportation, time poverty, and activity participation’, Transportation Research Interdisciplinary Perspectives, 26, p. 101175. https://doi.org/10.1016/j.trip.2024.101175
ALSHALALFAH, B. W. and SHALABY, A. S. (2007), ‘Case Study: Relationship of Walk Access Distance to Transit with Service, Travel, and Personal Characteristics’, Journal of Urban Planning and Development, 133 (2), pp. 114–118. https://doi.org/10.1061/(ASCE)0733-9488(2007)133:2(114)
BARADARAN, S. and RAMJERDI, F. (2001), ‘Performance of Accessibility Measures in Europe’, Journal of Transportation and Statistics, 4 (2–3), pp. 31–48, https://rosap.ntl.bts.gov/view/dot/58460 [accessed on: 02.08.2025].
BENENSON, I., MARTENS, K. and ROFÉ, Y. (2010), ‘Measuring the Gap between Car and Transit Accessibility: Estimating access using a High-Resolution Transit Network Geographic Information System’, Transportation Research Record, 2144 (1), pp. 28–35. https://doi.org/10.3141/2144-04
BIURO INŻYNIERII TRANSPORTU (2019), Plan Zrównoważonego Rozwoju Publicznego Transportu Zbiorowego dla Miasta Poznania na lata 2014-2025, Transport, Poznan.pl, https://www.poznan.pl/mim/komunikacja/-,p,47184,47185.html [accessed on: 10.08.2025].
BOHANNON, R. W. and WILLIAMS ANDREWS, A. (2011), ‘Normal walking speed: a descriptive meta-analysis’, Physiotherapy, 97 (3), pp. 182–189. https://doi.org/10.1016/j.physio.2010.12.004
BOISJOLY, G. and EL-GENEIDY, A. M. (2017), ‘How to get there? A critical assessment of accessibility objectives and indicators in metropolitan transportation plans’, Transport Policy, 55, pp. 38–50. https://doi.org/10.1016/j.tranpol.2016.12.011
BRUINSMA, F. and RIETVELD, P. (1998), ‘The Accessibility of European Cities: Theoretical Framework and Comparison of Approaches’, Environment and Planning A: Economy and Space, 30 (3), pp. 499–521. https://doi.org/10.1068/a300499
BURDZIEJ, J. (2019), ‘Using hexagonal grids and network analysis for spatial accessibility assessment in urban environments - a case study of public amenities in Toruń’, Miscellanea Geographica. Regional Studies on Development, 23 (2), pp. 99–110. https://doi.org/10.2478/mgrsd-2018-0037
CASCETTA, E., CARTENÌ, A. and MONTANINO, M. (2016), ‘A behavioral model of accessibility based on the number of available opportunities’, Journal of Transport Geography, 51, pp. 45–58. https://doi.org/10.1016/j.jtrangeo.2015.11.002
CHIA, J., LEE, J. (Brian) and KAMRUZZAMAN, M. (2016), ‘Walking to public transit: Exploring variations by socioeconomic status’, International Journal of Sustainable Transportation, 10 (9), pp. 805–814. https://doi.org/10.1080/15568318.2016.1156792
CONWAY, M. W., BYRD, A. and EGGERMOND, M. van (2018), ‘Accounting for uncertainty and variation in accessibility metrics for public transport sketch planning’, Journal of Transport and Land Use, 11 (1). https://doi.org/10.5198/jtlu.2018.1074
DE VOS, J., CHENG, L., ZHANG, Y., WANG, K., MEHDIZADEH, M. and CAO, M. (2025), ‘The effect of ease of travel on travel behaviour and perceived accessibility: A focus on travel to university campus’, Transportation Research Part F: Traffic Psychology and Behaviour, 109, pp. 1170–1181. https://doi.org/10.1016/j.trf.2025.01.035
DIEBIG, M., LI, J., FORTHMANN, B., SCHMIDTKE, J., MUTH, T. and ANGERER, P. (2021), ‘A three-wave longitudinal study on the relation between commuting strain and somatic symptoms in university students: exploring the role of learning-family conflicts’, BMC Psychology, 9 (1), p. 199. https://doi.org/10.1186/s40359-021-00702-7
FAN, Y., GUTHRIE, A. and LEVINSON, D. (2012), ‘Impact of light-rail implementation on labor market accessibility: A transportation equity perspective’, Journal of Transport and Land Use, 5 (3), pp. 28–39. https://doi.org/10.5198/jtlu.v5i3.240
FARBER, S., MORANG, M. Z. and WIDENER, M. J. (2014), ‘Temporal variability in transit-based accessibility to supermarkets’, Applied Geography, 53, pp. 149–159. https://doi.org/10.1016/j.apgeog.2014.06.012
FAYYAZ, S. K., LIU, X. C. and PORTER, R. J. (2017), ‘Dynamic transit accessibility and transit gap causality analysis’, Journal of Transport Geography, 59, pp. 27–39. https://doi.org/10.1016/j.jtrangeo.2017.01.006
FAYYAZ, S. K., LIU, X. C. and ZHANG, G. (2017), ‘An efficient General Transit Feed Specification (GTFS) enabled algorithm for dynamic transit accessibility analysis’, PLOS ONE, edited by X. Ma, 12 (10), p. e0185333. https://doi.org/10.1371/journal.pone.0185333
FINN, B., HEDDEBAUT, O., KERKHOF, A., RAMBAUD, F., LOZANO, O. S. and SOULAS, C. (2011), Buses with high level of service: fundamental characteristics and recommendations for decision-making and research results from 35 European cities, Brussels] [Strasbourg: COST European science foundation, https://www.cost.eu/publication/buses-with-high-level-of-service-final-report/
FORD, A. C., BARR, S. L., DAWSON, R. J. and JAMES, P. (2015), ‘Transport Accessibility Analysis Using GIS: Assessing Sustainable Transport in London’, ISPRS International Journal of Geo-Information, 4 (1), pp. 124–149. https://doi.org/10.3390/ijgi4010124
FORTIN, P., MORENCY, C. and TRÉPANIER, M. (2016), ‘Innovative GTFS Data Application for Transit Network Analysis Using a Graph-Oriented Method’, Journal of Public Transportation, 19 (4), pp. 18–37. https://doi.org/10.5038/2375-0901.19.4.2
GEORGE, S., SALOMO, K. and HELBIG, M. (2025), ‘Spatial advantages of highly educated individuals in Germany: Is sustainable mobility an expression of privilege?’, Cities, 156, p. 105507. https://doi.org/10.1016/j.cities.2024.105507
GEURS, K. T. and VAN WEE, B. (2004), ‘Accessibility evaluation of land-use and transport strategies: review and research directions’, Journal of Transport Geography, 12 (2), pp. 127–140. https://doi.org/10.1016/j.jtrangeo.2003.10.005
GIANNOULAKI, M. and CHRISTOFOROU, Z. (2024), ‘Pedestrian Walking Speed Analysis: A Systematic Review’, Sustainability, 16 (11), p. 4813. https://doi.org/10.3390/su16114813
GOLISZEK, S. (2021), ‘GIS tools and programming languages for creating models of public and private transport potential accessibility in Szczecin, Poland’, Journal of Geographical Systems, 23 (1), pp. 115–137. https://doi.org/10.1007/s10109-020-00337-z
HANSEN, W. G. (1959), ‘How Accessibility Shapes Land Use’, Journal of the American Institute of Planners, 25 (2), pp. 73–76. https://doi.org/10.1080/01944365908978307
HAUSCHILDT, K., GWOSC, C., SCHIRMER, H. and WARTENBERGH-CRAS, F. (2021), Social and Economic Conditions of Student Life in Europe: Eurostudent VII 2018-2021, Synopsis of Indicators, Bielefeld: wbv Publikation. https://dx.doi.org/10.3278/6001920dw
HIGGINS, C., PALM, M., DEJOHN, A., XI, L., VAUGHAN, J., FARBER, S., WIDENER, M. and MILLER, E. (2022), ‘Calculating place-based transit accessibility: Methods, tools and algorithmic dependence’, Journal of Transport and Land Use, 15 (1), pp. 95–116. https://doi.org/10.5198/jtlu.2022.2012
INTERNATIONAL TRANSPORT FORUM (2019), ‘Benchmarking Accessibility in Cities: Measuring the Impact of Proximity and Transport Performance’, International Transport Forum Policy Papers, (68). https://doi.org/https://doi.org/10.1787/4b1f722b-en
JÄRV, O., TENKANEN, H., SALONEN, M., AHAS, R. and TOIVONEN, T. (2018), ‘Dynamic cities: Location-based accessibility modelling as a function of time’, Applied Geography, 95, pp. 101–110. https://doi.org/10.1016/j.apgeog.2018.04.009
JAŻDŻEWSKA, I. A., LECHOWSKI, Ł. and BABUCA, D. (2022), ‘GIS-Based Approach for the Analysis of Geographical Education Paths’, ISPRS International Journal of Geo-Information, 11 (1), p. 41. https://doi.org/10.3390/ijgi11010041
KASZCZYSZYN, P. and SYPION-DUTKOWSKA, N. (2019), ‘Walking Access to Public Transportation Stops for City Residents. A Comparison of Methods’, Sustainability, 11 (14), p. 3758. https://doi.org/10.3390/su11143758
KENYON, S. (2011), ‘Transport and social exclusion: access to higher education in the UK policy context’, Journal of Transport Geography, 19 (4), pp. 763–771. https://doi.org/10.1016/j.jtrangeo.2010.09.005
KOBUS, M. B. W., VAN OMMEREN, J. N. and RIETVELD, P. (2015), ‘Student commute time, university presence and academic achievement’, Regional Science and Urban Economics, 52, pp. 129–140. https://doi.org/10.1016/j.regsciurbeco.2015.03.001
KRIZEK, K. J., IACONO, M., EL-GENEIDY, A., LIAO, C. F. and JOHNS, R. (2009), ‘Access to Destinations: Application of Accessibility Measures for Non-Auto Travel Modes’, https://hdl.handle.net/11299/150621 [accessed on: 18.09.2025].
KRYGSMAN, S., DIJST, M. and ARENTZE, T. (2004), ‘Multimodal public transport: an analysis of travel time elements and the interconnectivity ratio’, Transport Policy, 11 (3), pp. 265–275. https://doi.org/10.1016/j.tranpol.2003.12.001
LEE, J. (Brian) and SALIH, S. H. (2024), ‘Passive transit accessibility: Modelling and application for transit gap analysis and station area assessment’, Journal of Transport Geography, 114, p. 103757. https://doi.org/10.1016/j.jtrangeo.2023.103757
LINDNER, A., KÜHNEL, F., SCHRÖMBGES, M. and KUHNIMHOF, T. (2024), ‘When to Measure Accessibility? Temporal Segmentation and Aggregation in Location-Based Public Transit Accessibility’, Urban Science, 8 (4), p. 165. https://doi.org/10.3390/urbansci8040165
LIU, B. (2025), OSM by the Slice, https://slice.openstreetmap.us/ [accessed on: 25.09.2025].
LIU, S. and ZHU, X. (2004), ‘An Integrated GIS Approach to Accessibility Analysis’, Transactions in GIS, 8 (1), pp. 45–62. https://doi.org/10.1111/j.1467-9671.2004.00167.x
MALEKZADEH, A. and CHUNG, E. (2020), ‘A review of transit accessibility models: Challenges in developing transit accessibility models’, International Journal of Sustainable Transportation, 14 (10), pp. 733–748. https://doi.org/10.1080/15568318.2019.1625087
MAVOA, S., WITTEN, K., MCCREANOR, T. and O’SULLIVAN, D. (2012), ‘GIS based destination accessibility via public transit and walking in Auckland, New Zealand’, Journal of Transport Geography, 20 (1), pp. 15–22. https://doi.org/10.1016/j.jtrangeo.2011.10.001
MESBAH, M., CURRIE, G., LENNON, C. and NORTHCOTT, T. (2012), ‘Spatial and temporal visualization of transit operations performance data at a network level’, Journal of Transport Geography, 25, pp. 15–26. https://doi.org/10.1016/j.jtrangeo.2012.07.005
MILLER, E. J. (2018), ‘Accessibility: measurement and application in transportation planning’, Transport Reviews, 38 (5), pp. 551–555. https://doi.org/10.1080/01441647.2018.1492778
MONKIEWICZ, S., UJAZDOWSKI, Z., BRZEZIŃSKI, A., DYBICZ, T., SZAGAŁA, P., WŁODAREK, P., SZYMAŃSKI, Ł., HOCH, J., ŻAKOWSKA, K. and JAŹNICKA, M. (2005), Warszawskie Badanie Ruchu 2005 wraz z opracowaniem modelu ruchu, Warszawa, https://siskom.waw.pl/komunikacja/WBR2005-raport-koncowy.pdf [accessed on: 02.08.2025].
NIEDZIELSKI, M. A., GOLISZEK, S. and GÓRKA, A. (2024), ‘Signals, tracks, and trams: public transport signal priority impact on job accessibility over time’, Scientific Reports, 14 (1), p. 23459. https://doi.org/10.1038/s41598-024-74960-x
OECD (2024), OECD Regions and Cities at a Glance 2024, Paris: OECD Publishing, https://www.oecd.org/en/publications/oecd-regions-and-cities-at-a-glance-2024_f42db3bf-en/full-report.html [accessed on: 09.08.2025].
OLEŚKÓW-SZŁAPKA, J., PAWŁYSZYN, I. and PRZYBYLSKA, J. (2020), ‘Sustainable Urban Mobility in Poznan and Oslo-Actual State and Development Perspectives’, Sustainability, 12 (16), p. 6510. https://doi.org/10.3390/su12166510
O’SULLIVAN, D., MORRISON, A. and SHEARER, J. (2000), ‘Using desktop GIS for the investigation of accessibility by public transport: an isochrone approach’, International Journal of Geographical Information Science, 14 (1), pp. 85–104. https://doi.org/10.1080/136588100240976
OWEN, A. and LEVINSON, D. (2012), ‘Access to Destinations: Annual Accessibility Measure for the Twin Cities Metropolitan Area’, https://hdl.handle.net/11299/181425 [accessed on: 18.09.2025].
OWEN, A. and LEVINSON, D. M. (2015), ‘Modeling the commute mode share of transit using continuous accessibility to jobs’, Transportation Research Part A: Policy and Practice, 74, pp. 110–122. https://doi.org/10.1016/j.tra.2015.02.002
PEREIRA, R. H. M., SARAIVA, M., HERSZENHUT, D., BRAGA, C. K. V. and CONWAY, M. W. (2021), ‘r5r: Rapid Realistic Routing on Multimodal Transport Networks with R5 in R’, Findings. https://doi.org/10.32866/001c.21262
PFERTNER, M., BÜTTNER, B. and WULFHORST, G. (2023), ‘An Open-Source Modelling Methodology for Multimodal and Intermodal Accessibility Analysis of Workplace Locations’, Sustainability, 15 (3), p. 1947. https://doi.org/10.3390/su15031947
PÖNKÄNEN, M., TENKANEN, H. and MLADENOVIĆ, M. (2025), ‘Spatial accessibility and transport inequity in Finland: Open source models and perspectives from planning practice’, Computers, Environment and Urban Systems, 116, p. 102218. https://doi.org/10.1016/j.compenvurbsys.2024.102218
QU, Y., CURRIE, G. and WEBB, G. I. (2025), ‘Spatial resolution impact on public transport accessibility measurement error’, Journal of Transport Geography, 129, p. 104408. https://doi.org/10.1016/j.jtrangeo.2025.104408
ROSIK, P. (2012), Dostępność lądowa przestrzeni Polski w wymiarze europejskim = Surface sibility of the space of Poland in the European dimension, Warszawa: PAN IG i PZ, http://fbc.pionier.net.pl/id/oai:rcin.org.pl:17917.
ROSIK, P., PUŁAWSKA-OBIEDOWSKA, S. and GOLISZEK, S. (2021), ‘Public transport accessibility to upper secondary schools measured by the potential quotient: The case of Kraków’, Moravian Geographical Reports, 29 (1), pp. 15–26. https://doi.org/10.2478/mgr-2021-0002
SHI, Y., BLAINEY, S., SUN, C. and JING, P. (2020), ‘A literature review on accessibility using bibliometric analysis techniques’, Journal of Transport Geography, 87, p. 102810. https://doi.org/10.1016/j.jtrangeo.2020.102810
SHOMAN, W., ALGANCI, U. and DEMIREL, H. (2019), ‘A comparative analysis of gridding systems for point-based land cover/use analysis’, Geocarto International, 34 (8), pp. 867–886. https://doi.org/10.1080/10106049.2018.1450449
SOLDATKE, N., SYDORÓW, M. and ŻUKOWSKA, S. (2024), ‘Assessment of the accessibility of public transport in the Tricity (Poland): analytical use of geographical information systems (GIS) in the context of selected public transport measures’, International Journal of Digital Earth, 17 (1), p. 2344586. https://doi.org/10.1080/17538947.2024.2344586
STARIKOVA, A. V. (2019), ‘Spatial Behavior Of Students And Their Role In Polarized Development: Comparative Studies Of Yaroslavl Oblast And Bavaria’, GEOGRAPHY, ENVIRONMENT, SUSTAINABILITY, 12 (2), pp. 18–28. https://doi.org/10.24057/2071-9388-2019-49
STATISTICS POLAND (2024a), Ludność w rejonach statystycznych i obwodach spisowych według płci, ekonomicznych i 10-letnich grup wieku; Population in statistical areas and census tracts by sex, economic and 10-year age groups, stat.gov.pl, https://stat.gov.pl/spisy-powszechne/nsp-2021/nsp-2021-wyniki-ostateczne/ludnosc-w-rejonach-statystycznych-i-obwodach-spisowych-wedlug-plci-ekonomicznych-i-10-letnich-grup-wieku,12,1.html [accessed on: 14.09.2025].
STATISTICS POLAND (2024b), Szkolnictwo wyższe w roku akademickim 2023/2024; Higher education in the 2023/24 academic year – preliminary data, stat.gov.pl, https://stat.gov.pl/en/topics/education/education/higher-education-in-the-202324-academic-year-preliminary-data,10,10.html [accessed on: 02.09.2025].
STĘPNIAK, M. and GOLISZEK, S. (2017), ‘Spatio-Temporal Variation of Accessibility by Public Transport—The Equity Perspective’, [in:] IVAN, I., SINGLETON, A., HORÁK, J. and INSPEKTOR, T. (eds), The Rise of Big Spatial Data, Cham: Springer International Publishing, pp. 241–261. https://doi.org/10.1007/978-3-319-45123-7_18
STĘPNIAK, M., PRITCHARD, J. P., GEURS, K. T. and GOLISZEK, S. (2019), ‘The impact of temporal resolution on public transport accessibility measurement: Review and case study in Poland’, Journal of Transport Geography, 75, pp. 8–24. https://doi.org/10.1016/j.jtrangeo.2019.01.007
TENNØY, A., KNAPSKOG, M. and WOLDAY, F. (2022), ‘Walking distances to public transport in smaller and larger Norwegian cities’, Transportation Research Part D: Transport and Environment, 103, p. 103169. https://doi.org/10.1016/j.trd.2022.103169
TRANSPORTATION RESEARCH BOARD and NATIONAL ACADEMIES OF SCIENCES, EnGINEERING, AND MEDICINE (2013), Transit Capacity and Quality of Service Manual, Third Edition, Washington, DC: The National Academies Press. https://doi.org/10.17226/24766
VALE, D. and LOPES, A. S. (2023), ‘Accessibility inequality across Europe: a comparison of 15-minute pedestrian accessibility in cities with 100,000 or more inhabitants’, npj Urban Sustainability, 3 (1), p. 55. https://doi.org/10.1038/s42949-023-00133-w
VAN SOEST, D., TIGHT, M. R. and ROGERS, C. D. F. (2020), ‘Exploring the distances people walk to access public transport’, Transport Reviews, 40 (2), pp. 160–182. https://doi.org/10.1080/01441647.2019.1575491
VAN DER VLUGT, A.-L., CURL, A. and SCHEINER, J. (2022), ‘The influence of travel attitudes on perceived walking accessibility and walking behaviour’, Travel Behaviour and Society, 27, pp. 47–56. https://doi.org/10.1016/j.tbs.2021.11.002
WACHS, M. and KUMAGAI, T. G. (1973), ‘Physical accessibility as a social indicator’, Socio-Economic Planning Sciences, 7 (5), pp. 437–456. https://doi.org/10.1016/0038-0121(73)90041-4
WILLBERG, E., FINK, C. and TOIVONEN, T. (2023), ‘The 15-minute city for all? – Measuring individual and temporal variations in walking accessibility’, Journal of Transport Geography, 106, p. 103521. https://doi.org/10.1016/j.jtrangeo.2022.103521
WONG, D. (2009), ‘The Modifiable Areal Unit Problem (MAUP)’, [in:] FOTHERINGHAM, A. S. and ROGERSON, P. A. (eds), Sage Research Methods - The SAGE Handbook of Spatial Analysis, SAGE Publications, Ltd, pp. 105–123, https://methods.sagepub.com/hnbk/edvol/the-sage-handbook-of-spatial-analysis/chpt/modifiable-areal-unit-problem-maup [accessed on: 21.09.2025].
WU, B. M. and HINE, J. P. (2003), ‘A PTAL approach to measuring changes in bus service accessibility’, Transport Policy, 10 (4), pp. 307–320. https://doi.org/10.1016/S0967-070X(03)00053-2
WU, J., DU, B., GONG, Z., WU, Q., SHEN, J., ZHOU, L. and CAI, C. (2023), ‘A GTFS data acquisition and processing framework and its application to train delay prediction’, International Journal of Transportation Science and Technology, 12 (1), pp. 201–216. https://doi.org/10.1016/j.ijtst.2022.01.005
YOUNG, M. (2021), OpenTripPlanner - creating and querying your own multi-modal route planner, https://github.com/marcusyoung/otp-tutorial [accessed on: 24.08.2025].
YOUNG, M. (2022), otpr: OpenTripPlanner REST API wrapper for R, https://github.com/marcusyoung/otpr [accessed on: 24.08.2025].
ZMUDA-TRZEBIATOWSKI, P., BAR, K. and BIEŃCZAK, M. (2025), ‘Coverage of digital public transport information in Poland’, Journal of Civil Engineering and Transport, 2025 (7), pp. 19–34. https://doi.org/10.24136/tren.2025.002