
EU Cohesion Policy and regional club clustering: A comparative analysis of NUTS2 regions in Europe
Peter LEŠKO  *
*
Eva MUCHOVÁ *
Radka LEŠKOVÁ *
Abstract. This paper assesses territorial cohesion in the EU by examining whether 242 NUTS2 regions converge to a common steady state or form distinct convergence clubs. Using regional GDP per capita data for 2000–2022 and EU Cohesion Policy payments per capita for 2000–2020, we estimate absolute and conditional β-convergence models and apply k-means clustering based on initial income, growth performance, and funding intensity. The results indicate aggregate convergence, but a strongly uneven spatial pattern: regions group into three convergence clubs with different development trajectories. While some initially poorer regions exhibit strong catching-up, other clusters show weak or very slow convergence despite substantial funding. These findings support the Club Convergence hypothesis and underline the need for more place-based cohesion interventions tailored to regional structural conditions.
Key words: EU, territorial cohesion, club clustering, EU NUTS2 region.
1. Introduction
Territorial cohesion is a fundamental concept within the Cohesion Policy, implemented through structural and investment funds. During the 2014–2020 programming period, over 400 billion € was allocated, and a further 392 billion € is earmarked for 2021–2027. When national co-financing is included, the total financial envelope reaches nearly half a trillion euros (Cohesion Open Data Platform, 2024). Cohesion Policy accounts for roughly one-third of the total EU budget, with EU funds representing up to 13% of total public investment across the EU and more than 50% in less developed Member States (Ninth Cohesion Report, 2024). Since 2014, the European Commission introduced the Smart Specialisation (S3) concept as an ex-ante conditionality for accessing EU funds has marked a shift toward a more place-based, innovation-oriented regional development paradigm. The S3 framework rests on principles of entrepreneurial discovery, regional prioritisation, and bottom-up governance (Foray et al., 2011) and has since become a cornerstone of EU innovation policy.
Despite these efforts, significant inequalities persist, particularly between core and peripheral regions, metropolitan and rural territories, and more and less developed Member States. The evidence from the Cohesion Report (2024) suggests that while Cohesion Policy has played a key role in supporting growth and investment, especially in areas aligned with the green and digital transitions, the overall process of convergence remains uneven and subject to structural and spatial heterogeneity.
Although regional convergence has been extensively examined in the empirical literature, most studies focus on national or highly aggregated regional levels, often relying on average convergence measures. As highlighted in previous research (Bartkowska and Riedl, 2009; Artelaris et al., 2010; Crescenzi and Giua, 2020), such approaches may mask substantial within-country disparities and overlook heterogeneous regional development paths, particularly at the NUTS2 level, which is the primary territorial unit for the design and implementation of EU Cohesion Policy.
The objective of this study is to examine regional convergence patterns across EU NUTS2 regions by identifying potential convergence clubs and assessing how structural characteristics and spatial typologies shape heterogeneous development trajectories. By doing so, the paper aims to provide an empirically grounded interpretation of territorial cohesion and to contribute to the evaluation of EU Cohesion Policy in the context of persistent regional disparities. To achieve this objective, the study addresses the following research questions: (i) whether EU NUTS2 regions converge towards a single steady state or instead form convergence clubs; (ii) how structural characteristics influence the formation and dynamics of these regional convergence clubs; and (iii) what the observed convergence patterns imply for territorial cohesion and the effectiveness of future EU Cohesion Policy.
Methodologically, the analysis applies a club convergence framework at the NUTS2 level and compares the resulting convergence clubs with the official EU classification of regions. By confronting the outcomes of the applied cluster analysis with the existing EU regional categorisation, the study aims to assess the extent to which empirically identified convergence patterns correspond to the current policy-based regional typologies. This comparison provides an additional layer of insight into the adequacy of the official regional classification for capturing underlying development dynamics.
This perspective challenges the traditional assumption of unconditional convergence and emphasises the role of structural and spatial heterogeneity in shaping development trajectories. The advantage of this approach lies in its ability to identify groups of regions that follow similar development trajectories despite operating within the same institutional framework. By uncovering latent convergence patterns at the NUTS2 level, the analysis provides more policy-relevant insights into persistent regional disparities and allows for a more nuanced understanding of how structural conditions and spatial context influence convergence outcomes. Our findings may offer new perspectives on the regional classification for the distribution of EU resources and contribute to the understanding of the role of the post-2027 EU Cohesion Policy framework.
The paper is structured into four main sections, along with an introduction and a conclusion. Section 2 outlines the theoretical background and reviews recent literature addressing regional convergence and EU Cohesion Policy. Section 3 describes the methodology and data used in the empirical analysis. Section 4 presents the empirical findings, while Section 5 discusses patterns of convergence and regional clustering and their policy relevance. The final section offers policy recommendations and reflections on the future of EU territorial cohesion.
2. Literature review
Territorial cohesion has been included for the first time in the Lisbon Treaty. Article 174 of the Treaty on the Functioning of the EU defines the strengthening of economic, social, and territorial cohesion as a prerequisite for harmonious development, with a particular focus on reducing disparities between regions, especially the least developed ones (European Commission, 2024). This vision is further elaborated in the Territorial Agenda 2030, which emphasizes inclusive and sustainable development, spatial justice, functional regions, and place-sensitive, multi-level governance. In this context, territorial cohesion explicitly integrates the spatial dimension into EU development policy and recognises regional diversity as a key asset.
Numerous studies have examined the impact of EU Cohesion Policy on regional development, often highlighting positive but uneven effects. The Ninth Cohesion Report (2024) estimates that GDP in several less developed regions could be 10-13% higher by 2030 due to Cohesion Policy interventions. Fiaschi et al. (2017) have provided evidence of a significant positive impact of EU funds on regional economic growth, particularly in poorer regions, with notable spatial spillover effects. However, as emphasised by Hager and Mohl (2011), empirical findings on growth and convergence effects remain mixed. Recent evidence suggests that short-term fiscal multipliers of EU-funded investments are generally below one (World Bank, 2024), and that funding intensity alone does not necessarily translate into stronger economic or political outcomes without appropriate timing and governance (López-Bazo, 2022).
Recent empirical research consistently shows that the impacts of EU Cohesion Policy vary significantly across territories. Crescenzi and Giua (2020) have demonstrated that the growth effects of EU funds differ substantially across Member States and tend to materialise only over time, highlighting the delayed nature of returns on structural investments. At the regional level, Bachtrögler et al. (2020) have emphasized the importance of local context, showing that EU support is more strongly associated with gains in employment and value added than with productivity, particularly in less developed regions with weaker territorial assets. Taken together, these findings underscore the need for a place-based and territorially sensitive approach to EU Cohesion Policy.
While territorial cohesion occupies a central place in EU policy, its conceptual ambiguity and analytical complexity continue to pose a challenge for empirical research. As noted by Medeiros (2016), there is no universally accepted definition of territorial cohesion, and interpretations vary significantly across policy, academic, and geographic contexts. Nonetheless, four key dimensions are typically emphasised in the literature: reducing socioeconomic imbalances; promoting environmental sustainability; improving the territorial cooperation/governance processes and establishing a more polycentric urban system.
In this study, territorial cohesion is understood as the extent to which regional development paths across EU territories become more balanced over time, taking structural and spatial differences into account. Territorial cohesion is examined through regional convergence patterns at the NUTS2 level, where the identification of convergence clubs reflects persistent territorial heterogeneity. By linking these convergence patterns to structural characteristics and spatial typologies, the concept is used as an analytical tool rather than only as a rhetorical framework.
Regional convergence can be assessed through various methodological approaches. In the economic literature, income convergence is typically categorized into two main concepts: unconditional (Solow, 1956) and conditional β-convergence (Barro and Sala-i-Martin, 1991). Building on the concept of conditional convergence, the club convergence hypothesis extends the analysis by allowing for the existence of distinct groups of economies that converge towards different steady states. Regions with similar structural characteristics and initial conditions are expected to follow comparable development paths, forming the so-called convergence clubs. While the distinction between conditional and club convergence can be empirically challenging, a growing body of literature has provided evidence of club convergence among EU regions (Bartkowska and Riedl, 2009; Artelaris et al., 2010; Cavallaro and Villani, 2021; Harb et al., 2024; Solanes et al., 2024).
Empirical studies have identified heterogeneous convergence patterns at the regional level, indicating that EU regions do not converge uniformly but rather cluster into groups with distinct growth trajectories shaped by structural and institutional factors. For instance, Bartkowska and Riedl (2009) found no evidence of overall income convergence among EU NUTS2 regions over the period 1990–2005; instead, they identified five distinct convergence clubs, each characterised by a different steady-state income path. Their results highlight the strong role of geography, as regions within the same country and capital city areas tend to cluster together. This spatial concentration is attributed to agglomeration effects and knowledge spillovers, providing empirical support for the club convergence hypothesis and underscoring the importance of initial conditions in shaping long-run income disparities in Europe.
Further empirical evidence is provided by Artelaris et al. (2010), who show that convergence processes in Europe tend to occur within groups of regions sharing similar structural characteristics, levels of development, and initial conditions, rather than uniformly across all regions. Their findings also point to mixed outcomes of EU Cohesion Policy: while EU funding has supported growth in some lagging regions, it has not been sufficient to eliminate persistent structural disparities. The authors, therefore, have emphasised the need for more targeted and region-specific policy interventions.
Convergence clubs have also been examined within the Eurozone, as shown by Solanes, Beyaert and Lopez-Gomez (2024), who analysed income convergence among Eurozone countries over the period 1995–2021 using Phillips–Sul club convergence tests. Their results reject overall convergence in GDP per capita across the Eurozone and instead identify three distinct convergence clubs with persistent disparities both between and within these groups, challenging the traditional core–periphery division commonly assumed in the literature. The study further shows that differences in long-run income levels across these clubs are largely driven by structural growth determinants – such as labour productivity, physical and human capital, investment and international trade – indicating that structural heterogeneity significantly shapes divergent development paths within the Eurozone.
More recent studies have examined the determinants and composition of convergence clubs in greater detail. Cavallaro and Villani (2021) have demonstrated that club membership is strongly influenced by factors such as initial income levels, human capital endowment, economic structure, and geographic proximity, using a combination of econometric and clustering techniques. Similarly, Harb et al. (2024) have provided robust evidence of club convergence in total factor productivity across EU NUTS regions, revealing a clear spatial pattern in which high-performing regions are predominantly located in northern and western Europe, while low-performing regions are concentrated in southern Europe. Their results also highlight a ‘productivity trap’ affecting several Greek and Italian regions, in contrast to strong productivity gains observed in some regions of newer EU Member States, such as Poland, which have been narrowing the gap with the EU average.
3. Data and methodology
This section provides a detailed description of the data sources, variables selected for quantitative analysis, and the statistical techniques employed to ensure reliable research results. The study uses the latest cross-sectional data at the regional NUTS2 level for the year 2022. The choice of 2022 as the reference year is based on the availability of sufficiently complete and comparable regional data at the NUTS2 level across EU Member States. Moreover, 2022 represents the most recent year with consistent reporting of key indicators and reflects a partial stabilisation of regional dynamics following the disruptions caused by the COVID-19 pandemic.
Given the pronounced volatility observed in many economic and social indicators during the 2020–2021 period, the use of 2022 data has helped to limit potential distortions associated with short-term pandemic shocks, while still capturing their medium-term territorial implications. Nevertheless, we explicitly acknowledge that some residual COVID-19 effects may persist in selected variables, and this limitation is considered when interpreting the empirical results.
The data were obtained from the European Commission, particularly the Cohesion Open Data Platform, Eurostat, and EDGAR, complemented by the authors’ own calculations. Missing data at the regional level were limited and were handled using standard data-cleaning procedures to preserve the internal consistency of the dataset, ensuring that only regions with sufficient data coverage were included in the final analysis.
3.1. Territorial units and data description
In the European Union, territorial typologies are primarily defined by administrative boundaries. To reference countries’ regions for statistical purposes, the EU has developed a classification known as Nomenclature of territorial units for statistics (NUTS). This methodology categorises each EU country into three levels: NUTS1, which represent major socio-economic regions; NUTS2, which are the basic regions used for regional policies; and NUTS3, which are smaller, more localised regions (Eurostat, 2024).
According to Article 108 of Regulation (EU) 2021/1060 of the European Parliament and of the Council, EU resources shall be allocated among the following three categories of NUTS level 2 regions: less developed regions, whose GDP per capita is less than 75% of the average GDP per capita of the EU27; transition regions, whose GDP per capita is between 75% and 100% of the average GDP per capita of the EU27; and more developed regions, whose GDP per capita is above 100% of the average GDP per capita of the EU27.
| Type of regions | Absolute frequency | Relative frequency [%] | GDP per capita in PPS (2022) [€] |
|---|---|---|---|
| Less developed regions | 83 | 34.30 | 21,807 |
| Transition regions | 69 | 28.51 | 30,928 |
| More developed regions | 90 | 37.19 | 46,692 |
| EU27 | 242 | 100.0 | 35,400 |
Note: Regulation (EU) 2021/1060 of the European Parliament and of the Council, which governs the distribution of EU resources based on the three categories of NUTS2 regions.
Sources: Eurostat and own work.
Table 1 provides an overview of the categorisation of EU regions at NUTS 2 level based on their GDP per capita, relative to the EU27 average in 2022. The dataset covers 242 regions, grouped into three categories: 83 less developed regions (34.30% of the sample) with an average GDP per capita of 21,807 €; 69 transition regions (28.51%) averaging 30,928 €; and 90 more developed regions (37.19%) with a GDP per capita of 46,692 €, approximately double that of the less developed group. For reference, the EU27 average GDP per capita was 35,400 €.
| Variable | Unit of measure | Obser. | Mean | Standard deviation | Min. | Max. |
|---|---|---|---|---|---|---|
| GDP per capita, 2022 | PPS | 242 | 33,662.40 | 13,257.28 | 10,600 | 101,200 |
| GDP per capita, 2000 | PPS | 242 | 17,701.65 | 7,905.04 | 3,400 | 51,400 |
| EU Payments per capita (period 2000-2020) | EUR/capita | 241 | 2634.28 | 2494.91 | 171.86 | 18,419.68 |
| Real Labour Productivity per person | index, 2015=100 | 223 | 105.85 | 13.27 | 18.9 | 162.4 |
| Employment Rate | % | 242 | 69.91 | 8.61 | 32.2 | 84.6 |
| Educational Level (share of higher education) | % | 242 | 33.15 | 10.35 | 13.7 | 62.1 |
| Gross Fixed Capital Formation | % of GDP | 242 | 21.96 | 4.71 | 9.44 | 44.56 |
| GHG Emissions per capita | ton/capita | 237 | 8.527 | 4.825 | 1.435 | 37.432 |
Note: PPS – Purchasing Power Standard, GHG Emissions – Greenhouse Gas Emissions.
Sources: European Commission, Eurostat, Edgar.
Table 2 shows the summary statistics for selected economic and social indicators measured across NUTS2 regions. The variables include GDP per capita in 2022 and 2000 (measuring in PPS); EU payments per capita covering the period 2000-2020; real labour productivity per person; employment rate (of the age group 15-64); share of the population with higher education (tertiary educational attainment, age group 25-64); gross fixed capital formation and greenhouse gas (GHG) emissions per capita. The descriptive statistics underline the substantial variation across NUTS2 regions, with GDP per capita in 2022 ranging from 10,600 € to 101,200 €, and EU sources reported per capita varying between 171 € and 18,419 €. Such variation is crucial for empirical analysis, as it illustrates the heterogeneity in economic performance.
3.2. Model specification with complementary indicators
The literature on the convergence of income levels (e.g., GDP per capita) distinguishes between unconditional and conditional convergence. The long-run convergence occurs when countries with lower income levels grow faster than countries with higher income levels (Mankiw, 2022). In such cases, we refer to absolute convergence, which reflects the relationship between economic growth and the level of GDP per capita.
Unconditional (absolute) β-convergence can be tested using the following specification:
where yi,t denotes real GDP per capita of region i at time t; yi,0 is the initial real GDP per capita of region i; ß0 represents the steady-state constant; ß1 is the convergence coefficient, which is expected to be negative if convergence is present; and εi is the error term.
Conditional β-convergence extends the baseline model by incorporating additional control variables that capture structural differences among regions (Barro and Sala-i-Martin, 1991).
The extended model can be specified as:
where ∆ln(yi) represents the growth rate of GDP per capita for region i over the selected period; Xik denotes the k structural (control) variables for region i influencing growth, γk are their corresponding coefficients; Dij are dummy variables capturing categorical effects (typology of regions according to the Commission, etc.) with δj as their coefficients and εi is the error term.
In this study, the speed of convergence and the half-life of convergence are applied as complementary indicators that quantify the process of income equalization across EU regions.
The speed of convergence (λ) is derived from the estimated regression coefficient. Following the standard formulation, the relationship is expressed as:
(3)
where T denotes the number of years between the initial and final periods and ß is the estimated coefficient from the regression of income growth on the initial income level.
The half-life of convergence (T1/2) measures the number of years required for income disparities between regions to be reduced by one-half. It is calculated as:
(4)
where λ characterises the dynamics of the convergence process in the region.
In addition to the convergence regressions, the study applies clustering analysis to uncover potential convergence patterns among EU regions with respect to their economic performance. The clustering technique was implemented using the k-means clustering procedure, which partitions the sample into a predefined number of groups by minimizing within-cluster variance while maximising between-cluster differences. The choice of three clusters was supported both by statistical criteria (elbow method and silhouette analysis) and by economic reasoning, ensuring interpretability of the results. K-means clustering is appropriate for this type of analysis, as it allows EU regions to be classified based on multiple dimensions simultaneously. In our case, the initial level of GDP per capita, the volume of EU payments per capita and the subsequent growth performance over the period 2000–2022. Empirical literature confirms that this approach enables a more precise assessment of regional heterogeneity.
3.3. Limitations
Several methodological limitations should be acknowledged. First, the analysis does not explicitly model spatial interdependencies among NUTS2 regions. Regional growth, labour market outcomes, and human capital formation may exhibit spatial dependence, and developments in one region can affect neighbouring territories through migration and commuting flows, trade linkages, and knowledge diffusion. As a result, part of the observed convergence dynamics may reflect spillover mechanisms that are not directly captured in the empirical specification.
Second, the study does not employ spatial econometric techniques, such as models accounting for spatial autocorrelation or spatial lag structures. Incorporating such approaches could improve the robustness of the estimates in a regional setting by explicitly modelling geographic dependence in growth processes. While the current framework identifies heterogeneous convergence patterns through β-convergence regressions and k-means clustering, future research could complement this approach with spatial econometric methods to strengthen the spatial dimension of the analysis and provide a more comprehensive assessment of EU convergence dynamics.
4. Empirical findings
4.1. The Role of EU Cohesion Policy in reducing disparities
The standard of living in the EU regions at the NUTS2 level is diverse. These inequalities are primarily related to the distribution of income and wealth, which depends on the economic and social structure of the region. Although regional disparities are a natural phenomenon, their widening can have a negative impact on the future development of the economy.
The catch-up of living standards is assessed by comparing regional GDP per capita levels to the EU27 average. Therefore, GDP per capita has been established as the primary indicator for the allocation of EU financial resources (Regulation 2021/1060 of the EP and of the Council). Figure 1 illustrates the regional inequalities among EU regions at the NUTS2 level in 2022, where individual regions are compared with the EU27 average, which is set at a value of 100.
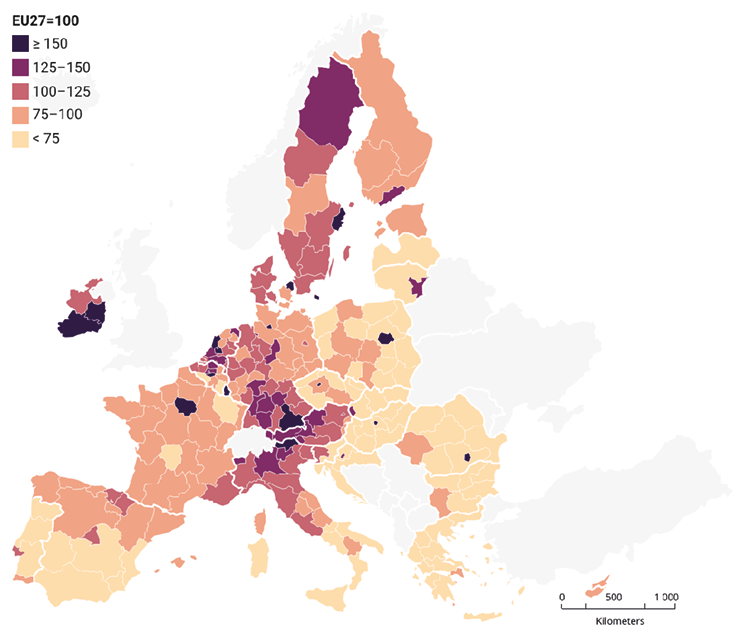
Source: Eurostat.
In 2022, 148 of the observed 242 regions achieved a level of GDP per capita below the EU27 average. Put differently, more than two-thirds of EU regions at the NUTS2 level (61.2%) have a significantly lower standard of living than the European average.
The least developed regions are located in Southern Europe and Central and Eastern Europe. These are mainly regions of the new Member States that are characterised by relatively low GDP per capita or slower economic growth. The mentioned regions are situated in Spain, Italy, and Greece, as well as regions in Romania, Bulgaria, and the newer EU Member States.
Our analysis further indicates that 94 regions, representing 38.8%, report a standard of living that is equal to or above the EU27 average. The most developed regions are located in the area from northern Italy through Austria to Germany. We also include several regions in the Benelux countries, southern Ireland and Scandinavia. According to 2022 data, the southern region of Ireland emerges as the clear leader, where the standard of living reaches 186% of the EU27 average. Unsurprisingly, metropolitan regions also rank highly, reflecting the strong concentration of economic activity and income in urban centres.
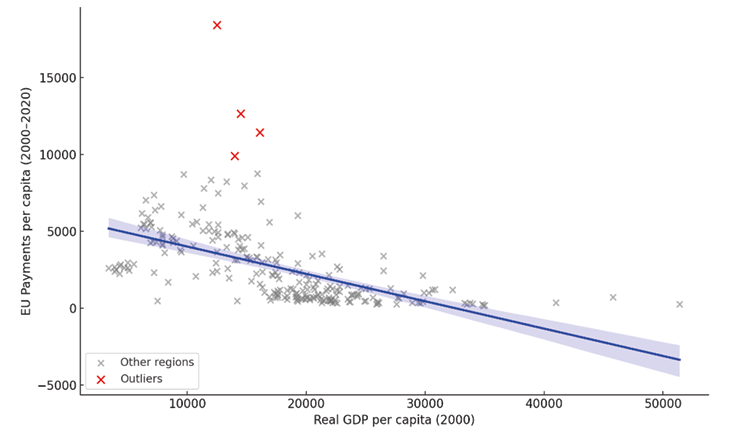
Source: European Commission, Eurostat, own calculations.
Source: European Commission, Eurostat, own calculations.
Figure 2 above illustrates the relationship between real GDP per capita in 2000 and EU payments per capita from 2000 to 2020. A negative linear trend is evident - regions with lower initial GDP per capita tended to receive higher EU funding. This pattern is statistically supported by a Pearson correlation coefficient of -0.561 (p<0.000) and a Spearman rank correlation of -0.751 (p<0.000). We can see a strong inverse relationship, confirming that the EU financial support was targeted primarily at less developed regions. We also observed several extreme outlier regions: Autónoma dos Açores, Alentejo, Ciudad de Ceuta and Região Autónoma da Madeira, which significantly exceeded typical funding levels.
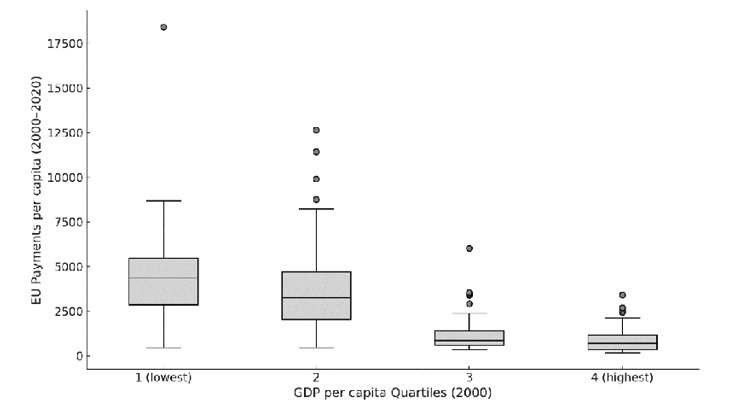
Furthermore, figure 3 shows the distribution of EU payments per capita from 2000 to 2020 across regions grouped by GDP per capita quartiles as of 2000. The less developed NUTS2 regions received the highest financial support, with a median payment of around 670 € per capita and several regions exceeding 900 €. These evidences underscore the strong orientation of EU cohesion policy towards promoting development in economically weaker regions.
4.2. Convergence process in the European NUTS2 regions
Territorial cohesion and economic convergence are central objectives of EU regional policy, making it essential to examine whether disparities between regions have narrowed over time. The following section presents the empirical findings concerning the convergence process across European NUTS2 regions. Table 3 summarises the estimation results for the period 2000–2022, calculated using the equations outlined above, specifically Equations (1) and (2).
| Variable | Model 1 Absolute convergence (OLS method) |
Model 2 Conditional convergence (White-robust SE) |
Model 3 Conditional convergence (2SLS method) |
|---|---|---|---|
| const | 5.067*** (17.29) | 3.366*** (5.60) | 9.957*** (4.28) |
| ln(GDPpc,2000) | -0.453*** (-15.07) | -0.552*** (-14.92) | -0.886*** (-6.98) |
| ln(EU_Payi) | - | -0.039** (-2.57) | -0.316*** (-3.36) |
| ln(EMPLi) | - | 0.706*** (8.77) | 0.392** (2.25) |
| Metropolitan (dummy) | - | 0.288*** (6.67) | 0.333*** (5.02) |
| Eurozone (dummy) | - | -0.092*** (-3.27) | -0.066 (-1.25) |
| R2 | 0.525 | 0.754 | 0.369 |
| Adjusted R2 | 0.523 | 0.749 | - |
| Obs. | 242 | 242 | 242 |
| DWH test | - | - | 0.000 |
| First-stage F-stat | - | - | 14.7 (p=0.000) |
| λ (95% CI) | 0.023-0.032 | 0.029-0.044 | 0.046-0.079 |
| T1/2 (95% CI) | 21.1-29.5 | 15.1-22.8 | 7.9-15.02 |
Note: ln(GDPpc,2000) - Real GDP per capita (in PPS) in 2000; ln(EU_Payi) - EU Payments for NUTS2 regions covering 2000-2020; ln(EMPLi) - Employment rate of the age group 15-64; Metropolitan - Dummy variable for metropolitan regions; Eurozone - Dummy variable for regions located in the eurozone; R2 - Coefficient of determinations; Obs. - Number of observations; DWH test - Durbin-Wu-Hausman test; λ - Speed of convergence; T1/2 - Half-life of convergence; CI - Confidence interval. EU Payments are treated as endogenous and instrumented using Less developed dummies (see Model 3). ***,**,* denote significance at 1%, 5% and 10% level, respectively.
Source: European Commission, Eurostat, own calculations.
We estimate the baseline absolute convergence model using ordinary least squares (OLS) method. To account for potential heteroskedasticity, we compute heteroskedasticity-robust standard errors following White (1980). This approach ensures consistent inference even when the assumption of homoscedastic residuals is violated. The regression results (Model 1) provide clear evidence of unconditional convergence among European NUTS2 regions over the last twenty years. The convergence coefficient is -0.453, statistically significant at the highest probability level. This implies that regions with lower initial GDP per capita tend to experience faster economic growth, consistent with the neoclassical convergence hypothesis. Based on the estimates, the speed of convergence is approximately 2.7% per year, with the corresponding half-life of convergence - the time required for half of the initial income gap to close - ranging between 21.1 and 29.5 years.
Model 2 reports the estimated result for conditional convergence. In this specification, additional explanatory variables were included beyond the initial GDP per capita, principally EU payments for NUTS2 regions covering 2000-2020. EU financial support is being considered because it represents a policy instrument aimed at fostering regional development, as well as reducing disparities. The convergence coefficient (-0.552) remains statistically significant and confirms the catching-up effect. In terms of structural drivers, the coefficient on EU payments is also negative and significant (-0.039), indicating that higher absorption of EU funds is correlated with weaker growth performance. The conditional convergence rate is estimated at 3.7% per year and a half-life of just under 23 years.
A closer look at the typology of regions reveals additional insights. Membership in the Eurozone is associated with slower growth (coefficient is -0.092), which may reflect structural constraints inherent to the monetary union. Conversely, the coefficient of 0.288 (statistically significant) indicates that being classified as a metropolitan region has a strong and positive impact on development. Specifically, metropolitan regions, on average, experience a 0.29% increase the GDP per capita compared to non-metropolitan regions, assuming all other factors remain constant. According to the OECD, most European metropolitan regions achieve comparative advantage through agglomeration effects, which arise due to the concentration of economic activities and resources. The OECD underscores that these metropolitan regions will face major challenges to their success, including adverse impacts of climate change, housing affordability or public services. The need is therefore highlighted not only to reduce the differences between developed and less developed regions, but also the need for targeted territorial policies within large regions to manage their future development (OECD, 2023).
The coefficient estimate for EU payments must be interpreted with caution, as EU transfers are disproportionately directed to less developed NUTS2 regions, and the observed negative association likely reflects this endogeneity rather than a true adverse effect of cohesion policy. To address potential endogeneity of EU funds, we performed a Durbin–Wu–Hausman (DWH) test using the less developed regions dummy as an instrument for EU payments. The first-stage regression confirmed instrument relevance (F≈14.7). Based on the DWH test with a p-value below 0.001, the null hypothesis of exogeneity of EU payments is rejected, providing strong justification for preferring Model 3 (2SLS method) over the OLS estimates. The 2SLS results indicate a substantially stronger negative coefficient -0.316, consistent with the hypothesis that EU payments are disproportionately allocated to structurally weaker regions, thereby biasing OLS estimates downward. In this case, the speed of convergence is around 6.2% per year, with the corresponding half-life of convergence varying between 7.9 and 15.02 years.
4.3. Exploring Convergence Clubs across NUTS2 regions
Largely driven by the significant disparities among NUTS regions, club convergence testing has gained popularity recently. Empirical support for the existence of club-clustering in Europe has been documented in several studies already stated, including Harb et al. (2024), Cavallaro and Villani (2021), Artelaris et al. (2010), Bartkowska and Riedl (2009), and others.
This analysis aims to extend to this research by examining income convergence specifically through the Convergence Club formation. The identified convergence patterns are subsequently compared with the classification of regions established by the Article 108 of Regulation (EU) 2021/1060 of the European Parliament and of the Council, allowing for an assessment of the consistency between our empirical findings and policy-based regional groupings.
| Variable | Cluster A Convergence Club 1 |
Cluster B Convergence Club 2 |
Cluster C Convergence Club 3 |
|---|---|---|---|
| Number of regions | 79 | 115 | 48 |
| Initial GDP level | 15,525 € | 23,597 € | 7,158 € |
| Average GDP growth by cluster | 58.8% | 53.8% | 123.6% |
| EU payments | 4,397 € | 782 € | 4,203 € |
| Convergence progress | weak | very slow | strong |
Source: own work.
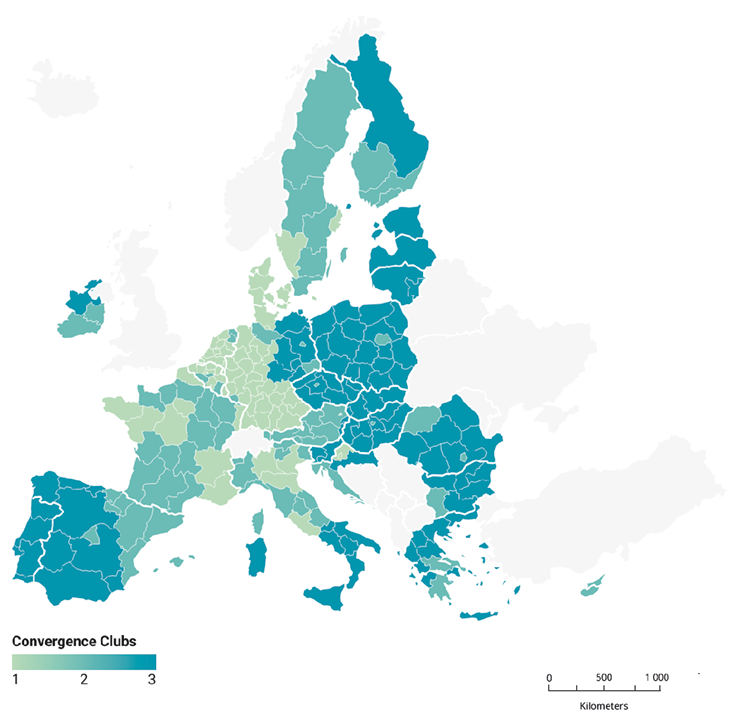
Source: own work.
Table 4 and Figure 4 present the results of the Convergence Club analysis at the NUTS2 level, dividing EU regions into three clusters based on their income convergence patterns. Cluster A, representing Convergence Club 1 with 79 regions, had a mid-range income level of 15,525 € and reached an average economic growth of 58.8%. Convergence Club 2 (Cluster B), the wealthiest group comprising 115 regions with an initial GDP of 23,597 €, exhibited the lowest growth rate (53.8%) over the observed period. By contrast, Cluster C, identified as Convergence Club 3, began from the lowest income level 7,158 €, but experienced remarkably growth (123.6%).
As shown in Table 4 and our estimations, the convergence process is heterogeneous, with notable differences observed between clusters. Cluster A shows only weak convergence, even though it benefited from the highest EU funding. Developed regions in Cluster B, which received relatively low EU support, exhibit only very slow convergence. Finally, Cluster C with 48 regions, provides strong empirical evidence of catching-up process over the observed period.
| Type of regions | Convergence Club 1 [%] |
Convergence Club 2 [%] |
Convergence Club 3 [%] |
|---|---|---|---|
| Less developed regions | 51.9 (41) | 3.5 (4) | 79.2 (38) |
| Transition regions | 32.9 (26) | 31.3 (36) | 14.6 (7) |
| Developed regions | 15.2 (12) | 65.2 (75) | 6.2 (3) |
| Total | 100 (79) | 100 (115) | 100 (48) |
Note: Official classification is defined in Article 108 of Regulation (EU) 2021/1060 of the European Parliament and of the Council.
Source: own work.
According to Regulation (EU) 2021/1060, as previously mentioned, the allocation of EU resources is based on three categories of NUTS level 2 regions. These include less developed regions with GDP per capita below 75% of the EU27 average, transition regions with GDP per capita between 75% and 100%, and more developed regions with GDP per capita above the EU27 average. This policy-based classification forms the starting point for further evaluation.
In Table 5, the EU official classification of NUTS2 regions is compared with the results derived from the applied cluster analysis. Our main goal is to examine to what extent the cluster analysis used corresponds to the official EU regional categorisation. The results show that less developed regions are concentrated primarily in Convergence Club 3 (79.2%) and Convergence Club 1 (51.9%). Transition regions are more evenly distributed across the clubs, with Club 1 accounting for 32.9%, Club 2 for 31.3%, and Club 3 for 14.6%. Lastly, developed regions are predominantly clustered in Convergence Club 2 (65.2%), while smaller shares are observed in Club 1 (15.2%) and Club 3 (6.2%).
Overall, the distribution reveals a link between the official development status of regions and their placement in the convergence clubs, while also revealing some noteworthy patterns. Among less developed regions, two distinct convergence paths emerge: one group shows strong evidence of catching up, whereas the other demonstrates only very weak convergence despite receiving the highest level of EU funding. Similarly, 65.2% of NUTS2 developed regions display evidence of only very slow convergence. A comparable situation also applies to transition regions, where a substantial share demonstrates limited progress toward convergence despite considerable EU financial support.
| Variable | Convergence Club 1 | Convergence Club 2 | Convergence Club 3 |
|---|---|---|---|
| const | -1.522 (-0.46) | 5.892 (1.57) | -5.537*** (-3.93) |
| ln(GDPpc,2000) | -0.124 (-0.53) | -0.030 (-0.57) | -0.692*** (-4.02) |
| ln(EU_Payi) | 0.066 (1.08) | 0.008 (0.42) | -0.058 (-0.88) |
| ln(LPi) | 0.074 (0.09) | 0.617** (2.27) | 0.012 (0.03) |
| ln(EMPLi) | 0.508* (1.69) | 0.685*** (6.20) | 0.512 (0.62) |
| ln(EDUCi) | 0.064 (0.57) | 0.092*** (2.59) | -0.025 (-0.11) |
| ln(GHG_emisi) | 0.062 (0.89) | 0.084** (2.46) | -0.021 (-0.32) |
| Less developed (dummy) | -0.095 (-1.54) | -0.041 (-1.06) | -0.281*** (-4.30) |
| Metropolitan (dummy) | 0.244* (1.91) | 0.029 (0.69) | 0.254* (1.79) |
| R2 | 0.550 | 0.533 | 0.639 |
| Obs. | 68 | 108 | 47 |
Note: ln(GDPpc,2000) - Real GDP per capita (in PPS) in 2000; ln(EU_Payi) - EU Payments for NUTS2 regions covering 2000-2020; ln(LPi) - Real labour productivity per person; ln(EMPLi) - Employment rate of the age group 15-64; ln(EDUCi) - Share of the population with higher education (tertiary educational attainment, age 25-64); ln(GHG_emisi) - Greenhouse gas emissions per capita (ton/capita); Less developed - Dummy variable for EU less developed regions; Metropolitan - Dummy variable for metropolitan regions; R2 - Coefficient of determinations; Obs. - Number of observations. ***, **, * denote significance at 1%, 5% and 10% level, respectively.
Source: European Commission, Eurostat, own calculations.
Table 6 presents the baseline condition convergence models estimated using OLS method. Our results for Convergence Club 1 reveal a weak convergence process, as the coefficient on initial GDP per capita is negative -0.124, but not statistically significant. Employment shows a marginally significant positive impact on growth, suggesting that regions with higher employment rates performed better over the period. European metropolitan areas also grew somewhat faster, with a coefficient of 0.244 significant at the 10% level. In general, economic growth in Club 1 appears to be driven primarily by labour market dynamics and urbanisation rather than by initial income levels.
Convergence Club 2, comprising 108 developed regions, shows no evidence of convergence; initial GDP per capita does not significantly influence subsequent growth. Instead, growth is strongly linked to selected structural factors. Labor productivity, employment, and education are all significant and positively associated with economic growth, emphasising the role of human capital and productive capacity. Interestingly, greenhouse gas emissions are also positively associated with growth (0.08, significant at the 5% level). Economic activity in these EU regions remains closely tied to energy and emission-intensive processes. This cluster thus reflects a model based on efficiency and factor accumulation rather than convergence dynamics.
Convergence Club 3 (only 47 regions) provides textbook conditional convergence. The coefficient on initial GDP per capita is strongly negative and highly significant, confirming that less developed regions in this cluster experienced faster growth than their richer counterparts. The dummy for less developed regions is -0.281 (significant at the 1% level), indicating persistent disadvantages for structurally weaker regions. Metropolitan regions, by contrast, exhibit a marginally significant positive effect, which indicates that agglomeration effects are an important driver of growth in this group. To conclude, lower initial income leads to higher growth, but structural disadvantages can hold regions back.
5. Discussion
The empirical results confirm that regional convergence within the EU remains highly heterogeneous, lending strong support to the club convergence hypothesis. While the aggregate convergence estimates suggest the presence of both absolute and conditional convergence among EU NUTS2 regions, the cluster analysis reveals the coexistence of distinct convergence paths. This finding is consistent with earlier studies showing that EU regions do not converge uniformly but rather form convergence clubs shaped by initial conditions, structural characteristics, and spatial context (Bartkowska and Riedl, 2009; Artelaris et al., 2010). The identification of a cluster of low-income regions exhibiting strong catching-up dynamics alongside clusters characterised by weak or very slow convergence highlights the limitations of relying solely on average convergence measures when assessing territorial cohesion.
The results also contribute to the ongoing debate on the effectiveness of EU Cohesion Policy. Although EU funding is clearly targeted toward less developed regions, as evidenced by the strong inverse relationship between initial income levels and EU payments per capita, its impact on convergence appears to be uneven. This aligns with findings by Crescenzi and Giua (2020), who have demonstrated that the growth effects of Cohesion Policy vary substantially across Member States and tend to materialise only in the long run, as well as with Bachtrögler et al. (2020), who emphasised the decisive role of local context in shaping policy outcomes. The presence of convergence clubs among both less developed and more developed regions suggests that EU transfers alone are insufficient to overcome deep-rooted structural disadvantages, reinforcing calls for more place-based and territorially sensitive policy interventions.
From a broader perspective, the observed convergence patterns mirror recent evidence from both regional and macro-level studies. For instance, Cavallaro and Villani (2021) have shown that club membership is closely linked to structural factors such as human capital, productivity, and economic structure, while Harb et al. (2024) identified persistent productivity-based convergence clubs across EU regions. Similarly, evidence from the Eurozone indicates that even highly integrated economies form distinct convergence clubs driven by structural growth determinants rather than converging toward a common steady state (Solanes et al., 2024). Together, these findings underscore the central role of structural and spatial heterogeneity in shaping long-term development trajectories and challenge the notion of unconditional territorial convergence within the EU.
A limitation of this study is that it does not explicitly account for spatial spillovers between regions. Given that regional growth may be influenced by interregional linkages (e.g., commuting, migration, trade, and knowledge diffusion), future research could complement our clustering framework with spatial econometric models to capture geographic dependence more directly.
6. Conclusion
This paper contributes to the empirical literature on regional convergence in EU by providing a comparative analysis of NUTS2 regions. To be more precise, it examines the extent to which EU funding has reduced regional disparities, analyses how structural and spatial heterogeneity shapes the uneven convergence process, and presents empirical evidence in support of the regional club convergence hypothesis within the EU.
Our analysis reaffirms the persistence of substantial regional inequalities within the EU. At present, more than one in four EU citizens (28%) reside in NUTS2 regions where GDP per capita is below 75% of the EU average. These areas are concentrated primarily in the eastern Member States, but also include regions in Greece, Portugal, Spain, Southern Italy and outermost regions (Ninth Cohesion Report, 2024). Therefore, the EU financial resources play a crucial role in reducing regional inequalities by helping less developed regions in their efforts to catch up with more developed regions. The European Commission has allocated over 404 billion € during the 2014-2020 programming period. The total budget for implementing Cohesion Policy for the period 2021-2027 is 392 billion €. With the national co-financing, about half a trillion euros will be available to finance the programmes in the EU countries and regions.
The obtained results confirmed both absolute and conditional convergence among European NUTS2 regions over the selected period. In the case of absolute convergence, the estimated speed of convergence is approximately 2.7% per year. For conditional convergence, this rate increases, as the incorporation of structural factors enhances the explanatory power of the model. However, a more detailed examination shows that the convergence process has varied significantly across regions. EU funding has contributed to reducing regional disparities, but recent convergence trends have been strongly influenced by other determinants, including region-specific characteristics and underlying structural factors.
Evidence from the study uncovers considerable heterogeneity in income convergence among European NUTS2 regions, confirming the potential existence of three convergence clubs with different dynamics. While less developed regions in Convergence Club 3 provide strong indication of catching-up, other clusters, particularly Convergence Clubs 1 and 2, demonstrate only weak or slow convergence despite substantial EU financial support and higher initial level of GDP per capita. When set against the official EU classification framework, the findings reveal a mixture of convergence and divergence. Beyond the influence of EU funding, structural and regional factors - such as employment, productivity, education, and urbanisation - play a crucial role in shaping growth trajectories. The main policy recommendation for transition and less developed EU regions should be directed toward enhancing productivity, strengthening human capital, and fostering innovation as key drivers of sustained economic growth.
Our findings suggest that EU Cohesion Policy in the coming years will continue to be guided by the territorial principle. A place-based approach will consider the intrinsic characteristics, challenges and potential of each European region, whether less developed or more developed. By tailoring interventions to the specific needs of local regions, this approach can enhance the effectiveness of EU financial sources and foster sustainable, inclusive economic growth. The EU aims for all regions and metropolitan areas in Europe to actively contribute to sustainable development. A key component of this sustainability will be the green and digital transformation of economies, focusing on enhanced efficiency and achieving climate neutrality. Current challenges and the EU’s ambitious goals should be central to discussions on shaping the framework for Cohesion Policy beyond 2027.
Autorzy
REFERENCES
ARTELARIS, P., KALLIORAS, D. and PETRAKOS, G. (2010), ‘Regional inequalities and convergence clubs in the European Union new member-states’, Eastern Journal of European Studies, Centre for European Studies, Alexandru Ioan Cuza University, 1, pp. 113–133.
CAVALLARO, E. and VILLANI, I. (2021), ‘Club convergence in EU countries: A sectoral perspective’, Journal of Economic Integration, 36 (1), pp. 125–161. https://doi.org/10.11130/jei.2021.36.1.125
CRESCENZI, R. and GIUA, M. (2020), ‘One or many Cohesion Policies of the European Union? On the differential economic impacts of Cohesion Policy across member states’, Regional Studies, 54 (1), pp. 10–20. https://doi.org/10.1080/00343404.2019.1665174
BACHTRÖGLER, J., FRATESI, U. and PERUCCA, G. (2020), ‘The influence of the local context on the implementation and impact of EU Cohesion Policy’, Regional Studies, 54 (1), pp. 21–34. https://doi.org/10.1080/00343404.2018.1551615
BARRO, R. J., SALA-I-MARTIN, X., BLANCHARD, O. J. and HALL, R. E. (1991), ‘Convergence across States and Regions’, Brookings Papers on Economic Activity, 22 (1), pp. 107–182. https://doi.org/10.2307/2534639
BARTKOWSKA, M. and RIEDL, A. (2009), ‘Regional convergence clubs in Europe: Identification and conditioning factors’, SSRN Electronic Journal. https://doi.org/10.2139/ssrn.1438007
ESPINOZA, R. A. (2021), ‘The Fiscal Multiplier of European Structural Investment Funds: Aggregate and Sectoral Effects with an Application to Slovenia’, IMF Working Papers 2021, 118. https://doi.org/10.5089/9781513573762.001
EUROPEAN COMMISSION (2024), Cohesion Open Data Platform, https://cohesiondata.ec.europa.eu/ [accessed on: 01.10.2025].
EUROPEAN COMMISSION (2024), History of the Policy, https://ec.europa.eu/regional_policy/policy/what/history_en [accessed on: 12.09.2025].
EUROPEAN COMMISSION (2024), Ninth report on economic, social and territorial cohesion, Publications Office of the European Union, https://ec.europa.eu/regional_policy/information-sources/cohesion-report_en [accessed on: 14.09.2025].
EUROPEAN COMMISSION (2022), EU lagging regions: State of play and future challenges, QA-04-20-488-EN-N, Publications Office of the European Union.
EUROPEAN COMMISSION (2020), Territorial Agenda 2030, https://territorialagenda.eu [accessed on: 06.09.2025].
EUROSTAT (2024), Overview - Nomenclature of territorial units for statistics, https://ec.europa.eu/eurostat/web/nuts [accessed on: 30.08.2025].
FIASCHI, D., LAVEZZI, A. M. and PARENTI, A. (2017), ‘Does EU cohesion policy work? Theory and evidence’, Journal of Regional Science, 57 (1), pp. 1–38. https://doi.org/10.1111/jors.12364
FIURATTI, F., NIKOLOVA, D., PENNINGS, S. and SCHIFFBAUER, M. (2024), ‘Are Regional Fiscal Multipliers on EU Structural and Investment Fund Spending Large? A Reassessment of the Evidence’, Policy Research Working Paper No. 10658. Washington, DC: World Bank. https://doi.org/10.1596/1813-9450-10658
FORAY, D., DAVID, P. A. and HALL, B. H. (2011), ‘Smart specialisation from academic idea to political instrument, the surprising career of a concept and the difficulties involved in its implementation’, MTEI Working Paper.
HAGEN, T. and MOHL, P. (2011), ‘16 Econometric evaluation of EU Cohesion Policy: a survey’, International Handbook on the Economics of Integration: Factor Mobility, Agriculture, Environment and Quantitative Studies, 3, 343. https://doi.org/10.4337/9781849806152.00030
HARB, G., BASSIL, C. and EL SAHLI, Z. (2024), ‘Club convergence in productivity among European regions: Recent evidence and policy implications’, Journal of Economic Integration, 39 (3), pp. 525–556. https://doi.org/10.11130/jei.2024026
LÓPEZ-BAZO, E. (2022), ‘The Impact of Cohesion Policy on Regional Differences in Support for the European Union’, JCMS: Journal of Common Market Studies, 60, pp. 1219-1236. https://doi.org/10.1111/jcms.13153
MANKIW, G. N. (2022), Macroeconomics, eleventh edition, New York: MacMillan Publishers.
MEDEIROS, E. (2016), ‘Territorial cohesion: An EU concept’, European Journal of Spatial Development, 14 (1), 1–30. https://doi.org/10.5281/zenodo.5141339
OECD (2023), ‘OECD Regional Outlook 2023: The Longstanding Geography of Inequalities’, OECD Publishing, Paris. https://doi.org/10.1787/92cd40a0-en
REGULATION (EU) 2021/1060 OF THE EUROPEAN PARLIAMENT AND OF THE COUNCIL, https://eur-lex.europa.eu/legal-content/EN/TXT/?uri=CELEX%3A32021R1060 [accessed on: 03.09.2025].
SOLANES, G. J., BEYAERT, A. and LOPEZ-GOMEZ, L. (2024). ‘Income convergence clubs in the Eurozone: a tale beyond the core/periphery divide’, Applied Economic Analysis, 33 (97), pp. 1–18. https://doi.org/10.1108/AEA-02-2024-0085
SOLOW, R. M. (1956), ‘A Contribution to the Theory of Economic Growth’, The Quarterly Journal of Economics, 70 (1), pp. 65–94. https://doi.org/10.2307/1884513
WHITE, H. (1980), ‘A heteroskedasticity-consistent covariance matrix estimator and a direct test for heteroskedasticity’, Econometrica, 48 (4), pp. 817–838. https://doi.org/10.2307/1912934
APPENDIX
APPENDIX A
| Country | Regions at NUTS2 level |
|---|---|
| Belgium | Région de Bruxelles-Capitale/Brussels Hoofdstedelijk Gewest; Prov. Antwerpen; Prov. Limburg; Prov. Oost-Vlaanderen; Prov. Vlaams-Brabant; Prov. West-Vlaanderen; Prov. Brabant wallon; Prov. Hainaut; Prov. Liège; Prov. Luxembourg; Prov. Namur |
| Bulgaria | Severozapaden; Severen tsentralen; Severoiztochen; Yugoiztochen; Yugozapaden; Yuzhen tsentralen |
| Czechia | Praha; Střední Čechy; Jihozápad; Severozápad; Severovýchod; Jihovýchod; Střední Morava; Moravskoslezsko |
| Denmark | Hovedstaden; Sjælland; Syddanmark; Midtjylland; Nordjylland |
| Germany | Stuttgart; Karlsruhe; Freiburg; Tübingen; Oberbayern; Niederbayern; Oberpfalz; Oberfranken; Mittelfranken; Unterfranken; Schwaben; Berlin; Brandenburg; Bremen; Hamburg; Darmstadt; Gießen; Kassel; Mecklenburg-Vorpommern; Braunschweig; Hannover; Lüneburg; Weser-Ems; Düsseldorf; Köln; Münster; Detmold; Arnsberg; Koblenz; Trier; Rheinhessen-Pfalz; Saarland; Dresden; Chemnitz; Leipzig; Sachsen-Anhalt; Schleswig-Holstein; Thüringen |
| Estonia | Eesti |
| Ireland | Northern and Western; Southern; Eastern and Midland |
| Greece | Attiki; Voreio Aigaio; Notio Aigaio; Kriti; Anatoliki Makedonia, Thraki; Kentriki Makedonia; Dytiki Makedonia; Ipeiros; Thessalia; Ionia Nisia; Dytiki Ellada; Sterea Ellada; Peloponnisos |
| Spain | Galicia; Principado de Asturias; Cantabria; País Vasco; Comunidad Foral de Navarra; La Rioja; Aragón; Comunidad de Madrid; Castilla y León; Castilla-La Mancha; Extremadura; Cataluña; Comunitat Valenciana; Illes Balears; Andalucía; Región de Murcia; Ciudad de Ceuta; Ciudad de Melilla; Canarias |
| France | Ile-de-France; Centre — Val de Loire; Bourgogne; Franche-Comté; Basse-Normandie; Haute-Normandie; Nord-Pas de Calais; Picardie; Alsace; Champagne-Ardenne; Lorraine; Pays de la Loire; Bretagne; Aquitaine; Limousin; Poitou-Charentes; Languedoc-Roussillon; Midi-Pyrénées; Auvergne; Rhône-Alpes; Provence-Alpes-Côte d’Azur; Corse; Guadeloupe; Martinique; Guyane; La Réunion; Mayotte |
| Croatia | Panonska Hrvatska; Jadranska Hrvatska; Grad Zagreb; Sjeverna Hrvatska |
| Italia | Piemonte; Valle d’Aosta/Vallée d’Aoste; Liguria; Lombardia; Abruzzo; Molise; Campania; Puglia; Basilicata; Calabria; Sicilia; Sardegna; Provincia Autonoma di Bolzano/Bozen; Provincia Autonoma di Trento; Veneto; Friuli-Venezia Giulia; Emilia-Romagna; Toscana; Umbria; Marche; Lazio |
| Cyprus | Kypros |
| Latvia | Latvija |
| Lithuania | Sostinės regionas; Vidurio ir vakarų Lietuvos regionas |
| Luxembourg | Luxembourg |
| Hungary | Budapest; Pest; Közép-Dunántúl; Nyugat-Dunántúl; Dél-Dunántúl; Észak-Magyarország; Észak-Alföld; Dél-Alföld |
| Malta | Malta |
| Netherlands | Groningen; Friesland; Drenthe; Overijssel; Gelderland; Flevoland; Noord-Holland; Zeeland; Utrecht; Zuid-Holland; Noord-Brabant; Limburg |
| Austria | Burgenland; Niederösterreich; Wien; Kärnten; Steiermark; Oberösterreich; Salzburg; Tirol; Vorarlberg |
| Poland | Małopolskie; Śląskie; Wielkopolskie; Zachodniopomorskie; Lubuskie; Dolnośląskie; Opolskie; Kujawsko-pomorskie; Warmińsko-mazurskie; Pomorskie; Łódzkie; Świętokrzyskie; Lubelskie; Podkarpackie; Podlaskie; Warszawski stołeczny; Mazowiecki regionalny |
| Portugal | Norte; Algarve; Centro (PT); Área Metropolitana de Lisboa; Alentejo; Região Autónoma dos Açores; Região Autónoma da Madeira |
| Romania | Nord-Vest; Centru; Nord-Est; Sud-Est; Sud-Muntenia; Bucureşti-Ilfov; Sud-Vest Oltenia; Vest |
| Slovenia | Vzhodna Slovenija; Zahodna Slovenija |
| Slovakia | Bratislavský kraj; Západné Slovensko; Stredné Slovensko; Východné Slovensko |
| Finland | Länsi-Suomi; Helsinki-Uusimaa; Etelä-Suomi; Pohjois- ja Itä-Suomi; Åland |
| Sweden | Stockholm; Östra Mellansverige; Småland med öarna; Sydsverige; Västsverige; Norra Mellansverige; Mellersta Norrland; Övre Norrland |
Source: European Commission.
APPENDIX B
| Country | Total allocation [bn. €] | EU sources | Country’s own resources | ||
|---|---|---|---|---|---|
| [bn. €] | [%] | [bn. €] | [%] | ||
| Luxembourg | 0.53 | 0.32 | 60.2 | 0.21 | 39.8 |
| Malta | 1.21 | 1.01 | 83.1 | 0.20 | 16.9 |
| Cyprus | 1.39 | 1.11 | 80.0 | 0.28 | 20.0 |
| Denmark | 2.90 | 2.10 | 72.5 | 0.80 | 27.5 |
| Netherlands | 4.97 | 2.85 | 57.4 | 2.12 | 42.6 |
| Slovenia | 5.62 | 4.51 | 80.3 | 1.11 | 19.7 |
| Belgium | 6.29 | 3.26 | 51.8 | 3.03 | 48.2 |
| Estonia | 6.33 | 4.88 | 77.2 | 1.45 | 22.8 |
| Ireland | 7.22 | 4.39 | 60.8 | 2.83 | 39.2 |
| Latvia | 7.61 | 6.23 | 81.8 | 1.38 | 18.2 |
| Sweden | 7.98 | 4.62 | 57.9 | 3.36 | 42.1 |
| Finland | 10.83 | 4.93 | 45.6 | 5.90 | 54.4 |
| Lithuania | 10.99 | 9.33 | 84.9 | 1.66 | 15.1 |
| Bulgaria | 13.02 | 11.13 | 85.5 | 1.89 | 14.5 |
| Austria | 14.07 | 6.69 | 47.6 | 7.38 | 52.4 |
| Croatia | 14.20 | 12.19 | 85.9 | 2.01 | 14.1 |
| Slovakia | 20.52 | 16.57 | 80.7 | 3.95 | 19.3 |
| Greece | 30.12 | 25.16 | 83.5 | 4.96 | 16.5 |
| Hungary | 32.09 | 27.16 | 84.6 | 4.93 | 15.4 |
| Czechia | 34.90 | 25.78 | 73.9 | 9.12 | 26.1 |
| Portugal | 36.96 | 29.38 | 79.5 | 7.58 | 20.5 |
| Romania | 41.58 | 35.21 | 84.7 | 6.37 | 15.3 |
| Germany | 52.09 | 34.07 | 65.4 | 18.02 | 34.6 |
| France | 56.56 | 36.56 | 64.6 | 20.00 | 35.4 |
| Spain | 74.99 | 57.32 | 76.4 | 17.67 | 23.6 |
| Italy | 93.26 | 62.76 | 67.3 | 30.50 | 32.7 |
| Poland | 111.44 | 91.27 | 81.9 | 20.17 | 18.1 |
| EU27 average | 25.91 | 19.29 | 74.4 | 6.62 | 25.6 |
Source: European Commission (Cohesion Open Data Platform), own calculations.