
Spatial justice and the geography of inequality in the Lisbon Metropolitan Area
Miguel VIEGAS  *
Jan WOLF *
Abstract. This paper investigates the geography of social inequality in Portugal through a multi-scalar analysis of territorial disparities and socio-spatial segregation. Focusing on the Lisbon Metropolitan Area, it combines Population and Housing Census data from 2011 and 2021 with measures of concentration, segregation, and spatial autocorrelation, complemented by cartographic and Local Indicators of Spatial Association (LISA) analysis.
The results reveal persistent socio-spatial inequalities alongside profound metropolitan restructuring. While disadvantaged populations have historically been concentrated in peripheral and working-class territories, recent transformations have been characterised by the displacement of low-qualified groups from central neighbourhoods towards the metropolitan periphery, reflecting processes of gentrification, housing-market restructuring, and spatial polarisation.
More broadly, the results suggest that metropolitan inequality is increasingly shaped not simply by residential segregation, but by the uneven territorial distribution of different forms of capital and the progressive displacement of social disadvantage towards peripheral spaces. The article contributes to contemporary debates on spatial justice, territorial cohesion, and the reproduction of inequality in European metropolitan regions.
Key words: spatial justice, social inequality, territorial disparities, Lisbon Metropolitan Area, spatial econometrics, urban segregation, regional development.
1. Introduction
Social and economic inequalities remain persistent features of European societies and have become increasingly visible in the aftermaths of recent crises. In Portugal, after a period of improvement in several social indicators, the COVID-19 pandemic reversed a part of this progress. According to Peralta et al. (2021), the national poverty rate increased from 16.2% in 2019 to 18.4% in 2020, while regional disparities also intensified. These developments have reinforced the need to examine inequality not only as a social and economic phenomenon, but also as a territorial process. Geography provides a crucial lens through which one can analyse inequality. The spatial organisation of housing, employment, public services, and urban amenities is not random; it reflects historically-produced relations of power, class divisions, and unequal access to collective resources. Cities and metropolitan areas are, therefore, not merely places where inequalities appear, but also spaces through which they are produced, reproduced, and made visible.
The study of socio-spatial inequality has its roots in urban sociology. The Chicago School has made a decisive contribution by showing that the city is socially differentiated and that residential location is shaped by competition for urban space. However, contemporary research has moved beyond ecological interpretations of the city by incorporating theories of class, spatial justice, and the political economy of urbanisation. In this perspective, segregation and spatial concentration are not only descriptive patterns, but expressions of deeper social mechanisms linked to the unequal distribution of economic, cultural, social, and symbolic resources.
This article builds on this approach by combining Weberian and Bourdieusian understandings of class with contemporary debates on socio-economic segregation, gentrification, and metropolitan restructuring. The unequal distribution of different forms of capital is understood here as a key mechanism through which socio-spatial hierarchies are produced. Economic capital shapes access to housing and mobility. Cultural capital influences occupational trajectories and educational opportunities. Social capital reflects civic participation and collective resources, and symbolic capital expresses the prestige attached to certain occupations, groups and places.
The Lisbon Metropolitan Area provides a particularly relevant laboratory for examining these processes. Previous research on Portugal showed that residential segregation and urban inequality were shaped by the interaction between class, migration, housing trajectories, and metropolitan expansion, with important contributions from Jorge Malheiros and other Portuguese urban geographers. More recent studies on Lisbon have highlighted the role of gentrification, touristification, housing-market pressures, and displacement in reshaping the social geography of the city. These processes have intensified socio-spatial contrasts between affluent central areas, historically working-class neighbourhoods, and peripheral territories where social vulnerability remains concentrated. Against this background, the article analyses the spatial distribution of populations whose highest completed level of education is primary education. This group is not treated as a complete measure of class but as an indicator of extreme educational disadvantage and of the territorial legacy of historical inequalities in access to education. The objective is to understand how this form of disadvantage is distributed across space and how it relates to broader socio-spatial hierarchies.
The article makes three contributions. First, it develops a theoretical framework linking class divisions, forms of capital and territorial inequality. Second, it examines the concentration, segregation, and spatial clustering of low educational attainment in the Lisbon Metropolitan Area between the 2011 and 2021 censuses, using the Gini, Duncan, and Moran indices complemented by cartographic and LISA analysis. Third, it estimates the association between territorial inequality and different forms of capital across Portuguese municipalities using the Generalized Maximum Entropy estimator. In doing so, the article contributes to a multidimensional understanding of spatial justice and the geography of inequality in contemporary Portugal.
2. Social class, spatial justice, and residential segregation
The spatial distribution of social groups is not a neutral or random outcome. It reflects the historically produced relationship between social hierarchies, housing markets, labour markets, public policies, and access to urban resources. For this reason, the analysis of residential segregation cannot be reduced to a merely descriptive exercise. It requires a theoretical framework capable of explaining why certain groups are overrepresented in some territories and underrepresented in others, and how these spatial patterns reproduce broader structures of inequality.
The classical tradition of urban sociology, particularly the Chicago School, made a decisive contribution by showing that the city is socially differentiated and that residential location is shaped by competition for urban space (Harris and Ullman, 1945; Park et al., 1925). However, while still influential, its ecological interpretation of segregation is insufficient for the purposes of this article, since it tends to under-theorise the structural mechanisms through which class divisions are produced and spatially reproduced (Castells, 1977; Saunders, 2003). A contemporary analysis of socio-spatial inequality must, therefore, go beyond urban ecology and incorporate theories of social class, spatial justice, and the political economy of urbanisation (Harvey, 1973; Lefebvre, 1992; Soja, 2010).
From a Weberian perspective, class position cannot be reduced to income alone. It is shaped by the unequal distribution of economic resources, status, and power (Weber, 1946). This multidimensional understanding is particularly relevant for spatial analysis, since residential location reflects not only purchasing power but also social recognition, institutional capacity, access to networks, and differentiated opportunities in the labour and housing markets (Harvey, 1973; Logan and Molotch, 1987). Bourdieu’s theory of social space further developed this perspective by conceptualising inequality as the result of the unequal distribution of different forms of capital: economic, cultural, social, and symbolic (Bourdieu, 1986, 1989). These forms of capital are not only individual attributes; they are also spatially embedded. Territories concentrate, reproduce, and make visible unequal volumes and combinations of capital (Bourdieu, 1989; Wacquant, 2007).
This perspective is central to the present article. Economic capital shapes access to housing, mobility, and urban amenities (Bourdieu, 1986; Logan and Molotch, 1987). Cultural capital, strongly associated with educational attainment, influences occupational trajectories and the capacity to access qualified labour markets (Blanden et al., 2023; Bourdieu, 1986). Social capital reflects the density of networks, institutional participation, and collective resources available in each territory (Bourdieu, 1986; Putnam, 2000). Symbolic capital expresses the prestige and social recognition attached to certain groups, occupations, and places (Bourdieu, 1989; Lenoir, 2004). The spatial concentration of these forms of capital contributes to the production of socio-spatial hierarchies, in which some territories accumulate advantage while others become associated with disadvantage, stigma or residualisation (Soja, 2010; Wacquant, 2007).
The concept of spatial justice allows for this process to be interpreted not merely as an uneven distribution of population groups, but as a form of inequality embedded in space (Soja, 2010). Following the critical tradition of urban studies, space is not only the stage where social inequalities appear; it is also one of the mechanisms through which they are produced (Harvey, 1973; Lefebvre, 1992). Unequal access to housing, transport, public services, employment, and urban centrality generates different life chances (Harvey, 1973; Soja, 2010). The geography of inequality is, therefore, inseparable from the geography of opportunity and access to collective resources (Soja, 2010). In this sense, residential segregation is not only an indicator of social distance between groups, but also a mechanism that can reinforce inequality over time (Massey and Denton, 1993; Wacquant, 2007).
European research on socio-economic segregation has shown that contemporary metropolitan areas are increasingly marked by the spatial separation of social groups. This process is connected to widening income inequality, labour-market restructuring, housing systems, welfare regimes, and the changing role of capital cities in global economic circuits (Musterd et al., 2017; Tammaru et al., 2016). In Southern European cities, these processes have specific features, including late suburbanisation, strong homeownership regimes, fragmented planning systems, informal or semi-formal urbanisation, and intense recent pressure from tourism, real-estate valorisation, and housing financialisation (Arbaci, 2019; Maloutas, 2007). Lisbon is a particularly relevant case because it combines long-standing metropolitan inequalities with recent processes of gentrification, touristification, and displacement from the central city towards peripheral areas (Malheiros et al., 2013; Mendes, L., 2017).
In Portugal, and particularly in the Lisbon Metropolitan Area, previous research has shown that residential segregation and urban inequality are shaped by the interaction between class, migration, housing trajectories, and metropolitan expansion (Malheiros, 2002; Malheiros et al., 2013). The work of Jorge Malheiros and other Portuguese urban geographers is especially important in this regard, since it has demonstrated that Lisbon’s socio-spatial structure cannot be understood without considering the historical formation of suburban territories, the concentration of vulnerable groups in specific neighbourhoods, and the coexistence of social heterogeneity with persistent spatial inequalities (Malheiros, 2002; Malheiros et al., 2013). More recent research on gentrification and touristification in Lisbon has also shown how the transformation of central neighbourhoods, the growth of short-term rentals, and the internationalisation of real-estate demand have intensified displacement pressures and reconfigured the social geography of the city (Mendes, L., 2017, 2021).
This article builds on these contributions by examining the spatial distribution of low-qualified populations as an indicator of socio-spatial disadvantage. Low educational attainment is not treated here as a complete definition of class but as a relevant empirical marker of vulnerability, strongly associated with labour-market fragility, lower income, weaker occupational mobility, and greater exposure to territorial disadvantage (Blanden et al., 2023; Bourdieu, 1986; OECD, 2022). The objective is, therefore, not to equate qualification mechanically with class but to analyse how one important dimension of social inequality is spatially distributed and how this distribution relates to broader forms of capital (Bourdieu, 1986; Wacquant, 2007).
On this basis, the empirical strategy is organised around two complementary levels of analysis. First, the article measures the concentration, segregation, and spatial clustering of low-qualified populations in the Lisbon Metropolitan Area between 2011 and 2021, using the Gini, Duncan and Moran indices, complemented by cartographic and local spatial autocorrelation analysis. Second, it estimates the association between territorial inequality and different forms of capital across Portuguese municipalities through a Generalized Maximum Entropy model. The purpose of the model is not merely predictive, but theoretical: it tests whether the spatial distribution of disadvantage is associated with the unequal territorial distribution of economic, cultural, social, and symbolic capital, following the conceptual framework derived from Bourdieu’s theory of social space and the literature on socio-spatial inequality (Bourdieu, 1986, 1989; Soja, 2010).
Four hypotheses guide the quantitative analysis:
- H1. Territories with higher levels of economic capital are expected to display lower levels of concentration, segregation, and spatial clustering of low-qualified populations.
- H2. Territories with higher levels of cultural capital are expected to display lower levels of concentration, segregation, and spatial clustering of low-qualified populations.
- H3. Territories with stronger social capital are expected to display lower levels of concentration, segregation, and spatial clustering of low-qualified populations.
- H4. Territories with higher concentrations of symbolic capital are expected to display higher levels of spatial polarisation, reflecting the territorial concentration of prestigious occupations, social recognition, and accumulated advantage.
This framework justifies the selection of the explanatory variables used in the econometric model and links the empirical strategy directly to the theoretical argument. Spatial inequality is thus conceptualised as the territorial expression of unequal distributions of capital, while segregation, concentration, and clustering are treated as measurable manifestations of this broader process (Bourdieu, 1989; Soja, 2010).
3. The spatial distribution of the least qualified in the Lisbon metropolitan area
3.1. Data and methodology
This study uses official data from the Portuguese National Statistics Institute (INE), drawing primarily on the 2011 and 2021 Population and Housing Censuses. The analysis focuses on the Lisbon Metropolitan Area (LMA), which comprises 18 municipalities and represents around 27% of the national population and 36% of Portugal’s GDP.
Figure 1 identifies the municipalities that constitute the Greater Lisbon area and provides a geographical reference for the spatial analyses presented throughout the paper.
The empirical analysis is conducted at three complementary territorial scales. First, parishes (“freguesias”) the smallest administrative units for which comparable census data is available, are used to calculate the concentration, segregation, and spatial autocorrelation indices presented in Table 1 and Figure 2. Second, statistical subsections (the smallest census units) are used to map the spatial distribution of low educational attainment and local spatial clusters within the Lisbon Metropolitan Area (Fig. 3 and 4), providing a more detailed understanding of intra-urban patterns. Third, municipalities constitute the unit of analysis for the econometric models estimated for Portugal in 2011 and 2021. This multiscale approach combines regional comparability with local spatial detail, making it possible to examine both broad territorial patterns and fine-grained socio-spatial inequalities.
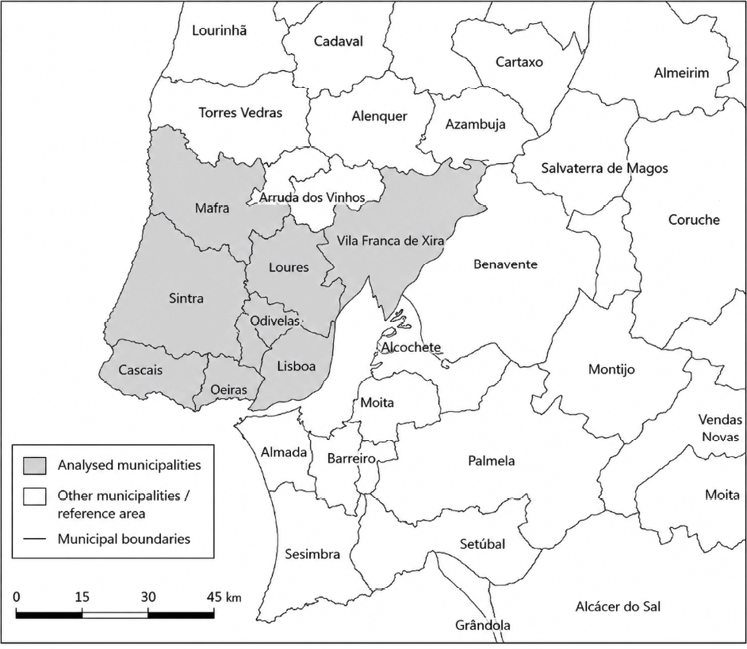
Note: Municipal boundaries are shown for reference
Source: own work based on CAOP 2025 data.
The selected variables capture both the economic and social dimensions of inequality. Attention is given to the proportion of residents with low educational qualifications and their spatial distribution across the LMA. Complementary indicators include variables related to economic resources, educational attainment, civic participation, and occupational prestige. These variables were standardised to facilitate comparison between years and across municipalities.
The methodological strategy combines descriptive spatial statistics with econometric modelling. First, inequality and segregation were examined using summary indicators of concentration and distribution, including the Gini Index (to measure inequality in the distribution of low-qualified individuals) and the Duncan Index (to assess the degree of dissimilarity between groups). Spatial dependence and clustering were then investigated using Moran’s I, which measures spatial autocorrelation, and the Local Indicators of Spatial Association (LISA), which identify local patterns of spatial association and spatial clustering. LISA cluster maps classify geographic units according to the relationship between their values and those of neighbouring units. High–High (HH) clusters represent areas with high values surrounded by neighbouring areas with similarly high values, while Low–Low (LL) clusters identify areas with low values surrounded by neighbouring areas with similarly low values. High–Low (HL) and Low–High (LH) categories identify spatial outliers, corresponding respectively to areas with high values surrounded by low-value neighbours and areas with low values surrounded by high-value neighbours. These classifications provide a detailed representation of local spatial association patterns and statistically significant local concentrations of similar or dissimilar values.
However, these indicators provide global measures of inequality and segregation without explicitly revealing their spatial location. To address this limitation, cartograms and Local Indicators of Spatial Association (LISA) maps are used to identify the territorial expression of these patterns (Anselin, 1995). Spatial visualisation plays a central role in interpreting the results. Choropleth maps and LISA cluster maps display the geographical distribution of low-qualified populations and the spatial dynamics of inequality between 2011 and 2021. The combined use of statistical indicators and spatial representation enables a nuanced understanding of both global and local processes driving socio-spatial disparities in the Lisbon Metropolitan Area.
First, inequality and segregation were examined using parish-level data through summary indicators of concentration and distribution, including the Gini coefficient. This index ranges from zero, indicating a uniform distribution of the population group under analysis across all spatial units, to one, indicating maximum concentration when group k is fully concentrated in a single spatial unit. In this article, group k corresponds to individuals whose highest completed level of education is primary education only. The Gini Index Gk is expressed as follows:

where k denotes the population category under analysis, i and j denote the spatial units used in pairwise comparisons, n the total number of spatial units, pik the proportion of group k in the total population of spatial unit i, Pk the proportion of category k in the total population of the territory under study, ti the total population in spatial unit i, and T the total population in the territory under study.
The distribution of the population can also be measured by the distance between the actual distribution and that which would result if everyone chose his or her location randomly. Duncan’s segregation index measures the proportion of the population (in %) that would have to be relocated to achieve a random distribution across the territory. Its formula, or ISk, is:

In addition to the concentration and segregation indicators, we estimated spatial clustering effects using Moran’s I statistic. Its values range from -1 (negative spatial autocorrelation) to 1 (positive spatial autocorrelation). Positive values indicate that neighbouring spatial units tend to exhibit similar values, whereas negative values suggest that neighbouring units are dissimilar. Values close to zero indicate the absence of spatial autocorrelation. Therefore, Moran’s I measures the degree of spatial autocorrelation, capturing the extent to which similar values cluster across space. Moran’s I index can be represented by the following formula:

with xi corresponding to the value of the variable in geographic unit i, x̅ the mean of x, and wi,j the criterion of contiguity between geographic units i and j. The set of weights wi,j forms the spatial weight matrix W, which can be constructed using different contiguity criteria. In our study, we adopted a first-order rook contiguity criterion, whereby two municipalities were considered neighbours if they shared a common boundary. Accordingly, wi,j takes the value 1 when units i and j are neighbours and 0 otherwise.
The study focuses on the spatial distribution of individuals with low educational attainment in the Lisbon Metropolitan Area. Low educational attainment is defined as the completion of primary education only (four years of schooling). This category reflects a historically specific form of educational disadvantage in Portugal, where four years of schooling corresponded to the compulsory level of education for a substantial part of the population during much of the 20th century. According to Census data, individuals in this category represented 21.9% of the Portuguese population in 2011 and 21.5% in 2021. Although strongly concentrated among older cohorts, particularly those aged 65 and over, this group remains a substantial segment of the Portuguese population. The indicator, therefore, captures both extreme educational disadvantage and the territorial legacy of past inequalities in access to education.
For the spatial analysis presented in Figures 3 and 4, statistical subsections, the smallest census units defined by the Portuguese National Statistics Institute, were used as the basic geographical unit of analysis. Their small spatial scale makes it possible to identify localised patterns of residential concentration and socio-spatial differentiation that would remain hidden at more aggregated territorial levels. The use of statistical subsections, therefore, provides a more detailed understanding of the geography of educational disadvantage and facilitates the identification of spatial clusters and neighbourhood-level inequalities within the Lisbon Metropolitan Area.
3.2. Results and discussion
Table 1 presents the values of the concentration, segregation, and aggregation indices for Portugal and for the Lisbon Metropolitan Area (LMA) in 2011 and 2021. Overall, inequality increased over the decade, both nationally and within the LMA. Except for Moran’s I, the metropolitan results closely followed the national pattern. The Gini Index for the LMA rose markedly, from 0.28 to 0.55, indicating a significant intensification of concentration. The Duncan Index also increased slightly (from 0.22 to 0.24), suggesting a modest rise in segregation between groups. The Moran Index rose from 0.55 to 0.60, pointing to stronger spatial autocorrelation and greater clustering of similar territorial units.
| Indices | Portugal | Lisbon Metropolitan Area | ||
|---|---|---|---|---|
| 2011 | 2021 | 2011 | 2021 | |
| Gini | 0.27 | 0.51 | 0.28 | 0.55 |
| Duncan | 0.20 | 0.24 | 0.22 | 0.24 |
| Moran | 0.71 | 0.77 | 0.55 | 0.60 |
Source: own calculations based on Portuguese Population and Housing Censuses (INE, 2011 and 2021).
The Duncan Index measures the proportion of individuals who would need to relocate to achieve a theoretically uniform spatial distribution. In 2021, 24 percent of residents with low qualifications would have to move to reach such uniformity, compared with 22 percent in 2011. The Gini coefficient complements this picture by measuring overall concentration through the Lorenz curve. Its sharp increase indicates that low-qualified individuals became increasingly concentrated in a smaller number of territorial units. The rise in Moran’s I has further confirmed that parishes with high shares of low-qualified populations tend to be located contiguously, reinforcing spatial clustering of disadvantage.
While these indices quantify the intensity of segregation, concentration, and aggregation, they do not convey spatial location. Cartographic analysis thus complements the statistical results. Figure 2 shows the three indices for Portugal’s NUTS III regions in 2011 and 2021. A clear coastal–inland gradient is visible for both the Gini and Duncan indices: inequality is lower along the densely populated coast and higher in the more sparsely populated interior, where territorial disparities are more pronounced. Between 2011 and 2021, both indices rose across nearly all NUTS III regions, confirming a national trend towards stronger spatial concentration and segregation. The patterns in Moran’s I are more heterogeneous, increasing in regions such as Coimbra and the Porto Metropolitan Area but declining in others, notably Alto Alentejo.
At both national and regional scales, these increases reflect a broader transformation in Portugal’s educational structure. The progressive extension of compulsory schooling – from age 14 in 1973 to 18 in 2012 – has expanded educational attainment overall, reducing the relative size of low-qualified cohorts. Although the population with only primary education remains numerically significant, educational expansion and generational replacement have altered its demographic composition, increasing its concentration among older cohorts. As a result, these populations tend to become increasingly concentrated in specific territories, creating residual pockets of educational disadvantage consistent with a pattern of socio-spatial polarisation.
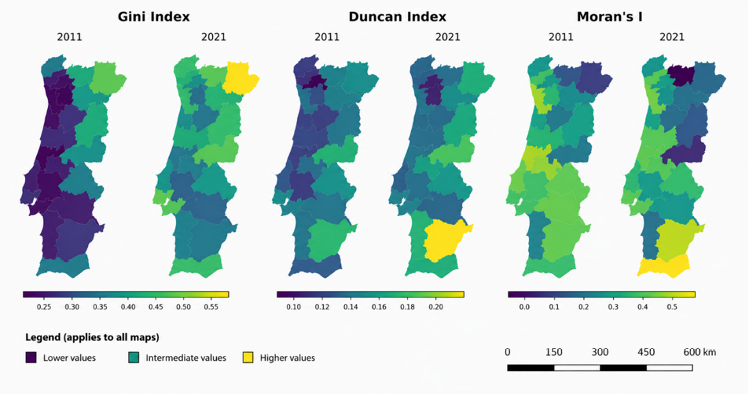
Source: own work based on INE data.
Figure 3 maps the distribution of low-qualified individuals across the Lisbon Metropolitan Area for 2011 and 2021, together with LISA cluster maps. The spatial pattern reveals a persistent territorial divide: higher shares of low-qualified populations occur in the northern municipalities of the metropolitan area, while the southern municipalities show consistently lower proportions. This pattern has remained largely unchanged over the decade, confirming that educational and social disparities are spatially entrenched.
The observed spatial gradient in qualification levels is consistent with patterns documented internationally (Fonseca, 2017). Areas located further from major metropolitan centres often face more limited access to educational opportunities, training institutions and highly qualified labour markets. By contrast, central metropolitan areas tend to concentrate educational resources, economic activity and employment opportunities requiring higher levels of qualification (Lohrberg et al., 2016). These dynamics contribute to the persistence of territorial disparities in educational attainment. In addition, unequal access to educational infrastructure and public services may reinforce these patterns over time (Gagliardi and Percoco, 2017).
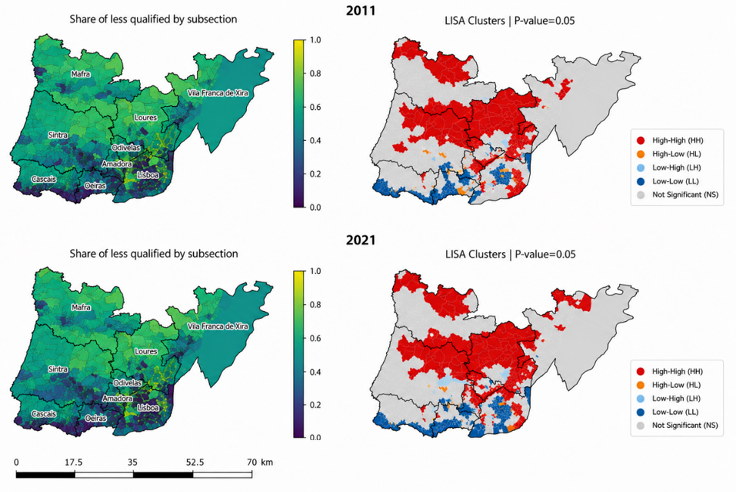
Note: Choropleth maps showing the proportion of individuals with low educational attainment by statistical subsection (left) and corresponding Local Indicators of Spatial Association (LISA) cluster maps identifying statistically significant spatial clusters (right).
Source: own work based on INE Census, 2024.
Figure 4 examines the municipality of Lisbon and its surrounding metropolitan area in greater detail. The cluster maps reveal a strong concentration of low-qualified populations in the northern and western municipalities of the metropolitan area, particularly Mafra, Sintra, and Loures, i.e., territories historically associated with agricultural production supplying the capital. In addition to these clusters, several concentrations of low-qualified populations are also identified within the metropolitan area. A limited number of HL and LH spatial outliers were also identified, indicating statistical subsections whose educational profile differs from that of neighbouring areas. Two main groups of clusters emerge. The first is located on the outskirts of Lisbon, particularly along the municipal boundaries between Lisbon and neighbouring municipalities such as Amadora, Odivelas, and Loures. These areas largely correspond to former industrial and working-class territories that experienced significant economic restructuring following the decline of manufacturing activities from the 1990s onwards.
The second group is concentrated within the city of Lisbon itself, notably in historically working-class neighbourhoods located in the western and eastern sectors of the city, including Ajuda, and the riverside districts of São Vicente, Penha de França, Beato, and Marvila. In these territories, the concentration of low-qualified populations is associated with a combination of limited access to qualified employment, housing deterioration, and long-standing socio-economic disadvantages (Brandão and Brandão, 2012). By contrast, the geographical subsections with the lowest proportions of low-qualified individuals are concentrated in the more affluent central and riverside areas of Lisbon, particularly around Belém in the west and Parque das Nações in the east. Together with the neighbouring municipalities of Oeiras and Cascais, these territories constitute some of the most prosperous areas of the Lisbon Metropolitan Area, characterised by higher incomes, higher educational attainment and greater access to economic opportunities.
The diachronic analysis highlights two major findings. First, spatial disparities in qualification levels persist, confirming the enduring territorial differentiation within the Lisbon Metropolitan Area. Second, profound internal reconfigurations have occurred within the social geography of Lisbon itself. Clusters of low-qualified populations identified in 2011 in central and inner-city neighbourhoods of Lisbon, including Ajuda in the west and São Vicente, Penha de França, and Beato in the eastern riverside sector of the city, had largely disappeared by 2021. At the same time, new concentrations emerged along the metropolitan periphery, particularly in the municipal border areas between Lisbon and the neighbouring municipalities of Amadora, Odivelas, and Loures in Figure 4.
Simultaneously, the spatial footprint of higher-qualified groups expanded within the city. New clusters characterised by low incidences of low-qualified residents appeared in 2021 in Belém and Alcântara, located in the western waterfront sector of Lisbon, as well as in the historic central districts of Misericórdia and Santa Maria Maior. The area associated with higher qualifications, already visible around the central avenues of Lisbon, extended westward and southward, reaching neighbourhoods such as Campolide and Campo de Ourique, traditionally associated with middle- and working-class populations.

Note: The maps highlight statistically significant spatial clusters and local patterns of concentration that are not visible at more aggregated territorial scales.
Source: own work based on INE Census, 2024.
These patterns reflect an intense process of tourism-driven gentrification, housing-market restructuring, and real-estate valorisation that has reshaped Lisbon’s socio-spatial structure. The rehabilitation of central housing stock, the expansion of short-term rental markets, and the inflow of higher-income residents have contributed to the displacement of low-qualified and lower-income households towards the outer metropolitan belt. This process has produced a gradual social reconfiguration of the city; whereby historically working-class neighbourhoods have become increasingly attractive to higher-income groups while socio-economic vulnerability has become more concentrated in peripheral locations. Such dynamics are consistent with the broader processes of metropolitan restructuring, socio-spatial polarisation, and residential segregation observed in many European urban regions (Mendes, 2018; Musterd et al., 2017; Tammaru et al., 2016).
4. The main drivers of spatial inequality across Portuguese municipalities
In the second stage, the determinants of territorial inequality were estimated using the Generalized Maximum Entropy (GME) estimator. This method is particularly appropriate when dealing with ill-posed or underdetermined systems, where the number of parameters may exceed the number of observations (Golan et al., 1996). The GME estimator provides robust parameter estimates even with limited or highly collinear data, making it suitable for regional analyses that involve relatively small samples or highly interdependent explanatory variables.
4.1. Model specification
The dependent variables correspond to three distinct measures of territorial inequality: the Gini Index, the Duncan Index, and Moran’s I. Each indicator captures a different dimension of spatial inequality, respectively, overall concentration, intergroup segregation, and spatial autocorrelation. These indices were computed from census data and estimated for all Portuguese municipalities in 2011 and 2021, generating a panel dataset used in the econometric analysis.
Consistent with the theoretical framework developed in the previous section, the explanatory variables operationalise Bourdieu’s different forms of capital. The objective is not to measure social class directly, but rather to capture some of the main territorial expressions of the unequal distribution of economic, cultural, social, and symbolic resources. Economic capital is proxied by the average monthly wage in each municipality. Wage levels provide a direct measure of the material resources available to individuals and households and are widely used as indicators of economic advantage. Cultural capital is measured through educational attainment, operationalised as the average years of schooling of the resident population. Educational qualifications constitute one of the most widely recognised forms of institutionalised cultural capital and are strongly associated with access to qualified occupations and socioeconomic opportunities. Social capital is represented by electoral participation in local elections. Although electoral turnout does not capture all dimensions of social capital, it provides a comparable and territorially consistent indicator of civic engagement, collective involvement, and participation in local public life. Previous research has frequently employed electoral participation as a proxy for civic capital and local social cohesion. Symbolic capital is measured through the proportion of individuals belonging to prestigious socio-occupational categories, namely managers, senior professionals, and highly qualified occupations. These groups concentrate social recognition, prestige, and status and, therefore, constitute an appropriate empirical proxy for symbolic capital at the territorial level.
Data was obtained from the Portuguese National Statistics Institute (INE) and complementary administrative sources. To facilitate comparability across municipalities and over time, all explanatory variables were standardised before estimation. The GME model was estimated using observations for 2011 and 2021, allowing a comparative assessment of changes in the spatial structure of inequality across Portuguese municipalities.
The Generalized Maximum Entropy (GME) estimator represents a flexible information-theoretic alternative to conventional econometric methods. Developed by Golan et al. (1996), the approach seeks to recover the maximum amount of information from the available data while imposing the minimum number of assumptions on the underlying data-generating process. Unlike conventional estimators, GME remains robust in the presence of multicollinearity, incomplete information and ill-conditioned systems, characteristics that are frequently encountered in spatial and regional datasets (Caputo and Paris, 2008).
The principle underlying the method is the maximisation of the entropy associated with the probability distributions assigned to the model parameters and error terms. By distributing information across a predefined support space, the estimator identifies the least informative probability distribution consistent with the sample evidence, thereby reducing estimation bias and limiting the risk of overfitting. As a result, GME has been increasingly employed in regional science, spatial econometrics, and development studies as a robust alternative in contexts characterised by high spatial heterogeneity and strong interdependence among explanatory variables.
In the present study, the choice of GME is also motivated by the multidimensional nature of the theoretical framework. Territorial inequality is conceptualised as the spatial expression of unequal distributions of economic, cultural, social, and symbolic capital. Since these dimensions are theoretically related and empirically interdependent, the explanatory variables used in the model are expected to exhibit substantial collinearity. The GME estimator provides an appropriate framework for estimating these relationships while minimising the informational assumptions imposed on the data and preserving the multidimensional character of the underlying theoretical constructs.
Formally, the GME estimator seeks to solve:

subject to the information constraints imposed by the sample data:
y = Xβ + ϵ
where H(p) represents Shannon entropy, y represents the vector of dependent variables, X the matrix of explanatory variables, 𝛽 the vector of unknown coefficients, and 𝜖 the error term. Unlike traditional OLS which directly estimates the value of coefficients, GME assumes that each coefficient can be expressed as a discrete distribution:

where zjm, are support points possible values that a 𝛽 can assume, pjm are probabilities associated with each support point, and M is the number of support points. This means that 𝛽 is not a single vector with values but a probabilistic combination of potential values.
The error term 𝜖 is represented as the following discrete distribution:

where wik are support points for the error term and vik are the associated probabilities. The GME estimator searches for the probability distributions pjm and vik that maximises the entropy defined by the expression:

subjected to the following restrictions:

The empirical model is specified as follows:
Inequalityᵢₜ = β₀ + β₁wageᵢₜ + β₂educᵢₜ + β₃participationᵢₜ + β₄prestigeᵢₜ + β₅ D2021ᵢₜ + εᵢₜ
where Inequalityit represents alternatively the Gini Index, the Duncan Index and Moran’s I for municipality i in census year t. The explanatory variables correspond to the territorial expressions of the different forms of capital identified in the theoretical framework: wage captures economic capital, educational attainment represents cultural capital, electoral participation proxies social capital, and the proportion of prestigious socio-occupational categories measures symbolic capital. D2021 is a temporal dummy variable capturing changes between the two census periods.
The purpose of the model is not merely predictive. Rather, it seeks to assess whether territorial inequality is systematically associated with the uneven spatial distribution of different forms of capital across Portuguese municipalities.
As shown in Table 2, some explanatory variables exhibit moderate to strong pairwise correlations. The strongest association is observed between educational attainment and the proportion of prestigious socio-occupational categories (r = 0.854), reflecting the close relationship between cultural and symbolic forms of capital. Average wages are also positively associated with both education and prestige, while electoral participation tends to be negatively correlated with these indicators. These patterns are theoretically expected, since the explanatory variables were selected to capture different but interrelated forms of capital. Economic, cultural and symbolic advantages frequently accumulate within the same territories, generating positive correlations between their empirical indicators. At the same time, the overall level of multicollinearity remains limited. The condition number calculated from the standardised matrix of explanatory variables is 4.98, well below the thresholds commonly associated with serious multicollinearity problems.
| Variables | (1) | (2) | (3) | (4) | (5) |
|---|---|---|---|---|---|
| (1) Wage | 1.000 | ||||
| (2) Education | 0.717 | 1.000 | |||
| (3) Participation | -0.342 | -0.499 | 1.000 | ||
| (4) Prestige | 0.519 | 0.854 | -0.537 | 1.000 | |
| (5) D2021 | 0.508 | 0.414 | 0.070 | 0.207 | 1.000 |
Note: Only the lower triangle of the correlation matrix is reported; the matrix is symmetric.
Source: own work.
Consequently, the observed correlations should not be interpreted as a statistical limitation of the model but rather as an empirical reflection of the multidimensional and interconnected nature of territorial inequality. Nevertheless, the use of the Generalized Maximum Entropy estimator provides an additional safeguard against potential instability arising from interdependencies among explanatory variables.
4.2. Results and discussion
Table 3 presents the results obtained using the Generalized Maximum Entropy estimator for the three dimensions of territorial inequality considered in this study: concentration (Gini Index), segregation (Duncan Index), and spatial clustering (Moran’s I). Overall, the models reveal a coherent set of relationships between territorial inequality and the different forms of capital identified in the theoretical framework, providing empirical support for a multidimensional interpretation of socio-spatial disadvantage.
Economic capital, measured through average wages, displays a statistically significant negative association across all three models. Municipalities characterised by higher wage levels tend to exhibit lower concentration, lower segregation and weaker spatial clustering of low-qualified populations. This finding suggests that economic resources contribute to a more balanced territorial distribution of opportunities and reduce the spatial concentration of disadvantage. Among all explanatory variables, economic capital emerges as one of the most consistent predictors of territorial inequality.
| Variable | Gini | Duncan | Moran |
|---|---|---|---|
| Intercept | 0.20167*** | 0.14124*** | 0.86634*** |
| Wage | -0.00008*** | -0.00004*** | -0.00022*** |
| Education | 0.00289** | 0.00138* | 0.00863** |
| Participation | -0.00134*** | -0.00044 | -0.01118*** |
| Prestige | 0.00962*** | 0.00378** | 0.01350 |
| D2021 | 0.14093*** | -0.02578*** | 0.02630 |
| Adj. R² | 0.5756 | 0.1595 | 0.2477 |
| CV-RMSE | 0.0724 | 0.0451 | 0.2495 |
| N | 554 | 554 | 552 |
Notes: Estimates obtained using the GCE package in R.
*** p < 0.01; ** p < 0.05; * p < 0.10. Significance inferred from bootstrap confidence intervals estimated through the GME procedure
Source: Portuguese Population and Housing Censuses (INE), 2011 and 2021.
Cultural capital, proxied by educational attainment, exhibits a positive association with all three measures of territorial inequality and reaches statistical significance in each model. At first sight, this result may appear counterintuitive, since higher educational levels are usually associated with improved socioeconomic outcomes. However, at the territorial scale, the result may reflect a different process. More educated municipalities are also those that concentrate highly qualified occupations, dynamic labour markets, and attractive residential environments. Rather than reducing inequality, the territorial concentration of educational resources may, therefore, contribute to socio-spatial differentiation, reinforcing the separation between advantaged and disadvantaged territories. This interpretation is consistent with recent debates on metropolitan restructuring, gentrification, and the growing concentration of highly qualified populations in specific urban areas. In this context, educational attainment functions not only as an indicator of opportunity, but also as a marker of territorial differentiation and accumulated advantage.
Social capital, proxied by electoral participation, displays a negative association with all three measures of territorial inequality and reaches statistical significance in the Gini and Moran models. Municipalities characterised by higher levels of civic participation tend to exhibit lower concentration and weaker spatial clustering of low-qualified populations. Although the coefficient is not statistically significant in the Duncan model, the consistency of the estimated signs across all specifications suggests that civic engagement and participation in local public life may contribute to more balanced territorial structures. These findings are consistent with the interpretation of social capital as a collective resource that facilitates cooperation, strengthens local networks, and enhances the capacity of communities to respond to social and economic challenges.
Symbolic capital, measured through the proportion of prestigious socio-occupational categories, exerts a positive effect on all three dimensions of territorial inequality and is statistically significant in the Gini and Duncan models. Municipalities characterised by a stronger concentration of managers, professionals, and highly qualified occupations tend to display higher levels of concentration and segregation of low-qualified populations. This result suggests that symbolic hierarchies are not merely reflections of economic inequalities but constitute an additional mechanism through which socio-spatial differentiation is reproduced. Territories associated with prestige, status, and professional recognition tend to accumulate advantages that reinforce their social distinctiveness and increase the spatial distance separating them from less advantaged areas.
The temporal dummy variable (D2021) reveals an important transformation in the geography of inequality between 2011 and 2021. The coefficient is positive and statistically significant in the Gini model, indicating an increase in the concentration of low-qualified populations across municipalities. At the same time, the coefficient is negative and significant in the Duncan model, suggesting a reduction in segregation between low-qualified and more qualified populations. Moran’s I does not display a statistically significant temporal effect, indicating that the overall spatial clustering of disadvantage remained relatively stable.
Taken together, these results point to a complex process of territorial restructuring. Low-qualified populations became increasingly concentrated in a smaller number of municipalities, but these territories did not necessarily become more socially homogeneous. On the contrary, the reduction in the Duncan index suggests that different social groups increasingly coexist within the same municipalities. This pattern is consistent with the broader processes of metropolitan transformation observed in many European urban regions, where residential mobility, housing-market pressures, and demographic change simultaneously increase territorial concentration and internal social diversity (Mendes, 2021; Tammaru et al., 2016).
Overall, the results provide substantial support for the theoretical framework developed in this article. Territorial inequality appears to be systematically associated with the uneven spatial distribution of different forms of capital. Economic capital contributes to reducing concentration, segregation, and clustering, while symbolic capital reinforces socio-spatial differentiation. Social capital exerts a mitigating influence, favouring more balanced territorial structures, whereas cultural capital appears to operate as a mechanism of territorial differentiation rather than simple social advancement. These findings support a multidimensional understanding of spatial inequality that extends beyond conventional economic explanations. The geography of disadvantage cannot be understood solely through income differentials. Instead, it reflects the cumulative and spatially uneven distribution of economic resources, educational opportunities, civic engagement, and symbolic recognition. In this sense, the results are consistent with Bourdieu’s concept of social space as a structure organised around different forms of capital whose territorial concentration contributes to the reproduction of social hierarchies.
More broadly, the Portuguese case reflects dynamics that have been identified in several European metropolitan regions. The processes of economic restructuring, educational expansion, residential mobility, and social differentiation do not eliminate territorial inequalities; rather, they reconfigure their spatial expression. The observed increase in the concentration of low-qualified populations alongside the decline in segregation suggests that socio-spatial inequality is becoming simultaneously more concentrated and more internally complex (Massey and Denton, 1993). From a spatial justice perspective, this evolution raises important questions regarding access to opportunities, the territorial distribution of resources, and the capacity of public policies to prevent the cumulative concentration of disadvantage.
5. Conclusions
Socio-spatial inequalities are not randomly distributed across territory. They emerge from the interaction between historical patterns of development, labour-market structures, housing systems, public policies, and an unequal distribution of economic, cultural, social, and symbolic resources. The geography of inequality, therefore, provides a privileged window through which broader social hierarchies can be observed and analysed.
This article examined these dynamics through a multi-scalar analysis of low educational attainment and territorial inequality in Portugal, with particular attention to the Lisbon Metropolitan Area. Using the measures of concentration, segregation, and spatial autocorrelation, complemented by cartographic analysis and Generalized Maximum Entropy estimation, the study explored both the spatial distribution of disadvantage and the factors associated with territorial inequality. The results reveal a persistent territorial divide. At the national scale, populations with low educational attainment remain disproportionately concentrated in economically peripheral territories, reflecting the enduring legacy of historical inequalities in access to education and economic opportunities. At the same time, the analysis shows that this population remains numerically significant, representing more than a fifth of the Portuguese population, and, therefore, constitutes an important dimension of contemporary socio-spatial inequality rather than a residual phenomenon.
Within the Lisbon Metropolitan Area, the findings point to profound processes of metropolitan restructuring between 2011 and 2021. While longstanding territorial disparities remain visible, important changes have occurred within the city itself. Clusters of low-qualified populations previously located in central and historically working-class neighbourhoods have largely disappeared, while new concentrations have emerged in peripheral municipalities and border areas surrounding Lisbon. Simultaneously, highly qualified populations have expanded into central and riverside districts. These patterns are consistent with processes of gentrification, touristification, and housing-market restructuring that have transformed the social geography of Lisbon during the last decade.
The econometric results further reinforce the multidimensional character of territorial inequality. Economic capital, proxied by average wages, appears as the main factor associated with lower levels of territorial inequality. Social capital, measured through electoral participation, is also associated with lower levels of concentration and spatial clustering. By contrast, symbolic capital, represented by the share of prestigious occupations, is positively associated with inequality, suggesting that socio-spatial polarisation is reinforced where status hierarchies are more pronounced. Cultural capital displays a more complex effect, suggesting that educational expansion may simultaneously promote opportunities while reinforcing territorial differentiation.
Taken together, these findings support the argument that territorial inequality cannot be reduced to differences in income alone. Rather, it reflects the uneven spatial distribution of multiple forms of capital, and the cumulative advantages and disadvantages associated with particular places. The results, therefore, provide empirical support for a Bourdieusian interpretation of socio-spatial inequality, in which territory functions simultaneously as an outcome and a mechanism of social differentiation. From a policy perspective, the findings raise important questions concerning spatial justice and territorial cohesion. Housing-market dynamics, real-estate pressures, and uneven access to urban resources are contributing to the displacement of vulnerable populations towards peripheral locations, where access to employment, services, and opportunities is often more limited. Addressing these challenges requires not only redistributive policies, but also spatially sensitive interventions capable of reducing territorial disparities and ensuring more equitable access to the resources that shape life chances. Understanding where inequalities are located, how they evolve over time, and which forms of capital are associated with their reproduction remains a fundamental step towards building more inclusive and socially just territories.
Autorzy
REFERENCES
ANSELIN, L. (1995), ‘Local Indicators of Spatial Association—LISA’, Geographical Analysis, 27 (2), pp. 93–115. https://doi.org/10.1111/j.1538-4632.1995.tb00338.x
ARBACI, S. (2019), ‘Paradoxes of Segregation’, [in:] Paradoxes of Segregation, Wiley. https://doi.org/10.1002/9781118867365
BLANDEN, J., DOEPKE, M. and STUHLER, J. (2023), ‘Educational inequality’, [in:] HANUSHEK, E. A., MACHIN, S. and WOESSMANN, L. (eds), Handbook of the Economics of Education, 6, pp. 405–497, Elsevier. https://doi.org/10.1016/bs.hesedu.2022.11.003
BOURDIEU, P. (1986), ‘The forms of capital’, [in:] RICHARDSON, J., Handbook of Theory and Research for the Sociology of Education, New York: Greenwood, p. 241.
BOURDIEU, P. (1989), ‘Social space and symbolic power’, Sociological Theory, 7 (1), pp. 14–25. https://doi.org/10.2307/202060
BRANDÃO, A. and BRANDÃO, P. (2012), ‘Do industrial ao pós-industrial: transição e diversidade urbana-lx/bcn’, On the W@ Terfront, pp. 105–121.
CAPUTO, M. R. and PARIS, Q. (2008), ‘Comparative statics of the generalized maximum entropy estimator of the general linear model’, European Journal of Operational Research, 185 (1), pp. 195–203. https://doi.org/10.1016/J.EJOR.2006.12.031
CASTELLS, M. (1977), ‘The urban question: A Marxist approach’, [in:] (No Title). Edward Arnold.
FONSECA, M. (2017), ‘Southern Europe at a glance: Regional disparities and human capital’, In: Fonseca, M., Fratesi, U. (eds), Regional Upgrading in Southern Europe. Advances in Spatial Science, Cham: Springer, pp. 19–54. https://doi.org/10.1007/978-3-319-49818-8_2
GAGLIARDI, L. and PERCOCO, M. (2017), ‘The impact of European Cohesion Policy in urban and rural regions’, Regional Studies, 51 (6), pp. 857–868.
GOLAN, A., JUDGE, G. and MILLER, D. (1996), Maximum Entropy Econometrics: Robust Estimation with Limited Data (1st ed.), Wiley.
HARRIS, C. D. and ULLMAN, E. L. (1945), ‘The nature of cities’, The Annals of the American Academy of Political and Social Science, 242 (1), pp. 7–17.
HARVEY, D. (1973), Social justice and the city, 1, The Johns Hopkins University Press.
LEFEBVRE, H. (1992), ‘The Production of Space’ (D. Nicholson-Smith, Tran.), [in:] Urban Studies, Wiley-Blackwell.
LENOIR, R. (2004), ‘Espace social et classes sociales chez Pierre Bourdieu’, Societes Representations, 17 (1), pp. 385–396. https://doi.org/10.3917/SR.017.0385
LOGAN, J. R. and MOLOTCH, H. (1987), Urban fortunes: The political economy of place, University of California Press.
LOHRBERG, F., LIČKA, L., SCAZZOSI, L., TIMPE, A. and VERLAG, J. (2016), Urban Agriculture Europe, 38, Jovis Berlin.
MALHEIROS, J. (2002), ‘Ethni-cities: Residential patterns in the Northern European and Mediterranean metropolises - Implications for policy design’, International Journal of Population Geography, 8 (2), pp. 107–134. https://doi.org/10.1002/IJPG.247
MALHEIROS, J., CARVALHO, R. and MENDES, L. (2013), ‘Gentrification, residential ethnicization and the social production of fragmented space in two multi-ethnic neighbourhoods of Lisbon and Bilbao’, Finisterra, 48 (96), pp. 109–135. https://doi.org/10.18055/Finis3619
MALOUTAS, T. (2007), ‘Segregation, social polarization and immigration in Athens during the 1990s: Theoretical expectations and contextual difference’, International Journal of Urban and Regional Research, 31 (4), pp. 733–758. https://doi.org/10.1111/J.1468-2427.2007.00760.X
MASSEY, D. and DENTON, N. (1993), American Apartheid: Segregation and the Making of the Underclass, Harvard University Press, https://books.google.com/books/about/American_Apartheid.html?hl=pt-PT&id=uGslMsIBNBsC
MENDES, J. M. (2018), ‘Risco, Vulnerabilidade Social e Resiliência: Conceitos e Desafios’, Revista Gestão & Sustentabilidade Ambiental, 7, pp. 463–492.
MENDES, L. (2017), ‘Gentrificação turística em Lisboa: neoliberalismo, financeirização e urbanismo austeritário em tempos de pós-crise capitalista 2008-2009’, Cadernos Metrópole, 19, pp. 479–512.
MENDES, L. (2021), ‘Transnational gentrification and the housing market during pandemic times, Lisbon style’, Urban Geography, 42 (7), pp. 1003–1010. https://doi.org/10.1080/02723638.2021.1949832
MUSTERD, S., MARCIŃCZAK, S., VAN HAM, M. and TAMMARU, T. (2017), ‘Socioeconomic segregation in European capital cities. Increasing separation between poor and rich’, Urban Geography, 38 (7), pp. 1062–1083. https://doi.org/10.1080/02723638.2016.1228371
OECD. (2022), OECD Employment Outlook 2022, OECD, https://doi.org/10.1787/1bb305a6-en
PARK, R. E., BURGESS, E. W. and MCKENZIE, R. D. (1925), ‘The City’, [in:] University Press, Chicago, Chicago: University Press.
PERALTA, S., CARVALHO, B. P. and ESTEVES, M. (2021), ‘Portugal, Balanço Social 2020: Um retrato do paıs e dos efeitos da pandemia’, [in:] Nova School of Business and Economics, Social Equity Initiative. https://doi.org/10.34619/g5ko-pz3e
PUTNAM, R. D. (2000), Bowling alone: The collapse and revival of American community, Simon and Schuster.
SAUNDERS, P. (2003), Social theory and the urban question, Routledge. https://doi.org/10.4324/9780203393161
SOJA, E. W. (2010), Seeking spatial justice, 1st ed., 16, University of Minnesota Press.
TAMMARU, T., MARCIŃCZAK, S., VAN HAM, M. and MUSTERD, S. (eds) (2016), Socio-economic segregation in European capital cities, Routledge.
WACQUANT, L. (2007), Urban outcasts: A comparative sociology of advanced marginality (1st ed.), Polity.
WEBER, M. (1946), The ‘Rationalization’ of Education and Training, [in:] GERTH, H. H. and WRIGHT MILLS, C., From Max Weber: Essays in Sociology, p. 240.