
Evaluation of regional logistics performance for land freight along the developmental Syrian axis: Tartous – AlFarqulus
Kamal ALDAHHAK  *
*
Osama DARWISH *
Abstract. The study developed a spatial Decision Support System (DSS) to assess the impact of land freight logistics on regional development and create an evaluation map in a GIS environment. By designing a tri-level conceptual framework and applying the Fuzzy Analytic Hierarchy Process (FAHP), real stakeholders were involved at each evaluation level according to their roles. The system was integrated into GIS for final analysis and applied to the developmental Syrian axis of Tartous–Homs–Al-Farqulus using 2018 data. The results highlighted the importance of the relationships between evaluation criteria in identifying the role of freight logistics in regional planning and achieving broader developmental outcomes.
Key words: effectiveness, efficiency, differentiation, developmental reflections, sustainable development, Decision Support System.
1. Introduction
Logistics is vital to the value chain, ensuring efficient goods and service flow. Trade facilitation modernises procedures, addressing non-tariff barriers and institutional constraints in transport, energy, and ICT. The quality of logistics services, linked to transport infrastructure, directly affects cross-border shipping. Inefficiencies increase costs and hinder trade, underscoring the need to evaluate logistics and trade facilitation reforms in enhancing goods movement and fostering economic and sustainable development (Gul et al., 2024; Kareem, 2025).
Mobility is integral to economic and social development, enhancing accessibility by overcoming spatial constraints. Transportation mitigates physical, human, and administrative barriers through four key elements: modes (vehicles), infrastructure (roads, railways, airports, ports), superstructure (shorter-lifespan components), and networks (spatially structured systems). Flows represent the movement of people, goods, and information across these networks. Land freight, involving goods transport via equipped roads, underpins economic activities (Rodrigue, 2020). Both Kinra and Ülengin (2021) and Halimi et al. (2025) highlight the need for policymakers to assess land transport and logistics performance, considering long-term economic and developmental impacts. A comprehensive model is essential to integrate economic, social, and environmental assessments, ensuring equiTable resource distribution, poverty alleviation, and sustainable development. Rooted in management, engineering, and operations research, this interdisciplinary framework draws upon social sciences, including economics, political science, and sociology, to foster sustainable and resilient transport systems.
Conversely, logistics planning aims to develop a logistics strategy for transportation, storage, inventory management, and supply chain design, while considering legal, political, economic, social, technological, and resource factors to improve logistics performance (Waters, 2003). Therefore, we can define regional logistics planning as a set of studies related to logistics systems and their associated activities, logistical and natural resources, the spatial distribution of manufacturing and marketing facilities, population, infrastructure, and the various factors influencing them within a region. The goal is to determine the region’s potential and exploit it optimally within an appropriate logistical strategy that meets supply objectives, improves performance, stimulates sustainable and balanced development, and deals with the concerns of key stakeholders.
Logistics performance (LP) has been assessed on micro-scales using concepts derived from organisational performance, which cover a wide range of performance factors. It aims to achieve the seven logistics principles. Many researchers have developed conceptual frameworks to evaluate LP. For instance, Mansidão and Coelho (2014) cited the Arayman Model (2007), which had been used to analyse supply chains in food agriculture companies. This model emphasises flexibility (the ability of the supply chain to adapt to environmental changes), quality (ensuring product safety), efficiency (the appropriate use of resources), and responsiveness (meeting customer needs promptly, which implies dependability) (Bakar et al., 2014). Drašković (2009) introduced two models: the first by Moseng and Bredrup (1993), which focused on effectiveness (the ability to secure resources and achieve goals) and efficiency, and the second by Ferreira et al. (2007), which included quality, cost, time, and flexibility. Both studies concluded that effectiveness and efficiency are essential factors in evaluating LP (Fugate et al., 2010) added differentiation, which refers to providing the best net value to customers and is considered the highest level of performance. Furthermore, recent trends in performance evaluation have shifted towards sustainable performance, with strategies that cater to stakeholders and emphasize environmentally friendly logistics (Chardine-Baumann and Botta-Genoulaz, 2014). This shift has introduced new concepts in the field, such as “environment-friendlyˮ logistics (Fig. 1), summarise that.
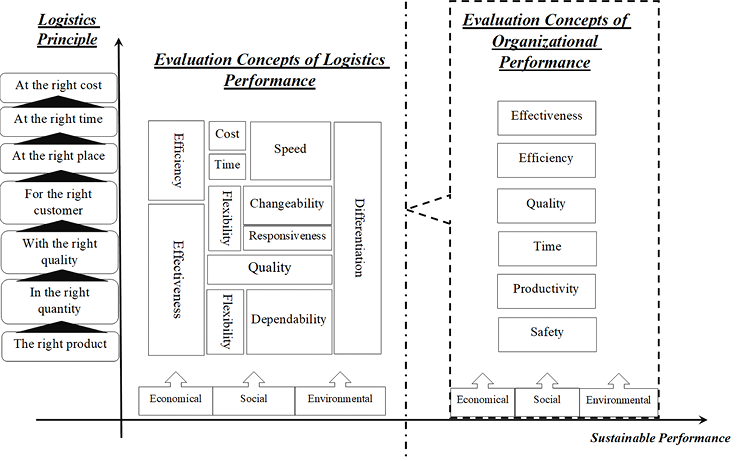
Source: own work based on Chardine-Baumann and Botta-Genoulaz (2014), and Fugate et al. (2010).
Therefore, at the macro level, evaluating logistics performance (LP) must consider all decisions and challenges related to land freight, which is described as multi-criteria (Żak et al., 2017). These challenges include determining the location of infrastructure (terminals, hubs, depots), selecting routes and designing transportation corridors, fleet management (composition, routing, scheduling, assignment, replacement), planning and designing transportation solutions (road/railway segments, elements of a transportation network), traffic control/management, transportation portfolio design and adjustment, transportation process management, and the assessment and implementation of transportation projects (Tavasszy and de Jong, 2014). All these must be addressed while considering local specificities and their impact on sustainable development, as discussed in numerous references such as Gudmundsson et al. (2016), Arvis et al. (2016), and Ecorys et al. (2015), summarized in Fig. 2. This paper addresses this research gap by applying LP concepts, which are defined as Key Performance Areas (KPAs). These KPAs serve as strategic tools providing the basis for a more detailed analysis of logistics performance at multiple levels, and they are measured using Key Performance Indicators (KPIs).
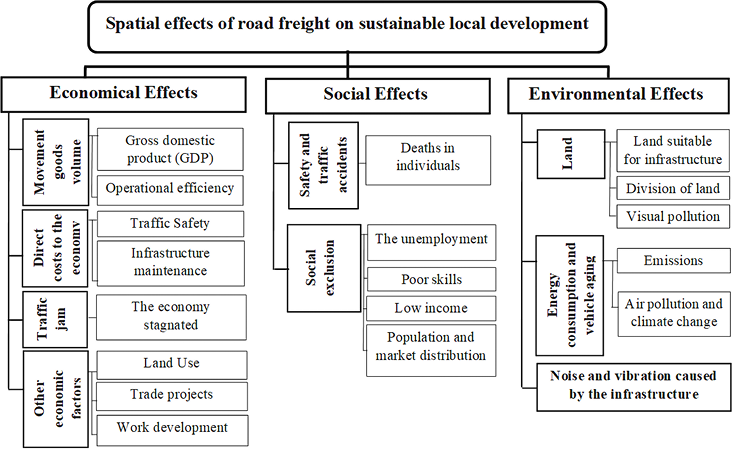
Source: own work based on Gudmundsson et al. (2016), Arvis et al. (2016), and Ecorys et al. (2015).
A Decision Support System (DSS) is a powerful tool that assists planners and decision-makers in analysing and visualising various scenarios to optimise decision-making. Users can import data via a graphical interface, conduct analyses, and compare outcomes through visual outputs. Spatial DSS, often integrated with Geographic Information Systems (GIS), addresses challenges in facility location, logistics, and transportation (Ryu et al., 2023). GIS provides a structured framework for acquiring, storing, analysing, and presenting geographic data, establishing a dynamic link between graphical and attribute data. This integration enhances efficiency in managing spatial and non-spatial data, facilitating informed decision-making (Quamar et al., 2023).
Consequently, this paper raises the following questions:
- How can a spatial methodology be developed that considers the spatial and local specificity of land freight hubs?
- How can this methodology demonstrate the spatial contribution of land freight activities at a regional level to sustainable development goals?
- How can this methodology provide decision-makers with the appropriate tools to evaluate the role of land freight hub logistics performance in promoting a regional development vision?
This paper aims to:
- Develop logistics performance evaluation indicators based on a sustainable development framework, and;
- Develop an analytical tool to produce spatial outputs, including operational indicators, stakeholders, reflections, and potentials, and apply it to the developmental Syrian axis of Tartous-Homs-AlFarqulus.
The importance of this paper stems from the Syrian Arab Republic’s low ranking in the World Bank’s 2016 Logistics Performance Index, where it was placed last, and the governments efforts to promote the selected axis as a local developmental hub in addition to its trading role.
2. Literature review
This section reviews studies on logistics performance, analysing the criteria employed in decision support systems (DSS) to assess or enhance logistics efficiency, along with the methodologies used.
The study by Oguz (2023) examined the logistics performance indicators of customs, infrastructure, international shipping, logistics service quality and competence, traceability and tracking, and on-time delivery for the top ten countries in the 2023 Logistics Performance Index (LPI). The goal was to rank these countries using Multi-Criteria Decision-Making (MCDM) methodologies and compare the results with the World Banks LPI study. The criteria and weights from the World Bank’s LPI were incorporated into the analysis. Methods such as the Technique for Order Preference by Similarity to Ideal Solution (TOPSIS) and the Evaluation Based on Distance from Average Solution (EDAS) were applied. The results showed that despite using identical criteria and weights, rankings varied across MCDM methods due to differences in computational strategies.
The study by Önden et al. (2023) proposed a multi-criteria spatial decision-making model for selecting optimal locations for new logistics centres in metropolitan Istanbul. A survey method was employed to gather insights from experts across various sectors, including Organized Industry Zones, Small Industry Sites, Major Gas Stations, Ports, Shipyards, Distribution Centres, Bonded Warehouses, Fresh Fruit and VegeTables Wholesale Market Halls, Road Transportation Distribution Warehouses, Container Warehouses, International Transportation Firms, Retail Distribution Centres, Manufacturing Distribution Centres, and Manufacturing Facilities. The study followed two main stages: first, defining and evaluating site selection criteria, which included access to supply and demand points, proximity to transportation networks (highways, railways, ports, and airports), expansion capabilities, geological suitability, infrastructure availability, land cost, and proximity to city centres. Second, alternative scenarios for site selection were analysed. Data were processed using the weighted average method through four scenarios: spatial suitability based solely on spatial criteria, overall suitability based on average expert ratings, and suitability based on different professional perspectives. Finally, the intersection tool was used to integrate the results and produce the final suitability map. The findings emphasize the importance of combining spatial and professional insights to determine optimal logistics centre locations, offering a replicable framework for large urban areas.
The study by Feng et al. (2023) developed a novel approach to emergency logistics centre (ELC) site selection by integrating Multi-Criteria Decision-Making (MCDM) methods and Geographic Information Systems (GIS). It identified nine critical criteria affecting ELC site selection: population density, proximity to highways, proximity to railways, proximity to infrastructure location, proximity to colleges and universities, proximity to expressway, proximity to Intersection, stay away from traffic jams, and proximity to Hospital. Spatial data for these criteria were collected, normalised, and analysed using GIS tools. The Entropy and CRITIC methods were employed to determine the weights of the criteria, combining information diversity and inter-criteria correlations. These weights informed the VIKOR method, which ranks potential ELC locations based on their proximity to the ideal solution. A case study in Xi’an, China, revealed population density as the most influential criterion (weight: 0.581). Among 13 alternatives, site A9, near the New City Plaza, ranked as the optimal location. Sensitivity analysis confirmed the stability of the results, while comparative analysis with the TOPSIS method validated the robustness of the proposed model. This study demonstrates the potential of combining GIS and advanced MCDM techniques to optimize emergency logistics planning in urban areas.
The study by Özceylan et al. (2016) evaluated logistics performance in Turkish provinces using three groups of criteria. Each group included secondary criteria: the first group, freight transaction factors, encompassed total freight transported by maritime, road, railway, and air; the second group, transportation capability factors, included the number of commercial motor vehicles, total length of highways, and proximity to provincial centres (railways, ports, airports, and border gates); the third group, economic and infrastructure factors, included import and export values, and proximity to provincial centres (free zones, freight villages, industrial zones). The study applied a multi-criteria decision-making methodology using five scenarios: the analytic hierarchy process (AHP) to calculate the weights of criteria, the analytic network process (ANP) to consider relationships between criteria, and the Technique for Order Preference by Similarity to Ideal Solution (TOPSIS) to rank alternatives from worst to best. Variants of AHP-TOPSIS, ANP-TOPSIS, and TOPSIS with equal weights were also used.
The study by Srisawat et al. (2017) developed a Decision Support System to evaluate the spatial efficiency of regional transportation logistics. Five main criteria were used, each containing secondary and sub-criteria. The first criterion, location, included landscape (slope, elevation), connection to transportation hubs, and natural disasters. The second criterion, infrastructure, covered road, rail, ship, and air transportation, multimodal transport preparedness, cargo volumes, basic utilities (electricity, water supply), information technology infrastructure, and personnel knowledge. The third criterion, the economic system, included traditional products (Gross Provincial Product, number of factories), land use (urban, forest, agriculture), population, and economic units. The fourth criterion, logistics agencies, addressed the number of logistics agencies, while the fifth criterion, supportive policies and projects, included logistics projects, government and private sector policies, and international cooperation projects. This study used the fuzzy analytic hierarchy process (FAHP) to account for uncertainty when assigning weights to criteria.
As shown in Table 1, the following research gap can be identified from the previous literature:
- The conceptual frameworks of previous studies lacked the flexibility to encompass all aspects of logistics and sustainable development. This limitation restricted their ability to establish new spatial and local specificity criteria for emerging logistics studies. Furthermore, they overlooked critical dimensions necessary for achieving sustainable performance.
- Even in studies that incorporated sustainable development criteria, there was no explicit linkage to the Sustainable Development Goals (SDGs), which constrained their ability to align with the global 2030 agenda for sustainable development.
- Additionally, prior research did not present a clear methodology for engaging all relevant stakeholders or defining their roles in the evaluation and decision-making processes. This omission, whether in conceptual frameworks or applied methodologies, represents a significant gap in regional logistics planning.
- Although various Multi-Criteria Decision-Making (MCDM) models have been employed, the primary challenge lies in selecting a model capable of addressing the existing limitations, offering a comprehensive understanding of the impacts of logistics performance on development, and ultimately revealing both opportunities and implications.
| brak danych |
Study |
Oguz (2023) | Önden et al. (2023) | Feng et al., (2023) | Özceylan et al. (2016) | Srisawat et al. (2017) |
|---|---|---|---|---|---|---|
| Conceptual Framework | Logistics Concepts Changeability |
- | - | - | - | + |
| Logistics Concepts Reliability |
+ | - | - | - | + | |
| Logistics Concepts Quality |
+ | + | + | + | + | |
| Logistics Concepts Flexibility |
+ | + | + | + | + | |
| Logistics Concepts Effectiveness |
+ | + | + | + | + | |
| Logistics Concepts Efficiency |
+ | + | + | + | + | |
| Logistics Concepts Cost, Time, Speed |
+ | + | + | + | + | |
| Logistics Concepts Differentiation |
+ | - | - | - | + | |
| Developmental Concepts Economic |
- | + | + | + | + | |
| Developmental Concepts Social |
- | - | + | - | + | |
| Developmental Concepts Environmental |
- | - | + | - | - | |
| Developmental Concepts Connections with SDGs |
- | - | - | - | - | |
| Methodology |
The MCDM using Weighting of criteria |
World Bank | Weighted Average | Entropy | AHP | FAHP |
| CRITIC | ANP | |||||
|
The MCDM using Preferences |
EDAS | - | VIKOR | TOPSIS | - | |
| TOPSIS | ||||||
| The MCDM using Scenarios |
- | + | - | + | - | |
| brak danych | Participation of stakeholders Service providers |
+ | + | - | + | - |
| Participation of stakeholders Service beneficiaries |
- | + | - | - | - | |
| Participation of stakeholders Experts in Development |
- | - | + | + | + |
Source: own work.
3. Methodology
This methodology adopts a structured approach, integrating multi-criteria decision-making with GIS-based spatial analysis in five steps (Fig. 3), ensuring a robust assessment of logistics performance and its impact on regional development.
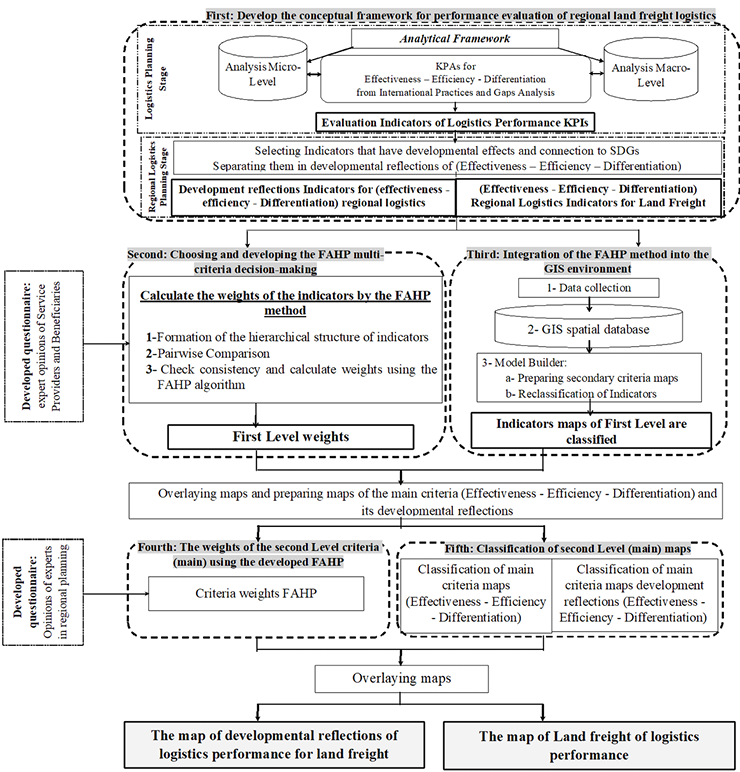
Source: own work.
3.1. First: Developing a conceptual framework for the performance evaluation of regional land freight logistics
The study of concepts at both the micro-level and macro-level aids in identifying Key Performance Area (KPAs) and their corresponding secondary indicators, known as Key Performance Indicator (KPIs). The study by Bakar et al. (2014) evaluated LP on a national scale using effectiveness (quality, flexibility, dependability, connectivity) and efficiency (cost, speed, environmental impact). The study by Sutomo and Soemardjito (2012) assessed port logistics on regional effectiveness through spatial systems and transportation systems and regional efficiency through operational costs and logistics costs. Ecorys et al. (2015) evaluated national LP through efficiency, effectiveness, costs, environmental sustainability, employment, safety, and security. The World Bank study by Arvis et al. (2016) highlighted service quality and reliability as primary LP goals.
In comparison with micro-level concepts, it was observed that flexibility, dependability, and connection relate to effectiveness, while cost, speed, and environmental impact relate to efficiency. Differentiation, as defined by Fugate et al. (2010), represents the highest level of LP by providing innovation and added value. Environmental sustainability and employment development through logistics education also support this approach. Therefore, LP on a macro-level can be evaluated using the framework proposed by Fugate et al. (2010), focusing on effectiveness, efficiency, and differentiation, which will serve as the foundation for developing a DSS for regional LP evaluation. This framework was developed in two stages:
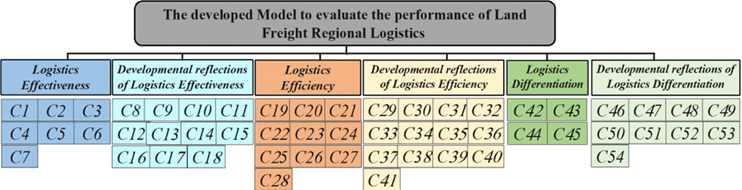
- Logistics planning stage: In this stage, KPIs were selected based on KPAs that align with the seven logistics principles. Consequently, this phase is classified as the logistics planning stage, as shown in Table 2, with Fig. 4 summarising the results of this stage.
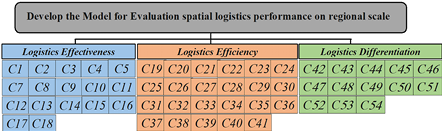
Fig. 4. Results of KPIs for evaluation LP on regional scale
Source: own work. - Regional logistics planning stage: Based on the impacts of goods transportation on sustainable development, as illustrated in Fig. 2, the first-level indicators were identified and further divided into developmental reflections for effectiveness, efficiency, and differentiation at the second level. These were then classified as the developmental reflections for logistics performance (LP) at the third level, as shown in Fig. 5. Since these developmental reflections are connected to the sustainable development goals that regional planning aims to achieve, this stage is categorised as the regional logistics planning stage.
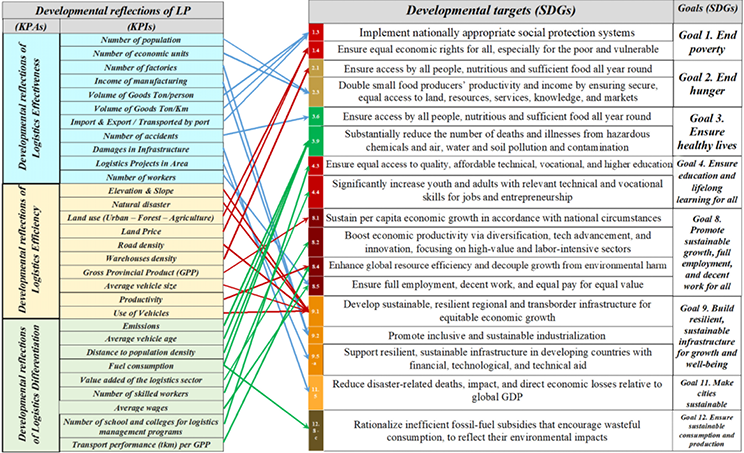
Additionally, the first-level indicators were aligned with the targets and goals of the Sustainable Development Goals (SDGs), thereby linking the second and third levels to these objectives, as demonstrated in Fig. 6.
Source: own work.
Source: own work.
3.2. Second: Choosing and developing the FAHP multi-criteria decision-making (MCDM)
Based on the methodology developed by Wątróbski (2016) for selecting a suiTable MCDM approach in the logistics sector, the following can be concluded:
- Alternatives (the study area) can be compared.
- The criteria will have varying weights.
- The criteria weights will be expressed quantitatively.
- Criteria comparisons will be made using a pairwise comparison matrix.
- Each alternative is connected to all criteria and will be ranked on a quantitative scale.
Thus, the Fuzzy Analytical Hierarchy Process (FAHP) was chosen as the MCDM method for this paper. The Analytical Hierarchy Process (AHP) is a method used to determine the importance of goals/criteria through pairwise comparisons, while fuzzy logic is applied to address decision-making in situations of uncertainty. To implement FAHP, the following steps, as outlined by Awad et al. (2014), were followed:
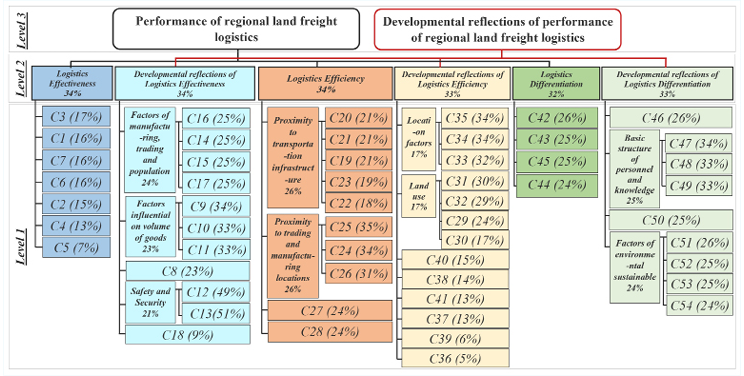
- Structuring the decision problem in a hierarchical form (analysing goals and their components). A key aspect of this method is ensuring that the number of criteria in each comparison matrix ranges between 2 and 7, with a maximum of 9. In special cases, the number of criteria may extend to 10−11, but this is not recommended. If the number of criteria is too large, it is advisable to aggregate some criteria, redefine their scope, or use alternative formulas (Żak et al., 2017). Consequently, criteria for the first level were aggregated, as shown in Fig. 7.
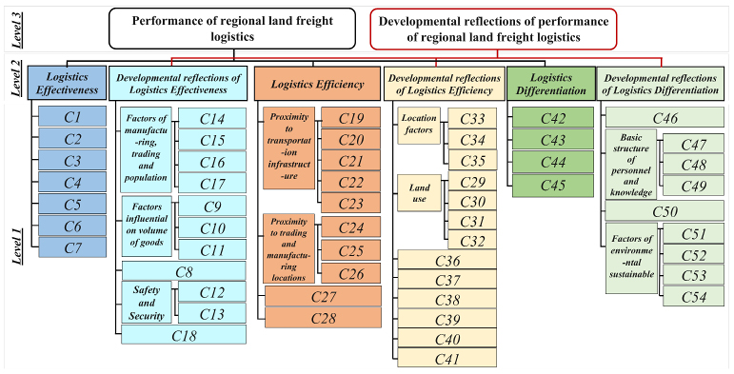
Fig. 7. Hierarchy structure for criteria of study according to FAHP
Source: own work. - Conducting pairwise comparisons between criteria by experts based on the Saaty scale. To enhance this step, Carvalho et al. (2015) noted that effectiveness reflects the interests of those who benefit from the freight service, while efficiency reflects the interests of those providing the service. Therefore, the first-level survey for effectiveness was conducted with experts from the Chamber of Commerce, Industry, and Agriculture in the study area, and efficiency was evaluated by experts from the goods freight office. Differentiation, being the highest degree of logistics performance (LP), was surveyed with all the mentioned stakeholders.
- The survey results were checked using the Consistency Index (C.I.) and Consistency Ratio (C.R.). The pairwise comparison matrix was then converted to a fuzzy format using Fuzzy Triple Numbers according to the Saaty scale for each expert. Afterward, the fuzzy decision matrices for each group of experts were aggregated, and the final weights were calculated using the FAHP algorithm, as described by Chang (1996).
3.3. Third: Integration of the FAHP method into the GIS environment
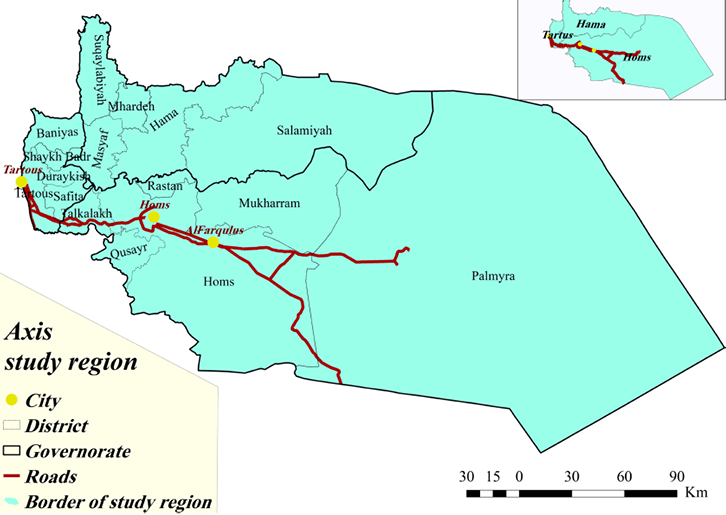
The axis study region, which includes the Syrian governorates of Hama, Homs, and Tartous, was selected as shown in Fig. 8 due to the availability of relevant data on this scale. Spatial and statistical data for the studys indicators were collected from various sectors, including the Central Office of Statistics, Ministry of Transportation, Ministry of Industry, Ministry of Agriculture, Ministry of Trade, and the Ministry of Communication and Technology. Additionally, open data sources such as the International Energy Agency (IEA), Shuttle Radar Topography Mission (SRTM), OpenStreetMap (OSM), Global Map Data Archives, and Global Surface Water Explorer were utilized. The necessary indicators were then calculated as shown in Table 3.
| First Level Indicators | Method of calculating | Meaning of symbol |
|---|---|---|
| National Transportation System (Sreelekha et al., 2016, p. 133) |
Needed Spatial Network Analysis α = (e – v + p) ⁄ (2v – 5) (1) p = e – v + 1; β = e ⁄ v (2) γ = e ⁄ (3(v – 2)) (3) η = L(G) ⁄ e (4) |
e: number of edges in the network v: number of vertices in the network L(G): total network length in km p: number of subgraphs |
| Speeds on roads (Nagne et al., 2013) and (Kofi, 2010, p. 16) |
η = L(G) ⁄ e (5) | e: number of edges in the network L(G): total network length in km |
| Productivity | Volume of goods Tkm / number of trucks | – |
| Use of vehicles | Used volume of trucks / All volume Available | – |
| Transportation performance (Tkm) per GPP | Volume of goods Tkm / GPP | – |
Source: own work.
Source: own work based on Syrian Ministry of Local Administration Data 2018.
- A spatial database was created (Point – Polygon – Polyline – Raster) and was connected with collected data and indicators calculated according to its scale available.
- By using Model Builder in Arc Map 10.2.2, it was built the same first level of hierarchy structure in FAHP with suiTable spatial analysis tools in Table 4. Therefore, there were six models in Model Builder (Logistics Effectiveness – Developmental Reflections of Logistics Effectiveness – Logistics Efficiency – Developmental Reflections of Logistics Efficiency – Logistics Differentiation – Developmental Reflections of Differentiation Logistics), then there were:
- Indicators Maps for First Level
- Reclassified them on a scale from 1 to 10
Source: own work.
The Weighted Sum tool overlays classified maps with their weights, which depends on the (Eq 6) (Srisawat et al., 2017):
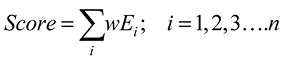 (6)
(6)
Where: Score is the overall Indicators score, wi is the additive weight of criterion i and the total of weight value is equal to 1, Ei is the Indicators score (1 to 10) of criterion i, and n is the number of criteria considered in the decision-making process.
As a result of that, we will have criteria for the second level.
3.4. Fourth: The weights of the second level criteria (main) using the developed FAHP
By using FAHP, the weights were calculated, and to develop this step, because this step represents the stage of regional logistics planning, the survey was done with experts in regional planning.
3.5. Fifth: Classification of second level (main) maps
The results of seventh Model Builder was formed where were reclassified the resulting criteria from overlying second and third level as a spatial analysis in this model on scale 1 to 10.
Source: own work.
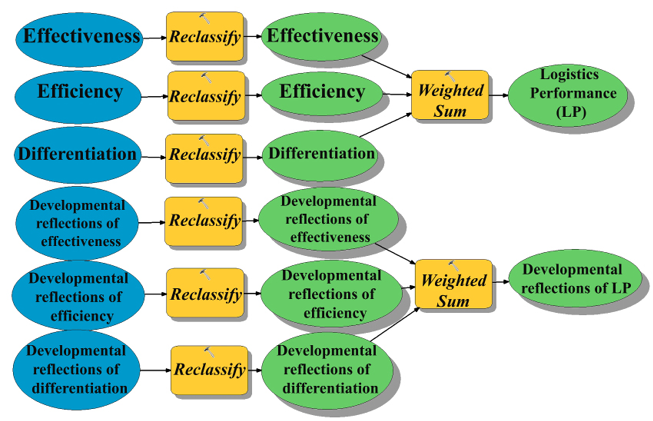
As a final step, the weights in the fourth step were overlaid with reclassified maps in the fifth step using Weighted Sum tools, with consideration that the sum of Effectiveness, Efficiency and Differentiation were equalled Logistics Performance index, while the sum of Developmental Reflections of Effectiveness, Developmental Reflections of Efficiency and Developmental Reflections of Differentiation were equalled developmental reflections of Logistics Performance index what consistent with the base hierarchy structure in Fig. 9.
For discussion purposes, the results of the second and third levels were reclassified as shown in Table 5 by taking advantage of study a by Srisawat et al. (2017).
| Criteria Degree | Reclassified Degree | Colour |
|---|---|---|
| < 5 | Low | Red |
| 57 | Medium | Orange |
| 78 | High | Light Green |
| > 8 | Very High | Dark Green |
Source: own work based on Srisawat et al. (2017).
4. Results
This study makes a significant contribution by introducing an innovative approach to evaluating regional logistics performance. By integrating FAHP with GIS, it provides a spatial analysis of logistics indicators. The findings show that logistics is crucial for spatial development, with generated maps revealing spatial variations that impact economic, social, and environmental patterns. The results show that regions with high logistics efficiency benefit from equiTable resource distribution, lower costs, and improved service quality, fostering sustainable development. In contrast, areas with poor logistics performance face market access limitations, high transportation costs, and weak infrastructure integration, hindering progress.
The study confirms that logistics indicators are essential tools for regional planning. By integrating FAHP with spatial mapping, it links logistics performance to Sustainable Development Goals (SDGs 1, 2, 3, 4, 8, 9, 11, and 12). Enhancing logistics in urban and rural areas boosts economic competitiveness, trade efficiency, industrial balance, and resource optimisation.
Logistics is not just operational but a key element in spatial development. Infrastructure distribution, trade corridor connectivity, and transport facility density shape balanced development. Investing in integrated logistics services enhances economic efficiency, social equity, and environmental sustainability.
This study provides a spatial framework to assess logistics’ impact on sustainable development, helping policymakers identify infrastructure needs to strengthen economic competitiveness and resource sustainability.
This section outlines the sequence of extracting and interpreting the results based on the methodological steps.
4.1. Results of applying FAHP for first and second criteria level
For effectiveness and its developmental reflections, the FAHP was applied to the first-level criteria with the input of three experts from each of the Chambers of Agriculture, Industry, and Trade in the study area, which includes the governorates of Tartous, Homs, and Hama. This involved a total of nine experts.
For efficiency and its developmental reflections, the FAHP was applied to the first-level criteria with three experts from the Goods Freight Office in each of the governorates of Tartous, Homs, and Hama, involving a total of nine experts as well.
For differentiation and its developmental reflections, the FAHP was applied to the first-level criteria with three experts from each Chamber of Agriculture, Industry, and Trade, as well as from the Goods Freight Office in each of the governorates of Tartous, Homs, and Hama, making a total of twelve experts.
At the second level of criteria, a survey was conducted to obtain the weights from five experts in regional planning.
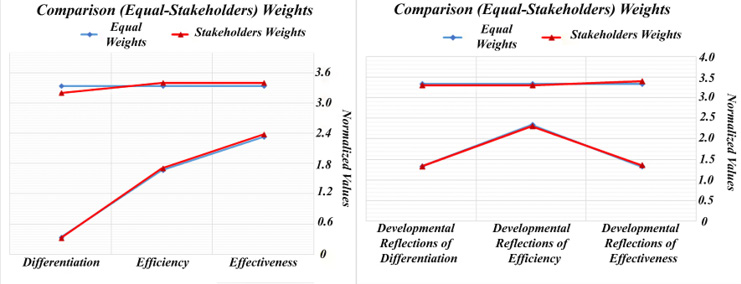
As shown in Table 6, the majority of experts prefer effectiveness over efficiency and differentiation, followed by efficiency over differentiation, which is consistent with their developmental reflections. In other words, experts prioritise effectiveness first, followed by efficiency and then differentiation. They also prioritise the developmental reflections of effectiveness, then efficiency, and finally differentiation.
| Saaty Scale | 1 | 2 | 3 | 4 | 5 | 6 | 7 | 8 | 9 |
|---|---|---|---|---|---|---|---|---|---|
| Logistics Performance Effectiveness with Efficiency |
20% | brak danych | 20% | 40% | 20% | brak danych | brak danych | brak danych | brak danych |
| Logistics Performance Effectiveness with Differentiation |
brak danych | brak danych | brak danych | 40% | brak danych | 40% | 20% | brak danych | brak danych |
| Logistics Performance Efficiency with Differentiation |
brak danych | 20% | 40% | 20% | 20% | brak danych | brak danych | brak danych | brak danych |
| Developmental Reflections Of Effectivenesswith Efficiency |
brak danych | brak danych | 60% 20% |
20% | brak danych | brak danych | brak danych | brak danych | brak danych |
| Developmental Reflections Of Effectiveness with Differentiation |
brak danych | 20% | 20% | brak danych | 20% | 20% 20% |
brak danych | brak danych | brak danych |
| Developmental Reflections Of Efficiency with Differentiation |
20% | brak danych | 40% 20% |
20% | brak danych | brak danych | brak danych | brak danych | brak danych |
Black shows experts preferring first over second
Red shows experts preferring second over first
Source: own work.
On the other hand, it is observed that the majority of experts assigned higher scores to the developmental reflections of effectiveness on Saaty’s scale compared to the developmental reflections of efficiency. In other words, they prefer the developmental reflections of effectiveness over effectiveness itself. Similarly, when comparing other indicators, it is observed that experts prefer efficiency over its developmental reflections, while they favour the developmental reflections of differentiation over differentiation itself. This gives the initial vision about stakeholders’ opinions, which is finally reflected in Fig. 10, showing the results for both the first and second criteria levels after applying the fuzzy method.
Source: own work.
4.2. Results of integration FAHP in a GIS environment
Using Model Builder, after performing spatial analysis, Criteria Maps for the First Level were generated. These maps were then reclassified on a scale from 1 to 10. The reclassified maps were overlaid with their respective weights for the six models, resulting in Indicator Maps for the Second Level, as shown in Fig. 11.
The second-level criteria maps, as shown in Fig. 12 were reclassified on a scale from 1 to 10. A value of 0 indicates no spatial value for the indicators. The adopted colour scheme for the values is as follows: grey for 0, red for 1, purple for 2, blue for 3, light blue for 4, black for 5, yellow for 6, light green for 7, orange for 8, dark yellow for 9, and fir green for 10.
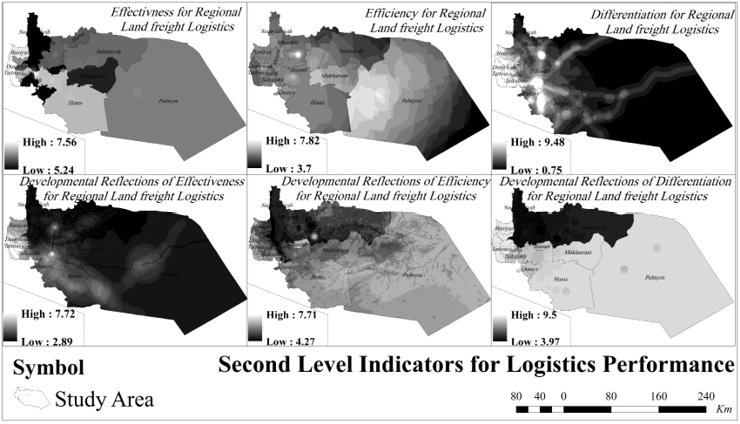
Source: own work based on the results of the analysis of first-level indicators based on 2018 data.
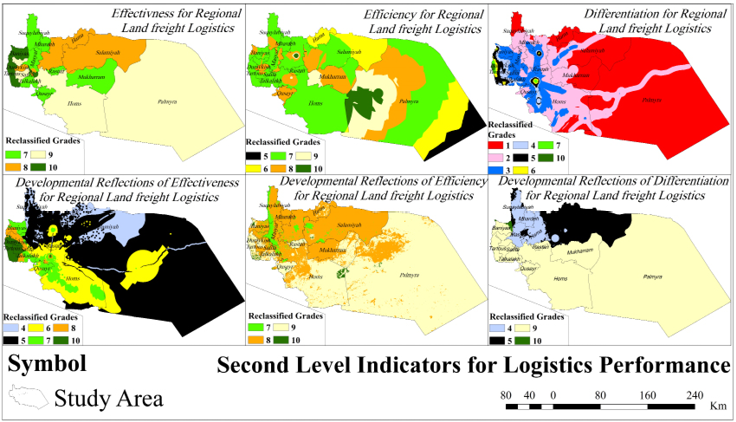
Source: own work based on the reclassification of the maps in Fig. 11 on a scale from 1 to 10.
Finally, the maps were overlaid with their respective weights for the six models, resulting in the third-level Indicators Maps, as shown in Fig. 13 which were reclassified on a scale from 1 to 10 as well.
Source: own work based on the analysis results of second-level indicators, then reclassified on a scale from 1 to 10.
4.3. Final results and interpretation
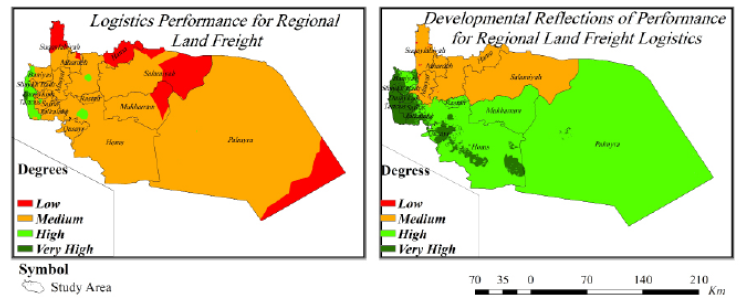
The maps from the second and third levels, shown in Fig. 12 and Fig. 13 were reclassified based on Table 5 for interpretation purposes, leading to the production of Fig. 14 and Fig. 15. Thus, from Fig. 14:
For Effectiveness and its developmental reflections: there is a spatial correlation and agreement between the locations with high levels of effectiveness and their corresponding developmental reflections. Notably, in larger areas with a high degree of effectiveness, there are pockets displaying medium to high levels of development. In contrast, smaller areas with high effectiveness are associated with pockets exhibiting a range of low to medium to high levels of development. This highlights the dynamic impact that the availability of logistics resources has on operational factors and regional development plans. Conversely, the effectiveness contribute in SDGs 1, 2, 3, 8, 9, and 11 by low to medium to high levels.
For efficiency and its developmental reflections: the spatial effects were observed in both proximate and distant locations. For instance, in the eastern part of Palmyra, the limitations of efficiency in that area have reduced the influence of high-degrees for developmental reflections, resulting in small, medium-to-high pockets on its periphery. Similarly, in the Hama governorate, the retreat of high-efficiency degrees led to lower levels of development in the western and southern areas, with no high-development pockets appearing at all. Conversely, the stability of medium-efficiency degrees in the governorates of Tartous and Homs contributed to the formation of medium-to-high development pockets. This suggests that the good spatial organisation of logistics resources, such as infrastructure and facilities, plays a significant role in fostering positive developmental outcomes. also efficiency contribute in SDGs 1, 2, 8, and 9 reached low to medium to high levels.
For differentiation and its developmental reflections: the effects of spatial disparity in differentiation degrees are evident in both their local and distant developmental reflections. In the Hama governorate, the smallest area with medium differentiation degrees resulted in low developmental reflections. In contrast, the Homs governorate displayed high to very high developmental reflection degrees due to the greater prevalence of medium differentiation degrees compared to Hama. Conversely, the Tartous governorate exhibited the best developmental reflection degrees, owing to its highest differentiation degrees. This indicates the dynamic and significant impact that factors like added value and innovation have on achieving sustainability, aligning with the idea that differentiation represents the highest level of effectiveness and efficiency, also for differentiation SDGs 3, 4, 8, and 12 reached low to high to very high levels.
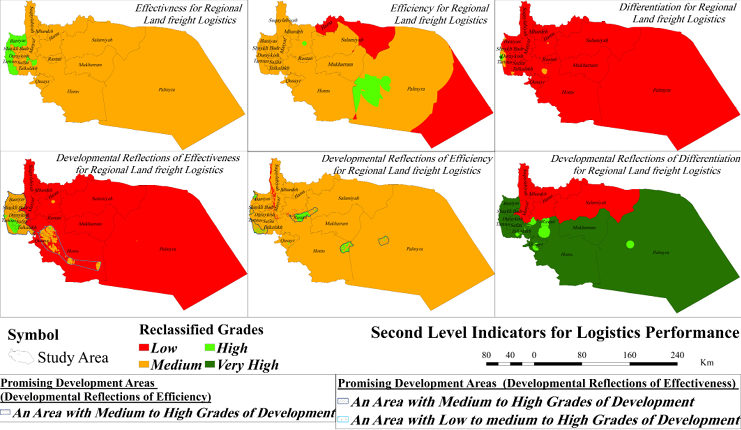
Source: own work based on the reclassification of the maps in Fig. 11 on a scale from Low to Very High.
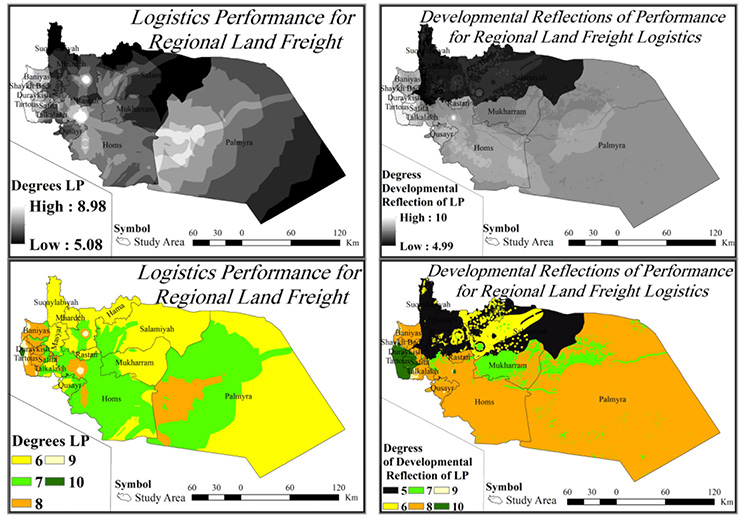
For the results of Logistics performance and its developmental reflections: as most studies agree that it is primarily linked to effectiveness and efficiency. While these two concepts share mutual interests, they often involve conflicting or mutually exclusive factors, which is why they were assigned the highest weights. As shown in Fig. 14, the locations of high effectiveness and high efficiency did not coincide, reflecting their inherent opposing features. Meanwhile, spatial differentiation reflects characteristics related to the superiority of activities over competitors.
Since the indicators of developmental reflections are derived from performance indicators, these conflicting features were also observed spatially in the developmental reflections of effectiveness, efficiency, and differentiation. In areas with high degrees of effectiveness, resources tend to be wasted, resulting in operational goals being achieved without reducing costs, efforts, or time. In contrast, locations with high efficiency strive to achieve optimal results but may fall short. As for differentiation, the results indicate a lack of resources for innovation and added value, leading to issues with the spatial variation of sustainability.
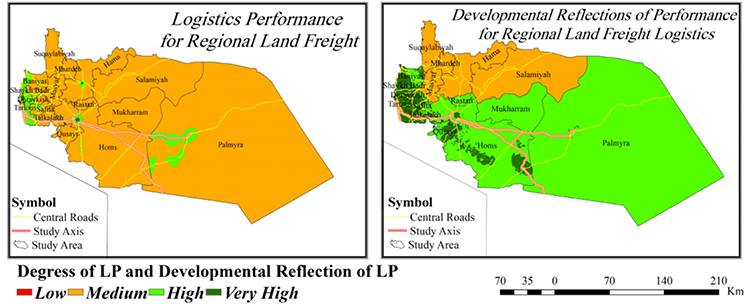
As shown in Fig. 15, the study axis passes through the areas with the best logistics performance, concentrated in logistics nodes in the Tartous and Homs governorates. This axis demonstrated high to very high degrees of developmental reflections along its length, with the Tartous governorate showing consistently high to very high degrees transversely. In contrast, the Homs governorate exhibited high to very high degrees, gradually decreasing to medium levels towards Hama, where the developmental reflections were only low to medium due to the reduced logistics performance compared to Homs and Tartous.
Thus, the spatial contribution of the developmental reflections of Logistics Performance in SDGs 1, 2, 3, 4, 8, 9, 11, and 12 reached degrees ranging from low to medium to high to very high.
Source: own work based on the reclassification of the maps in Fig. 13 on a scale from Low to Very High.
5. Sensitivity analysis
Following the methodology from Özceylan et al. (2015), two sensitivity analyses were conducted: one using equal weights and the other by exchanging weights, as described below:
5.1. Sensitivity analysis with equal weights
When equal weights (i.e., no weights applied) were assigned to the second-level criteria, as shown in Fig. 16 and compared with the results in Fig. 14, the following observations were made:
Source: own work based on the analysis results of second-level indicators without weights, then reclassified on a scale from Low to Very High.
As shown in Fig. 17, the opinions of regional planning experts led to the maximisation of spatial values for approximately 67% of the upper limits of logistics performance indicators and about 33% of the upper limits of the developmental reflections of logistics performance indicators.
As shown in Fig. 16, when applying equal weights, there was an increase in low degrees of logistics performance (LP) and a decrease in high and very high degrees. This indicates that local experts are largely satisfied with the current situation in these locations.
Regarding the developmental reflections of LP, the results closely matched the initial findings, suggesting that the experts’ opinions align well with the actual situation in the region.
Source: own work.
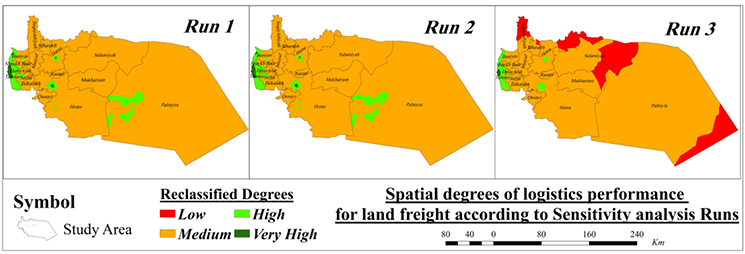
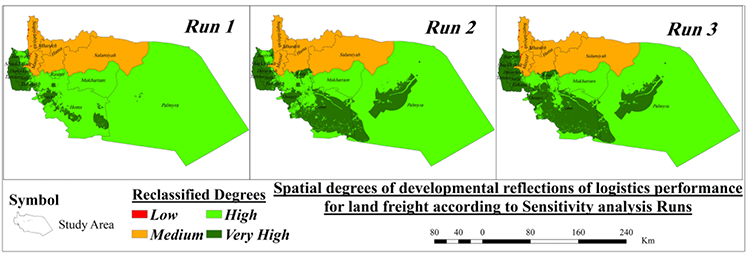
5.2. Sensitivity analysis by exchanging weights
In this analysis, the weights of the criteria were adjusted to evaluate the impact on logistics performance. Run 1 represents the base run, which reflects the evaluation of logistics performance according to the perspectives of local stakeholders.
By exchanging the weight of the first criterion with the second criterion, we obtained Run 2. Similarly, by exchanging the weight of the first criterion with the third criterion, we obtained Run 3, as illustrated in Table 7.
| Sensitivity Runs for LP | Sensitivity Runs for developmental reflections of LP | ||||||
|---|---|---|---|---|---|---|---|
| Criteria | Run 1 | Run 2 | Run 3 | Criteria | Run 1 | Run 2 | Run 3 |
| Effectiveness | 34% | 34% | 32% | Developmental reflections of effectiveness | 34% | 33% | 33% |
| Efficiency | 34% | 34% | 34% | Developmental reflections of efficiency | 33% | 34% | 33% |
| Differentiations | 32% | 32% | 34% | Developmental reflections of differentiations | 33% | 33% | 34% |
| Sum | 100% | 100% | 100% | Sum | 100% | 100% | 100% |
Source: own work.
Source: own work based on the analysis results of second-level indicators (Logistics Performance) using exchange weights, then reclassified on a scale from Low to Very High.
Source: own work based on the analysis results of second-level indicators (Developmental Reflections of Logistics Performance) using exchange weights, then reclassified on a scale from Low to Very High.
As illustrated in Fig. 18, the results of the sensitivity analysis for Logistics Performance (LP) reveal that the high and very high degrees of LP around the centres of Tartous, Hama, and Homs decreased in Run 3 compared with Run 2 and Run 1. This reduction indicates that the lower degrees of differentiation (which had the highest weight) negatively impacted LP more than effectiveness and efficiency. This outcome aligns with the results shown in Fig. 12.
Similarly, as shown in Fig. 19, the sensitivity analysis for developmental reflections of logistics performance demonstrates that the low degrees of developmental reflections in the Hama governorate disappeared in Run 2 compared with Run 1 and Run 3. This suggests that the better degrees of efficiency in Hama (when weighted with the highest importance) had a more significant positive impact compared to effectiveness and differentiation. This also corresponds with the results in Fig. 12.
This analysis provides a valuable tool for the decision-maker in the model, facilitating the feedback process and supporting decision-making by enabling the identification of spatial weaknesses and potentials without the need to review sub-maps.
6. Discussion
The final results derived from Fig. 14 align with the qualitative analysis of expert opinions in Table 6. Experts identify resource provision, represented by effectiveness, as the most critical logistical factor lacking corresponding developmental outcomes. They emphasise the necessity of well-structured spatial organisation of infrastructure, denoted by efficiency, which ranks second. When achieved, it fosters appropriate development. In contrast, achieving developmental excellence ranks third due to Syrian war-related constraints, underscoring the validity of expert opinions within the model.
The proposed conceptual framework offers adaptability for integrating additional indicators, provided their data is available. It applies to various developmental logistical studies while maintaining consistency with planning levels (national, regional, structural, or local), contingent on measurable indicators at each level.
The FAHP method enabled the decomposition of complex decision problems into hierarchical sub-criteria, effectively integrating both quantitative and qualitative data through expert-weighted maps. However, a key limitation is the required sample size of 5–12 indicators per group and the limited number of experts, necessitating the use of fuzzy theory to address ambiguity in expert opinions during weighting (Żak et al., 2017; Srisawat et al., 2017). Sensitivity analysis provided critical insights for decision-making: equal-weight sensitivity analysis identifies results independent of expert-assigned weights, serving as a benchmark for expert satisfaction, while weight-exchange sensitivity analysis highlights strengths and weaknesses across sub-indicators without requiring model reassessment (Özceylan et al., 2015).
The land freight logistics decision support system plays a crucial role in implementing the regional plan by identifying areas for improvement, needs, and available capacities. The 2018 data timeframe is linked to the completion and approval of the regional study for the designated area in Syria, covering a 10–15-year period and six phases: policy formulation, diagnosis and data analysis, planning (designing the plan), resource mobilisation, programming and implementation, and plan evaluation. Data and expert surveys must be updated during the diagnosis and evaluation phases, where the proposed decision support system should actively contribute (Syrian Regional Planning Commission, 2021).
7. Conclusions and recommendations
The developed methodology, based on Key Performance Areas (KPAs) for selecting secondary indicators, offers a comprehensive approach for evaluating logistics performance. The application of Fuzzy Analytical Hierarchy Process (FAHP) enabled the analysis of both quantitative and qualitative data, while organising the decision-making process hierarchically. Additionally, the inclusion of stakeholders’ preferences, derived from understanding the roles of effectiveness, efficiency, and differentiation, enriched the evaluation process.
Using GIS techniques, this study identified the strengths, weaknesses, opportunities, and needs of each spatial location, which can enhance logistics operations and foster economic revitalisation through balanced resource distribution and innovation. The analytical tool developed here provides insights into the dynamic, dramatic, or mixed effects of logistics resource allocation and innovation factors on sustainable logistics operations. Furthermore, it revealed the longitudinal and transverse developmental impacts of the freight axis in the region and the spatial contributions of Logistics Performance (LP) to the Sustainable Development Goals (SDGs).
Sensitivity analysis with equal weights contributes to showing the local privacy of the axis study region, while Sensitivity analysis by exchanging weights contributes to supporting the view of the decision maker and in the feedback process.
Future studies should explore integrating real-time tracking and Internet of Things (IoT) technologies into logistics evaluation frameworks. Such advancements can provide policymakers with dynamic insights into supply chain efficiencies, enabling more proactive infrastructure development strategies. Additionally, further interdisciplinary collaborations between urban planners, economists, and logistics experts could lead to more comprehensive decision-making models that align logistics performance with long-term sustainability goals.
New secondary indicators can be developed based on the proposed conceptual framework and the availability of related data. It is also important to consider integrating the proposed decision support system (DSS) into the stages of regional study preparation – specifically in the analysis of capabilities and needs, as well as in the evaluation phases, by identifying priorities and projects within the regional plan.
As a potential area for future research, the DSS could be further enhanced by using other methods from the multi-criteria analysis literature, such as Entropy, CRITIC, Fuzzy-TOPSIS and Fuzzy-ANP. These methods would enable policymakers to explore various “what ifˮ scenarios. Additionally, establishing a regional logistics observatory to collect data at the regional level and regularly update the defined database would be beneficial for sustaining an informed decision-making process.
Autorzy
REFERENCES
ARVIS, J-F., SASLAVSKY, D., OJALA, L., SHEPHERD, B., BUSCH, C. and RAJ, A. (2014), ‘Connecting to Compete 2014 Trade Logistics in the Global Economy The Logistics Performance Index and Its Indicators’, World Bank, Washington, USA: The International Bank for Reconstruction and Development/The World Bank, p. 72. https://doi.org/10.1596/20399
ARVIS, J-F., SASLAVSKY, D., OJALA, L., SHEPHERD, B., BUSCH, C., RAJ, A. and NAULA, T. (2016), ‘Connecting to Compete 2016 Trade Logistics in the Global Economy The Logistics Performance Index and Its Indicators’, World Bank, Washington, USA: The International Bank for Reconstruction and Development/The World Bank, p. 76, https://lpi.worldbank.org/index.php/report
AWAD, A., WAZZAN, A. and MANSOUR, R. (2014), ‘Using GIS and Fuzzy AHP for Selecting the SuiTable Sites for Wastewater Treatment Plants in the City of Tartous’, Tishreen University Journal for Research and Scientific Studies – Engineering Sciences Series, 36 (6), pp. 347−366, http://www.journal.tishreen.edu.sy/index.php/engscnc/article/view/1393/0 [accessed on: 02.10.2018].
BAKAR, M. A., JAAFAR, H. S., FAISOL, N. and MUHAMMAD, A. (2014), ‘Logistics Performance Measurements – Issues and Reviews’, Munich Personal RePEc Archive (MPRA) Paper No. 60918, pp. 1−9, http://mpra.ub.uni-muenchen.de/60918/ [accessed on: 07.08.2018].
CARVALHO, M., SYGUIY, T. and SILVA, D. N. (2015), ‘Efficiency and Effectiveness Analysis of Public Transport of Brazilian Cities’, Journal of Transport Literature, 9 (3), pp. 40−44. https://doi.org/10.1590/2238-1031.jtl.v9n3a8
CHANG, D.-Y. (1996), ‘Theory and Methodology, Applications of the extent analysis method on fuzzy AHP’, European Journal of Operational Research 95, pp. 649−655, Elsevier. https://doi.org/10.1016/0377-2217(95)00300-2
CHARDINE-BAUMANN, E. and BOTTA-GENOULAZ, V. (2014), ‘A framework for sustainable performance assessment of supply chain management practices’, Computers and Industrial Engineering, 76, pp. 1−29. https://doi.org/10.1016/j.cie.2014.07.029
DRASKOVIC, M. (2009), ‘The role of logistics in performance management’, Montenegrin Journal of Economics, 10, pp. 145−151, https://ideas.repec.org/a/mje/mjejnl/v5y2009i10p145-151.html [accessed on: 07.08.2018].
ECORYS, FRAUNHOFER, TCI, PROGNOS and AUEB-RC/TRANSLOG (2015), ‘Fact-finding studies in support of the development of an EU strategy for freight transport logistics Lot 1: Analysis of the EU logistics sector’, European Comission, pp. 1−422, https://op.europa.eu/en/publication-detail/-/publication/4c60a2c5-969e-11e7-b92d-01aa75ed71a1 [accessed on: 08.11.2018].
FENG, Z., LI, G., WANG, W., ZHANG, L., XIANG, W., HE, X., ZHANG, M. and WEI, N. (2023), ‘Emergency logistics centers site selection by multi-criteria decision-making and GIS’, International Journal of Disaster Risk Reduction, 96, 103921, pp. 1−17. https://doi.org/10.1016/j.ijdrr.2023.103921
FUGATE, B. S., MENTZER, J. T. and STANK, T. P. (2010), ‘Logistics performance: efficiency, effectiveness, and differentiation’, Journal of Business Logistics, 31 (1), pp. 43−62. https://doi.org/10.1002/j.2158-1592.2010.tb00127.x
GUDMUNDSSON, H., HALL, R. P., MARSDEN, G. and ZIETSMAN, J. (2016), ‘Planning for Transportation’, [in:] GUDMUNDSSON, H., HALL, R. P., MARSDEN, G. and ZIETSMAN, J., Sustainable Transportation, Springer Texts in Business and Economics, pp. 51−75. https://doi.org/10.1007/978-3-662-46924-83
GUL, N., IQBAL, J., NOSHEEN, M. and WOHAR, M. (2024), ‘Untapping the role of trade facilitation indicators, logistics and information technology in export expansion and diversification’, The Journal of International Trade and Economic Development, 33 (3), pp. 369−389. https://doi.org/10.1080/09638199.2023.2182606
HALIMI, Z., SAFARITAHERKHANI, M. and CUI, Q. (2025), ‘A Generalized Framework for Assessing Equity in Ground Transportation Infrastructure: Exploratory Study’, Journal of Management in Engineering, 41 (2), 04024072, pp. 1−35. https://doi.org/10.1061/JMENEA.MEENG-6336
KAREEM, O. I. (2025), ‘The determinants of export promotion in Africa: evidence from the implemented trade facilitation measures’, International Economics and Economic Policy, 22 (21), pp. 1−26. https://doi.org/10.1007/s10368-024-00647-3
KINRA, A. and ÜLENGIN, F. (2021), ‘Advances in thoughts and approaches for transport and logistics systems performance evaluation’, Transport Policy, 124 (2), pp. 1−4. https://doi.org/10.1016/j.tranpol.2021.09.016
KOFI, E. (2010), Network based Indicators for Prioritising the Location of a new urban transport connection: Case study Istanbul, Turkey, International Institute For Geo-Information Science and Earth Observation Enschede, The Netherlands.
KONDRATJEV, J. (2015), Logistics. Transportation and warehouse in supply chain, CENTRIA UNIVERSITY OF APPLIED SCIENCES – Industrial management.
MANSIDÃO, R. and COELHO, L. A. G. (2014), ‘Logistics Performance: a theoretical conceptual model for small and medium enterprises’, CEFAGE-UE, p. 22, Universidade de Évora, https://www.cefage.uevora.pt/en/research/publications/working-papers/1350/ [accessed on: 03.07.2018].
MCKINNON, A. (2015), ‘Performance measurement in freight transport: Its contribution to the design, implementation and monitoring of public policy’, prepared for the RoundTable on Logistics Development Strategies and their Performance Measurements Hamburg (9−10 March 2015, Queretaro), OECD, http://www.itf-oecd.org/performance-measurement-freight-transport-0 [accessed on: 01.03.2019].
NAGNE, A. D., VIBHUTE, A. D. and MEHROTRA, S. C. (2013), ‘Spatial Analysis of Transportation Network for Town Planning of Aurangabad City by using Geographic Information System’, International Journal of Scientific and Engineering Research, 4 (7), pp. 2588−2594, IJSER, https://www.ijser.org/paper/Spatial-Analysis-of-Transportation-Network-for-Town-Planning-of-Aurangabad-City-by-using-Geographic-Information-System.html [accessed on: 26.08.2019].
ÖNDEN, İ., ELDEMIR, F., ACAR, A. Z. and ÇANCI, M. (2023), ‘A spatial multi-criteria decision-making model for planning new logistic centers in metropolitan areas’, Supply Chain Analytics, 1, 100002, pp. 1−14. https://doi.org/10.1016/j.sca.2023.100002
ÖZCEYLAN, E., ÇETINKAYA, C., ERBAS, M. and KABAK, M. (2016), ‘Logistic performance evaluation of provinces in Turkey: A GIS-based multi-criteria decision analysis’, Transportation Research Part A, 94, pp. 323–337. https://doi.org/10.1016/j.tra.2016.09.020
ÖZCEYLAN, E., ERBAŞ, M., TOLON, M., KABAK, M. and DURĞUT, T. (2015), ‘Evaluation of freight villages: A GIS-based multi-criteria decision analysis’, Computers in Industry, 76, pp. 38–52. https://doi.org/10.1016/j.compind.2015.12.003
QUAMAR, M. M., AL-RAMADAN, B., KHAN, K., SHAFIULLAH, M. and FERIK, S. E. (2023), ‘Advancements and applications of drone-integrated geographic information system technology – A review’, Remote Sensing MDPI, 15 (20), 5039, pp. 1−35. https://doi.org/10.3390/rs15205039
RODRIGUE, J. P. (2020), The geography of transport systems, Routledge London and New York: Fifth Edition, Routledge Taylor and Francis Group, https://transportgeography.org/
RYU, H., LEE, D., SHIN, J., SONG, M., LEE, S., KIM, H. and KIM, B.-I. (2023), ‘A web-based decision support system (DSS) for hydrogen refueling station location and supply chain optimization’, International Journal of Hydrogen Energy, 48 (93), pp. 36223−36239. https://doi.org/10.1016/j.ijhydene.2023.06.064
SREELEKHA, M. G., KRISHNAMURTHY, K. and ANJANEYULU, M. V. L. R. (2016), ‘Interaction between Road Network Connectivity and Spatial Pattern’, Procedia Technology, (24), pp. 131–139. https://doi.org/10.1016/j.protcy.2016.05.019
SRISAWAT, P., KRONPRASERT, N. and ARUNOTAYANUN, K. (2017), ‘Development of decision support system for evaluating spatial efficiency of regional transport logistics’, Transportation Research Procedia 25C-World Conference on Transport Research – WCTR 2016 Shanghai. 10–15 July 2016, pp. 4836–4855. https://doi.org/10.1016/j.trpro.2017.05.493
SUTOMO, H. and SOEMARDJITO, J. (2012), ‘Assessment Model of the Port Effectiveness and Efficiency (Case Study: Western Indonesia Region)’, Procedia – Social and Behavioral Sciences 43, pp. 24–32. https://doi.org/10.1016/j.sbspro.2012.04.074
SYRIAN REGIONAL PLANNING COMMISSION, (2021), Guide for preparing spatial planning studies in the Syrian Arab Republic, Damascus, Syrian Arab Republic: Ministry of Public Works, Regional Planning Commission, p. 13 [accessed on: 05.12.2021].
TAVASSZY, L. and de JONG, G. (2014), Modelling Freight Transport. First Edition, p. 256, Elsevier. https://doi.org/10.1016/C2012-0-06032-2
WATERS, D. (2003), Global logistics and distribution planning – Strategies for management – Fourth edition, p. 436, Kogan Page Limited.
WĄTRÓBSKI, J. (2016), ‘Outline of multicriteria decision-making in green logistics’, Transportation Research Procedia, 16, pp. 537–552. https://doi.org/10.1016/j.trpro.2016.11.051
ZHANG, C., LU, C. and HELLBERG, R. (2013), An Evaluation Approach for Regional Logistics Abilities. Logistics and Innovation Management, Faculty of Engineering and Sustainable Development, University of Gavle, Gavle, Sweden.
ŻAK, J., HADAS, Y. and ROSSI, R. (2017), Advanced Concepts, Methodologies and Technologies for Transportation and Logistics, Cham, Switzerland, p. 470. Springer International Publishing, pp. 1−572. https://doi.org/10.1007/978-3-319-57105-8