
DEPOPULATION AND POPULATION AGEING IN EUROPE IN THE 2010s: A REGIONAL APPROACH
Anna MAJDZIŃSKA  *
*
Abstract. The paper analyses European countries and NUTS-3 units to determine which of them experienced depopulation in the 2010s, as well as the causes of this process. The progression of demographic ageing, particularly in countries and NTS3 units with annual population declines, is also examined. European countries and NTS3 units in selected years and periods between 2011 and 2020 are studied based on Eurostat vital statistics, data on migratory movements and population age structures using descriptive statistics, time-series methods, Webb’s method, and cluster analysis. The data and research results are illustrated with tables, graphs, and choropleth maps.
In the 2010s, depopulation processes mainly occurred in Eastern and Southern Europe. The study found that between 2011 and 2020, eight countries (Bulgaria, Croatia, Greece, Hungary, Latvia, Romania, Serbia, and Ukraine) suffered population decreases annually, three countries (Albania, Lithuania, and Portugal) had only one or two years without a population loss, and four countries (Bulgaria, Croatia, Latvia, and Romania) were demographically the most disadvantaged as their populations decreased due to natural causes and migration in almost all years in the 2010s.
Most of the annually depopulating countries were relatively similar in terms of the population age structure. NTS3 units with annual population declines and a similar population age structures were found within the same country or in neighbouring areas in adjacent countries.
Key words: depopulation, population ageing, typology of population change, European countries, NTS3 units.
1. INTRODUCTION
Europe has the oldest population of all continents and is the only one projected to decline in the coming decades. It is estimated that it will decrease by 0.8% from 2020 to 2030, 2.7% from 2020 to 2040, and 5% from 2020 to 2050 (UN data). At the same time, the proportion of people aged 65 or older is expected to rise from 19% in 2020 to 23% in 2030, 26% in 2040, and 28% in 2050 (in 2000 and 2010 the age group accounted for 15% and 16%, respectively). While in 2020, there were 120 elderly people per 100 children aged 0–14 years (105 in 2010), in 2030, 2040, and 2050 there will be 150, 180, and 190, respectively.
The term ‘depopulation’ has more than one interpretation. Some authors understand it as a decrease in population size in a period, others view it as a persistent and long-term decline in population, while others still ascertain the existence of depopulation based on the amount of population loss over a period (see, for example, Johnson and Lichten, 2019; Merino and Prats, 2020; Reynaud and Miccoli, 2018; Truskolaski and Bugowski, 2022).
Depopulation may result from a natural decrease (more deaths in the population than births), migration (more people leaving than arriving), or both these factors simultaneously (Majdzińska, 2021; see also Goldstein, 2009; Kiniorska et al., 2023; Merino and Prats, 2020; Reynaud and Miccoli, 2018; Willekens, 2015). Population change is also related to its current structure and a phenomenon known as “an age wave” (Bloom and Canning 2008, p. 21), understood as alternating baby booms and baby busts (cf. Frątczak, 2002).
The main causes of depopulation in most European countries are falling fertility rates (much below the generation replacement level of 2.1 children per woman)[1], with relatively unchanging or declining mortality rates extending life expectancy in the long term[2], and migrations. In areas with little to offer to residents, depopulation is usually caused by both these factors. In residentially attractive areas, a natural decrease (if there is one) is counterbalanced by in-migration.
Changes in the family formation patterns and related low total fertility rates (TFR) that have been observed in Europe in the last several decades are mainly explained in terms of the Second Demographic Transition[3] theory (Lesthaeghe, 2010, 2020; van de Kaa, 1987, 1997, 2003). In post-communist countries, the changes frequently had a rapid course and occurred later than in the rest of Europe. In most cases, economic and political restructuring that the countries undertook after the collapse of the USSR coincided with the end of the first demographic transition[4] and the emergence of the second demographic transition (see, for instance, Lesthaeghe, 2010, 2020; Nikitović et al., 2019; Philipov, 2003; Philipov and Kohler, 2001; van de Kaa, 1997). As European countries are at different points of the second demographic transition, they naturally differ in the family formation patterns (see, for instance, Lesthaeghe, 2020; Majdzińska, 2021, 2022; Oláh, 2015).
Depopulation (especially persistent depopulation driven by natural and migratory changes) creates many negative demographic, social and economic problems, including changes in the age and sex structure of the population, accelerated population ageing, a decrease in the working-age population, etc., (see, e.g., Jarzebski et al., 2021; Kiniorska et al., 2023; Reynaud and Miccoli, 2018; Truskolaski and Bugowski, 2022), but it also has some advantages for the natural environment perspective for the (see, e.g., ESPON, 2017; Götmark, 2018; Jarzebski et al., 2021).
European regions represent a variety of demographic structures, demographic processes, and stages of socio-economic development (Eurostat, 2020, p. 22). Depopulation processes are particularly noticeable in Eastern and Southern Europe. In many European regions they have been present for decades, but their pace clearly accelerated in most of Europe in the 2010s. In most post-communist countries, negative population growth and faster population ageing have been observed since they embarked on the political and economic transition. In eleven post-communist European Union (EU) Member States depopulation gained momentum with their accession to the EU (see Fihel and Okólski, 2019, p. 2).
Rural demographic growth in European countries is generally lower than urban, and populations show a tendency to concentrate in or around larger cities (ESPON, 2018, p. 3). Regional attractiveness and the quality of life in European territories tend to be rated by the public based on the availability of transport, digital connectivity, and social and economic services (ESPON, 2018, p. 6; see also ESPON, 2017).
As regards regional differences in population processes in the EU in the 2010s, the rural and intermediate regions in Southern and Eastern Europe, particularly those located far from large cities, recorded population losses more frequently. In contrast, the net migration rates in the north-western regions of Europe were relatively high and positive, compensating for the natural decrease in the intermediate and rural areas (Brons, 2024).
Recent years have seen an increased interest in research on population changes in European countries and regions, resulting in numerous publications. Their authors mostly focused on depopulation processes and explaining their causes in different parts of Europe, as well as on the consequences of depopulation and ways of preventing or mitigating them. Depopulation problems are studied in terms of the entire continent of Europe, EU regions (see, e.g., Brons, 2024; ESPON, 2017, 2018, 2020; Eurostat 2020, 2023; Fihel and Okólski, 2019; Potančoková et al., 2021), and individual countries (see, e.g., Czibere et al., 2021; Čipin, 2017; Dahs et al., 2021; Daugirdas and Pociūtė-Sereikienė, 2018; Domachowska, 2021; Ilieva, 2017; Lutz and Gailey, 2020; Marinković and Radivojević, 2016; Pinilla and Sáez, 2017; Potančoková et al., 2021; Rašević and Galjak, 2022; Recaño, 2017; Reynaud and Miccoli, 2018; Shvindina, 2016; Zarins and Paiders, 2020).
The paper presents a broad look at the depopulation problem in Europe but the areas of the positive population change have also been included as a comparative background. The analysis is conducted to identify countries and NUTS-3 units in Europe affected by population loss in the 2010s and the causes of the phenomenon (with this aim, a typology of population change is performed). It also examines the progression of population ageing. The investigation particularly focuses on countries and NTS3 units that report an annual population loss. Additionally, the countries showing population decline are briefly characterised due to the main causes of that process.
The dynamics of changes in the size of Europe’s population requires ongoing monitoring of their course. The data thus obtained are critical to designing social and economic policy measures capable of preventing or mitigating the impacts of population loss in depopulating regions.
The analysis is conducted using various research tools, including descriptive statistics, Webb’s method, and cluster analysis. Eurostat vital statistics, data on migratory movements, and population age structures in European countries and NTS3 units in the selected years between 2011 and 2020 were examined.
2. METHODS
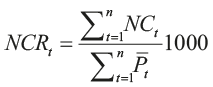
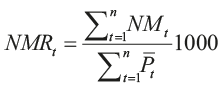
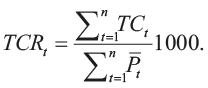
Most analyses were performed using three measures: a crude rate of natural change (NCR), a crude rate of net migration (NMR), and a crude rate of total population change (TCR), which were calculated for the full periods using the following formulas (1–3), (see Eurostat, 2014):
(1)
(2)
(3)
where: NCt – natural change (the difference between the number of births and deaths), NMt – net migration (the difference between the number of emigrants and immigrants), and TCt – the sum of natural change and net migration, Pt – the average population in a year or period t.
Population change in a period was also evaluated using a fixed-base index (FBI), which was calculated as a quotient between the sizes of the population at the end and beginning of a period. The differences between the FBI and the value of 1 were calculated and presented as a percentage of population change (PPC).
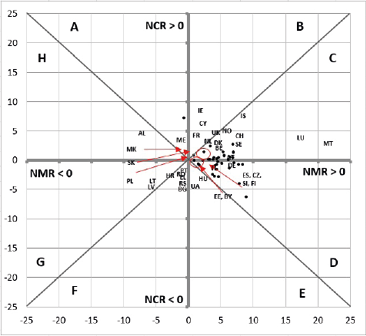
The causes of depopulation in the selected countries and NUTS-3 in the sample period were determined using Webb’s method (Webb, 1963). The relationships between the NCR and the NMR produced eight types of factors in population change (four involving increases and four involving declines) to be identified (see Fig. 1).
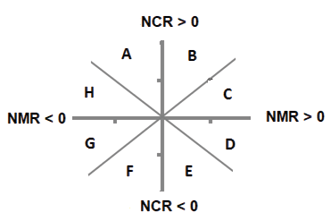
Types: A, B, C, D – areas with a positive total population change (a positive TCR = population increase)
Types: E, F, G, H – areas with a negative total population change (a negative TCR = population decrease)
Source: own work based on Webb (1963) and Jagielski (1978).
In order to assess population ageing in European countries and NTS3 units, the percentage of the population aged 65 and older and an old-age index (a ratio between the size of the population aged 65 or older and the size of the population aged 0–14 years) were calculated.
Using Ward’s method[5] (Ward, 1963) with the Euclidean distance matrix based on 5-year age groups, countries and NUTS-3 units were divided into groups with similar population age structures. All countries were divided based on the 2020 data; in the case of NTS3, 2015–2019 data were used, and only units with annual population loss were grouped.
The Eurostat vital statistics and data on migratory movements in European countries were considered for three time intervals: 2011–2015, 2016–2020, and 2011–2020. The NTS3 units were analysed using the 2015–2019 data. Population age structures in countries and NUTS-3 units are presented according to the 2020 and 2019 data, respectively.[6] All calculations were performed in MS Excel and STATISTICA 13. The data and research results are illustrated with tables, graphs, and choropleth maps prepared in Quantum GIS software.
3. RESULTS
Most post-communist countries experienced population declines in all three analysed periods (see Table 1). The greatest decreases between 2011 and 2020 occurred in Ukraine (8.7%), Lithuania, and Latvia (7.7% each), and from 2016 to 2020 in Latvia, Croatia, Bulgaria, and Lithuania (2.6–3.0%). Among non-post-communist countries, Greece and Portugal suffered population declines in all three periods, Spain and Cyprus from 2011 to 2015, and Italy from 2016 to 2020. It is noteworthy that in Bulgaria, Croatia, Greece, Hungary, Latvia, Romania, Serbia, and Ukraine, depopulation was observed in all years of the period 2011–2020. According to demographic projections, Latvia, Lithuania, Romania, Bulgaria, Croatia, Greece, Poland, and Portugal will see the greatest population losses in the decades up to 2050 (see Table 1).
Countries where populations increased the most in both 2011–2020 and 2016–2020 included Malta (23.8% and 13.2%, respectively), Luxembourg (21.6% and 8.3%), and Iceland (14.9% and 9.2%). These countries, as well as Ireland, Cyprus, Norway, Sweden, and Switzerland, will probably have the greatest population increases until 2050 (see Table 1).
With regard to NTS3 units (see Fig. 2), the biggest declines in population (from 8% to 12%) occurred between 2015 and 2019 in Albania (Gjirokastër (AL033), Berat (AL031), and Dibër (AL011)), Croatia (Vukovarsko-srijemska zupanija (HR04C), Pozesko-slavonska zupanija (HR049), Sisacko-moslavacka zupanija (HR04E), Brodsko-posavska zupanija (HR04A), and Viroviticko-podravska zupanija (HR048)), Lithuania (Taurages apskritis (LT027), Utenos apskritis (LT029), Panevezio apskritis (LT025), and Marijampoles apskritis (LT024)), and Estonia (Kirde-Eesti (EE007)).
Post-communist countries, particularly those located in the easternmost part of Europe, have higher mortality rates than other European countries and thereby the lowest life expectancies at birth (e0) on the continent. The lowest e0 was found for Ukraine, Bulgaria, Romania, North Macedonia, Belarus, and Serbia (below 75 years for both genders).
A low total fertility rate (TFR) is a problem in most European countries. In no European country is it high enough to ensure the replacement of generations. The countries with the lowest TFR (1.1–1.3) in 2020 were Malta, Ukraine, Spain, Italy, North Macedonia, and Albania.
Although many countries had the same or similar TFR (e.g., Ukraine and Italy in 2020), fertility patterns varied regionally, and most involved postponing childbearing decisions. The youngest fertility patterns, a natural consequence of relatively early family formation, characterised post-communist countries in Eastern Europe (Belarus, Ukraine, Bulgaria, and Romania), while the oldest were in Spain, Italy, Luxembourg, Greece, Ireland, and Switzerland (see Majdzińska, 2021).[7]
An analysis the countries’ NCR, NMR and TCR from 2011 to 2020 shows that the lowest NCR values were in Bulgaria, Serbia, and Ukraine (deaths exceeded births by around 5–6 per 1,000 population). The lowest NMR was in Albania, Lithuania, and Latvia, and the lowest TCR was in Latvia, Bulgaria, and Croatia (see Table 1).
| Country | Population increase / decline (PPC; %) | TCR | NCR | NMR | |||||||||||
|---|---|---|---|---|---|---|---|---|---|---|---|---|---|---|---|
| 2011–2015 | 2016–2020 | 2011–2020 | 2020–2030 | 2020–2040 | 2020–2050 | 2011–2015 | 2016–2020 | 2011–2020 | 2011–2015 | 2016–2020 | 2011–2020 | 2011–2015 | 2016–2020 | 2011–2020 | |
| Albania (AL) | -0.8 | -1.3 | -2.3 | : | : | : | -2.2 | -3.2 | -2.7 | 4.8 | 2.3 | 3.6 | -7.0 | -5.5 | -6.3 |
| Austria (AT) | 3.0 | 2.1 | 6.3 | 2.6 | 4.2 | 4.8 | 7.7 | 5.3 | 6.4 | 0.1 | 0.1 | 0.1 | 7.5 | 5.1 | 6.3 |
| Belarus (BY) | -0.1 | -0.8 | -0.7 | : | : | : | 0.0 | -0.5 | -0.3 | -1.6 | -1.7 | -1.6 | 1.6 | 1.1 | 1.4 |
| Belgium (BE) | 2.1 | 1.9 | 4.6 | 1.9 | 3.0 | 3.3 | 5.6 | 4.5 | 5.0 | 1.6 | 0.5 | 1.1 | 3.9 | 4.0 | 3.9 |
| Bulgaria (BG) | -2.3 | -2.7 | -5.6 | -7.0 | -13.2 | -18.4 | -5.9 | -6.8 | -6.3 | -5.5 | -7.0 | -6.3 | -0.4 | 0.3 | -0.1 |
| Croatia (HR) | -1.7 | -3.0 | -5.5 | -5.4 | -10.7 | -16.2 | -4.7 | -7.5 | -6.1 | -2.7 | -4.1 | -3.4 | -1.9 | -3.5 | -2.7 |
| Cyprus (CY) | -0.4 | 4.7 | 4.8 | 7.9 | 13.5 | 17.3 | 2.0 | 10.9 | 6.5 | 4.7 | 4.0 | 4.3 | -2.7 | 6.9 | 2.2 |
| Czechia (CZ) | 0.5 | 1.2 | 1.9 | 0.6 | -0.7 | -1.6 | 1.3 | 2.8 | 2.0 | 0.1 | -0.2 | -0.1 | 1.2 | 3.0 | 2.1 |
| Denmark (DK) | 2.0 | 1.8 | 4.7 | 2.3 | 3.8 | 4.6 | 5.2 | 4.6 | 4.9 | 0.9 | 1.3 | 1.1 | 4.3 | 3.3 | 3.8 |
| Estonia (EE) | -0.9 | 1.0 | 0.2 | -1.6 | -3.6 | -5.5 | -2.3 | 2.1 | -0.1 | -1.1 | -1.3 | -1.2 | -1.3 | 3.4 | 1.1 |
| Finland (FI) | 1.7 | 0.6 | 2.6 | -0.2 | -1.9 | -4.3 | 4.1 | 1.7 | 2.9 | 1.2 | -1.0 | 0.1 | 2.9 | 2.7 | 2.8 |
| France (FR) | 2.2 | 1.0 | 3.5 | 2.0 | 3.6 | 3.9 | 4.4 | 2.4 | 3.4 | 3.8 | 2.1 | 2.9 | 0.6 | 0.3 | 0.4 |
| Germany (DE) | 1.8 | 1.0 | 3.6 | 0.4 | 0.0 | -0.6 | 4.8 | 2.4 | 3.6 | -2.3 | -1.9 | -2.1 | 7.2 | 4.3 | 5.7 |
| Greece (EL) | -2.6 | -0.7 | -3.6 | -3.7 | -7.4 | -11.2 | -6.2 | -1.9 | -4.1 | -1.6 | -3.4 | -2.5 | -4.6 | 1.5 | -1.6 |
| Hungary (HU) | -1.3 | -0.7 | -2.2 | -1.3 | -3.2 | -4.9 | -2.6 | -2.0 | -2.3 | -3.8 | -3.9 | -3.9 | 1.2 | 1.9 | 1.5 |
| Iceland (IS) | 3.7 | 9.2 | 14.9 | 13.8 | 24.4 | 33.5 | 8.7 | 20.6 | 14.9 | 7.1 | 5.6 | 6.3 | 1.6 | 15.0 | 8.5 |
| Ireland (IE) | 2.7 | 4.8 | 8.9 | 10.4 | 18.4 | 24.6 | 6.7 | 11.5 | 9.2 | 8.7 | 6.0 | 7.3 | -2.0 | 5.5 | 1.9 |
| Italy (IT) | 2.3 | -1.9 | 0.1 | 0.8 | -0.1 | -2.2 | 4.3 | -2.9 | 0.7 | -1.6 | -3.6 | -2.6 | 5.9 | 0.7 | 3.3 |
| Latvia (LV) | -4.0 | -3.0 | -7.7 | -9.9 | -19.2 | -26.6 | -10.5 | -7.9 | -9.2 | -4.0 | -4.6 | -4.3 | -6.5 | -3.3 | -4.9 |
| Lithuania (LT) | -4.1 | -2.6 | -7.7 | -7.8 | -16.3 | -23.5 | -11.1 | -6.6 | -8.9 | -3.6 | -4.4 | -4.0 | -7.5 | -2.1 | -4.9 |
| Luxembourg (LU) | 9.9 | 8.3 | 21.6 | 9.9 | 17.2 | 22.0 | 23.6 | 18.3 | 20.8 | 3.9 | 3.2 | 3.5 | 19.7 | 15.1 | 17.3 |
| Malta (MT) | 6.9 | 13.2 | 23.8 | 14.2 | 23.2 | 29.7 | 16.5 | 27.1 | 22.1 | 2.0 | 1.5 | 1.7 | 14.6 | 25.6 | 20.4 |
| Montenegro (ME) | 0.3 | -0.2 | 0.2 | : | : | : | 0.8 | -0.5 | 0.1 | 2.3 | 1.0 | 1.6 | -1.5 | -1.5 | -1.5 |
| Netherlands (NL) | 1.5 | 2.4 | 4.5 | 3.0 | 4.3 | 4.0 | 3.8 | 5.8 | 4.8 | 2.0 | 0.9 | 1.4 | 1.8 | 4.9 | 3.4 |
| N. Macedonia (MK) | 0.6 | 0.0 | 0.7 | : | : | : | 1.4 | -0.2 | 0.6 | 1.7 | -0.2 | 0.7 | -0.3 | -0.1 | -0.2 |
| Norway (NO) | 4.8 | 2.8 | 8.6 | 7.2 | 13.3 | 18.1 | 11.4 | 6.8 | 9.1 | 3.6 | 2.8 | 3.2 | 7.8 | 4.0 | 5.9 |
| Poland (PL) | -0.2 | -0.2 | -0.4 | -2.3 | -5.9 | -10.0 | -0.5 | -0.7 | -0.6 | -0.2 | -1.0 | -0.6 | -0.3 | 0.3 | 0.0 |
| Portugal (PT) | -1.9 | -0.3 | -2.5 | -2.0 | -5.0 | -9.0 | -4.4 | -0.8 | -2.6 | -1.8 | -2.7 | -2.2 | -2.6 | 1.8 | -0.4 |
| Romania (RO) | -1.6 | -2.3 | -4.4 | -7.5 | -13.9 | -19.5 | -4.4 | -5.9 | -5.1 | -2.9 | -3.6 | -3.2 | -1.5 | -2.3 | -1.9 |
| Serbia (RS) | -1.9 | -2.3 | -4.6 | : | : | : | -4.9 | -5.9 | -5.4 | -5.0 | -5.9 | -5.4 | 0.1 | 0.0 | 0.1 |
| Slovakia (SK) | 0.5 | 0.5 | 1.1 | -0.3 | -2.7 | -5.7 | 1.2 | 1.2 | 1.2 | 0.7 | 0.5 | 0.6 | 0.5 | 0.7 | 0.6 |
| Slovenia (SI) | 0.5 | 1.8 | 2.4 | 0.2 | -1.0 | -2.8 | 1.4 | 4.3 | 2.8 | 1.0 | -0.7 | 0.2 | 0.3 | 5.0 | 2.7 |
| Spain (ES) | -0.6 | 1.9 | 1.3 | 2.9 | 4.3 | 4.2 | -1.0 | 4.1 | 1.6 | 0.9 | -1.3 | -0.2 | -1.8 | 5.3 | 1.8 |
| Sweden (SE) | 3.7 | 4.3 | 9.6 | 7.2 | 12.9 | 18.4 | 9.1 | 10.4 | 9.7 | 2.4 | 2.2 | 2.3 | 6.6 | 8.2 | 7.4 |
| Switzerland (CH) | 4.7 | 3.1 | 9.2 | 5.1 | 10.5 | 15.3 | 11.3 | 8.0 | 9.6 | 2.3 | 2.2 | 2.3 | 9.0 | 5.8 | 7.3 |
| Ukraine (UA) | -6.3 | -2.2 | -8.7 | 2.6 | 4.2 | 4.8 | -3.0 | -5.6 | -4.2 | -3.6 | -5.9 | -4.7 | 0.7 | 0.3 | 0.5 |
| United Kingdom (UK) | 2.9 | 2.6 | 6.5 | : | : | : | 7.4 | 6.6 | 7.0 | 3.6 | 2.2 | 2.9 | 3.7 | 4.4 | 4.1 |
Note 1: ':' stands for 'data not available'.
Note 2: Regarding population change, TCR, NCR and NMR: data on the UK and Belarus from 2010–2014, 2015–2019, and 2010–2019.
Source: own work based on EUROSTAT data.
Among the NTS3 units, those with the lowest TCR (-32 to -20) between 2015 and 2019 were Gjirokastër (AL033), Berat (AL031), and Dibër (AL011) in Albania, Vukovarsko-srijemska zupanija (HR04C), Pozesko-slavonska zupanija (HR049), Sisacko-moslavacka zupanija (HR04E), Brodsko-posavska zupanija (HR04A), and Viroviticko-podravska zupanija (HR048) in Croatia, Taurages apskritis (LT027), Utenos apskritis (LT029), Panevezio apskritis (LT025), and Marijampoles apskritis (LT024) in Lithuania, Vidin (BG311) in Bulgaria, and Kirde-Eesti (EE007) in Estonia (see Fig. 3). The TCR of more than one-third of NUTS-3 units (554 out of 1,441) was negative in all sample years.
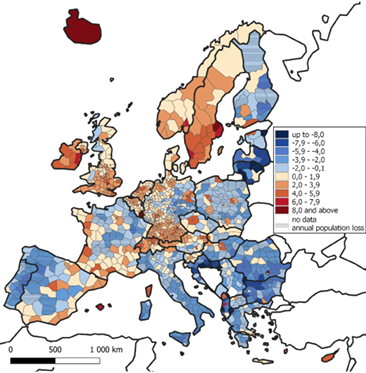
Note 1: United Kingdom: 2014–2018 data (UKM7, UKM8 and UKM9 data from 2017–2018); Serbia: 2017–2018 data
Note 2: min = -12.2; max = 16.3
Source: own work based on EUROSTAT data.
.jpg)
Note 1: see Note 1 for Fig. 2
Note 2: min = -31.5; max = 36.6
Source: own work based on EUROSTAT data.
.png)
Note 1: see Note 1 in Fig. 2
Note 2: min = -16.5; max = 34.5
Source: own work based on EUROSTAT data.
.png)
Note 1: see Note 1 for Fig. 2
Note 2: min = -30.7; max = 37.2
Source: own work based on EUROSTAT data.
The lowest NCR values (-16 to -11) were found for Vidin (BG311), Montana (BG312), Gabrovo (BG322), Kyustendil (BG415), Pernik (BG414), Lovech (BG315), and Vratsa (BG313) in Bulgaria, the Zajecarska oblast (RS223), the Borska oblast (RS221), and the Branicevska oblast (RS222) in Serbia, and the Utenos apskritis in Lithuania (see Fig. 4).
The NTS3 with the lowest NMR (-31 to -14) were Dibër (AL011), Gjirokastër (AL033), Berat (AL031), Kukës (AL013), Elbasan (AL021), and Lezhë (AL014) in Albania, the Vukovarsko-srijemska zupanija (HR04C), the Pozesko-slavonska zupanija (HR049), the Brodsko-posavska zupanija (HR04A), the Viroviticko-podravska zupanija (HR048), and Sisacko-moslavacka zupanija (HR04E) in Croatia, and the Taurages apskritis (LT027), the Telsiu apskritis (LT028), the Marijampoles apskritis (LT024), and Panevezio apskritis (LT025) in Lithuania (see Fig. 5).
Most NTS3 units with negative TCR, NCR, and NMR in 2015–2019 experienced annual population losses in all years of this period; in many of them, depopulation continued for decades.
In the next step, using Webb’s method, countries and NTS3 units were grouped based on their NCR and NMR values. In this way, the types of population change were created according to the main cause of population increase or decrease (see Fig. 1).
Most sampled countries belonged in particular years and periods to types with population increase (see Table 2 and 3). The majority were type C (a natural increase with a more significant migratory increase). The ranking of types with a population decrease changed during that decade: type G (a natural decrease and a stronger migratory decrease), which was the most common in the first half, was replaced in subsequent years by types E (a natural decrease and a migratory increase) and F (a natural decrease and a distinctive migratory decrease). This shows that in the 2010s, a natural decrease gradually intensified its role in depopulation in European countries.
In Albania, migration was the single cause of depopulation in almost all years of the sample. Annual population losses resulting exclusively from a natural decrease occurred in Hungary, Ukraine, Serbia, Greece (from 2016), and Italy (from 2015 to 2019). In Bulgaria (excluding 2020), Croatia, Latvia, Romania, and Lithuania (before 2018), annual population declines were caused by a combination of a natural decrease and migration.
Slightly more than 60% of the NTS3 units had population increases from 2015 to 2019 (most belonged to Type D). Among the other units, the majority were type E or F (see Tab. 3 and Fig. 7). The types of units with population increases (A, B, C, and D) mainly occurred in western and northern Europe, whereas types representing population decreases (E, F, G, and H) were characteristic of eastern and southern Europe. NTS3 units that lost population as a result of a natural decrease and migration (types F and G), which constitute 20.3% of all NTS3 units in the sample, were mostly situated in Poland, Lithuania, Latvia, Estonia, Romania, Hungary, Greece, Serbia, Bulgaria, Croatia, North Macedonia, southern Italy, central Spain, and northern and eastern Finland.
| Country | Type | ||||||||||||
|---|---|---|---|---|---|---|---|---|---|---|---|---|---|
| 2011–2015 | 2016–2020 | 2011–2020 | 2011 | 2012 | 2013 | 2014 | 2015 | 2016 | 2017 | 2018 | 2019 | 2020 | |
| Albania (AL) | H | H | H | H | H | H | H | H | A | H | H | H | H |
| Austria (AT) | C | C | C | C | D | D | C | C | C | C | C | C | D |
| Belarus (BY) | D | E | E | E | E | D | D | D | D | E | E | E | : |
| Belgium (BE) | C | C | C | C | C | C | C | C | C | C | C | C | D |
| Bulgaria (BG) | F | E | F | F | F | F | F | F | F | F | F | F | E |
| Croatia (HR) | F | F | F | F | F | F | F | G | G | G | F | F | F |
| Cyprus (CY) | A | C | B | C | A | H | H | A | B | C | C | C | C |
| Czechia (CZ) | C | D | D | C | C | F | C | D | C | C | C | D | D |
| Denmark (DK) | C | C | C | C | C | C | C | C | C | C | C | C | C |
| Estonia (EE) | G | D | E | G | G | G | F | D | E | D | D | D | D |
| Finland (FI) | C | D | C | C | C | C | C | C | D | D | D | D | D |
| France (FR) | B | B | B | B | B | B | B | A | A | B | B | B | B |
| Germany (DE) | D | D | D | D | D | D | D | D | D | D | D | D | E |
| Greece (EL) | G | E | F | G | G | G | G | G | E | E | E | E | E |
| Hungary (HU) | E | E | E | E | E | E | E | E | F | E | E | E | E |
| Iceland (IS) | B | C | C | A | A | B | B | B | C | C | C | C | C |
| Ireland (IE) | A | B | B | A | A | A | B | B | B | B | C | C | B |
| Italy (IT) | D | E | D | D | D | D | D | E | E | E | E | E | F |
| Latvia (LV) | G | F | G | G | G | G | G | G | G | F | F | F | F |
| Lithuania (LT) | G | F | G | G | G | G | G | G | G | G | F | E | D |
| Luxembourg (LU) | C | C | C | C | C | C | C | C | C | C | C | C | C |
| Malta (MT) | C | C | C | C | C | C | C | C | C | C | C | C | C |
| Montenegro (ME) | A | H | A | A | A | A | A | A | A | H | H | H | G |
| Netherlands (NL) | B | C | C | B | B | B | B | C | C | C | C | C | C |
| North Macedonia (MK) | A | F | A | A | A | A | A | A | A | B | B | F | F |
| Norway (NO) | C | C | C | C | C | C | C | C | C | C | C | C | B |
| Poland (PL) | G | E | F | A | H | G | G | F | D | D | E | E | E |
| Portugal (PT) | G | E | F | G | G | G | G | F | F | E | E | D | D |
| Romania (RO) | F | F | F | F | F | F | F | F | G | G | F | F | F |
| Serbia (RS) | E | E | E | E | F | EF | E | EF | EF | EF | EF | EF | EF |
| Slovakia (SK) | B | C | B | B | C | B | B | C | B | B | C | B | D |
| Slovenia (SI) | B | D | C | B | B | B | A | B | C | D | D | D | D |
| Spain (ES) | H | D | D | B | H | H | H | G | C | D | D | D | D |
| Sweden (SE) | C | C | C | C | C | C | C | C | C | C | C | C | C |
| Switzerland (CH) | C | C | C | C | C | C | C | C | C | C | C | C | C |
| Ukraine (UA) | E | E | E | E | E | E | E | E | E | E | E | E | E |
| United Kingdom (UK) | C | C | C | B | B | C | C | C | C | C | C | C | : |
Note 1: The orange, green, and blue cells denote countries with an annual population loss in 2011–2015, 2016–2020 and 2011–2020, respectively.
Note 2: United Kingdom and Belarus: data from 2010–2014, 2015–2019, and 2010–2019.
Note 3: White and grey cell backgrounds denote a population increase and a population decrease, respectively.
Source: own work based on EUROSTAT data.
| YEARS | Type of increases | Type of decrease | |||||||||
|---|---|---|---|---|---|---|---|---|---|---|---|
| A | B | C | D | ∑ | E | EF | F | G | H | ∑ | |
| COUNTRIES | |||||||||||
| 2011–2015 | 4 | 5 | 11 | 3 | 23 | 3 | 0 | 3 | 6 | 2 | 14 |
| 2016–2020 | 0 | 2 | 13 | 6 | 21 | 9 | 0 | 5 | 0 | 2 | 16 |
| 2011–2020 | 2 | 4 | 13 | 4 | 23 | 5 | 0 | 6 | 2 | 1 | 14 |
| 2011 | 5 | 6 | 11 | 2 | 24 | 4 | 0 | 3 | 5 | 1 | 13 |
| 2012 | 5 | 4 | 10 | 3 | 22 | 3 | 0 | 4 | 5 | 3 | 15 |
| 2013 | 3 | 5 | 9 | 4 | 21 | 2 | 1 | 4 | 6 | 3 | 16 |
| 2014 | 3 | 5 | 11 | 3 | 22 | 3 | 0 | 4 | 5 | 3 | 15 |
| 2015 | 4 | 3 | 12 | 4 | 23 | 3 | 1 | 4 | 5 | 1 | 14 |
| 2016 | 4 | 3 | 14 | 4 | 25 | 4 | 1 | 3 | 4 | 0 | 12 |
| 2017 | 0 | 4 | 13 | 6 | 23 | 6 | 1 | 2 | 3 | 2 | 14 |
| 2018 | 0 | 2 | 15 | 5 | 22 | 7 | 1 | 5 | 0 | 2 | 15 |
| 2019 | 0 | 2 | 13 | 7 | 22 | 7 | 1 | 5 | 0 | 2 | 15 |
| 2020 | 0 | 3 | 8 | 10 | 21 | 6 | 1 | 5 | 1 | 1 | 14 |
| NTS3 UNITS | |||||||||||
| 2015–2019 | 48 | 61 | 289 | 489 | 887 | 211 | 0 | 180 | 113 | 50 | 554 |
Note: see Note 2 for Tab. 2 and Note 1 for Fig. 2.
Source: own work based on EUROSTAT data.
Three countries are particularly interesting – Croatia, Germany, and Poland. In Croatia, the east was undergoing depopulation as a result of migration, while the west was affected by a natural decrease. In Germany, depopulation only occurred in the eastern regions (the former German Democratic Republic). In Poland, population declines in the east and north were mainly driven by migration, while in the centre and west, they were caused by a natural decrease (see Fig. 7).
Out of the 1,441 NUTS-3 units considered in the study, 367 experienced population declines in all years between 2015 and 2019.
Note 1: For the symbols of the countries, see Tab. 1.
Note 2: see Note 2 for Tab. 2.
Source: own work based on EUROSTAT data.
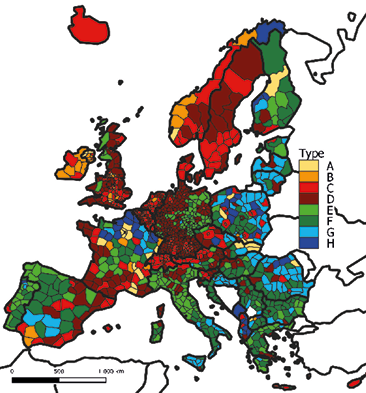
Note: see note 1 for Fig. 2
Source: own work based on EUROSTAT data.
As already mentioned, Europe has the oldest population of all the continents. The countries that had the highest percentages of people aged 65 and older (see Table 4) in 2020 were Italy, Finland, Greece, Portugal, Germany, Bulgaria, Serbia, and Croatia (from 21% to 23%; an average of 140–180 seniors per 100 children). Over the 2010s, population ageing progressed in all countries in the sample, and the most in Finland, Poland, Czechia, and Slovakia (the countries’ rates of seniors increased by 4.0–4.8 p.p.).
In almost all countries with annual population declines, ageing indices were relatively high, the highest being noted in 2020 for Greece and Bulgaria (see Table 4).
| Country | People aged 65+ (%) | Ageing index | Country (cont.) | People aged 65+ (%) | Ageing index | ||||||||
|---|---|---|---|---|---|---|---|---|---|---|---|---|---|
| 2011 | 2015 | 2020 | 2011 | 2015 | 2020 | 2011 | 2015 | 2020 | 2011 | 2015 | 2020 | ||
| Albania (AL) | 11.0 | 12.4 | 14.8 | 50.9 | 65.3 | 88.1 | Lithuania (LT) | 17.9 | 18.7 | 19.9 | 120.1 | 128.1 | 131.8 |
| Austria (AT) | 17.6 | 18.5 | 19.0 | 119.7 | 129.4 | 131.9 | Luxembourg (LU) | 13.9 | 14.2 | 14.5 | 79.0 | 85.0 | 90.6 |
| Belarus (BY) | 13.8 | 14.2 | 15.2 | 92.6 | 88.8 | 89.9 | Malta (MT) | 15.7 | 18.2 | 18.5 | 104.7 | 127.3 | 138.1 |
| Belgium (BE) | 17.1 | 18.1 | 19.1 | 100.6 | 106.5 | 113.0 | Montenegro (ME) | 12.8 | 13.7 | 15.6 | 66.7 | 74.1 | 87.2 |
| Bulgaria (BG) | 18.5 | 20.0 | 21.6 | 140.2 | 143.9 | 150.0 | Netherlands (NL) | 15.6 | 17.8 | 19.5 | 89.1 | 106.6 | 124.2 |
| Croatia (HR) | 17.7 | 18.8 | 21.0 | 115.7 | 127.9 | 146.9 | N. Macedonia (MK) | 11.7 | 12.7 | 14.5 | 66.9 | 75.6 | 89.5 |
| Cyprus (CY) | 12.7 | 14.6 | 16.3 | 75.6 | 89.0 | 101.9 | Norway (NO) | 15.1 | 16.1 | 17.5 | 80.7 | 89.4 | 101.2 |
| Czechia (CZ) | 15.6 | 17.8 | 19.9 | 107.6 | 117.1 | 124.4 | Poland (PL) | 13.6 | 15.4 | 18.2 | 88.9 | 102.7 | 118.2 |
| Denmark (DK) | 16.8 | 18.6 | 19.9 | 93.9 | 109.4 | 121.3 | Portugal (PT) | 18.7 | 20.3 | 22.1 | 123.8 | 141.0 | 162.5 |
| Estonia (EE) | 17.4 | 18.8 | 20.0 | 113.7 | 118.2 | 121.2 | Romania (RO) | 16.1 | 17.0 | 18.9 | 101.9 | 109.7 | 120.4 |
| Finland (FI) | 17.5 | 19.9 | 22.3 | 106.1 | 121.3 | 141.1 | Serbia (RS) | 17.2 | 18.5 | 21.0 | 119.4 | 128.5 | 146.9 |
| France (FR) | 16.7 | 18.4 | 20.4 | 89.8 | 98.9 | 114.0 | Slovakia (SK) | 12.6 | 14.0 | 16.6 | 81.8 | 91.5 | 105.1 |
| Germany (DE) | 20.7 | 21.0 | 21.8 | 152.2 | 159.1 | 159.1 | Slovenia (SI) | 16.5 | 17.9 | 20.2 | 116.2 | 120.9 | 133.8 |
| Greece (EL) | 19.3 | 20.9 | 22.3 | 132.2 | 144.1 | 155.9 | Spain (ES) | 17.1 | 18.5 | 19.6 | 114.0 | 121.7 | 135.2 |
| Hungary (HU) | 16.7 | 17.9 | 19.9 | 114.4 | 123.4 | 137.2 | Sweden (SE) | 18.5 | 19.6 | 20.0 | 111.4 | 113.3 | 112.4 |
| Iceland (IS) | 12.3 | 13.5 | 14.4 | 58.9 | 66.2 | 77.0 | Switzerland (CH) | 16.9 | 17.8 | 18.7 | 111.9 | 119.5 | 124.7 |
| Ireland (IE) | 11.5 | 12.9 | 14.4 | 54.0 | 60.3 | 70.9 | Ukraine (UA) | 15.3 | 15.6 | 17.1 | 107.7 | 103.3 | 111.8 |
| Italy (IT) | 20.5 | 21.7 | 23.2 | 145.4 | 157.2 | 178.5 | United Kingdom (UK) | 16.4 | 17.7 | 18.4 | 93.2 | 100.0 | 102.8 |
| Latvia (LV) | 18.4 | 19.4 | 20.5 | 129.6 | 129.3 | 128.1 | no data | ||||||
Note: See Notes 1 and 2 in Table 2.
Source: own work based on EUROSTAT data.
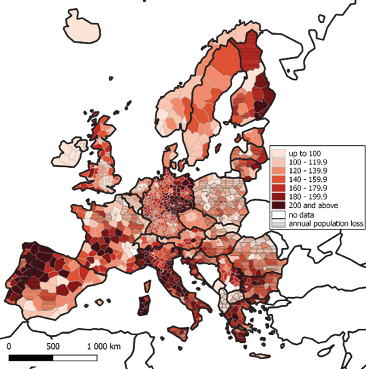
The NTS3 units with the highest ageing indices in 2020 (see Fig. 8) included the prefecture of Evrytania (EL643) (37%) in Greece and Arr. Veurne (BE258) (32.5%) in Belgium. In Suhl (DEG04), Dessau-Roßlau (DEE01), Altenburger Land (DEG0M), and Vogtlandkreis (DED44) in Germany, Ourense (ES113) and Zamora (ES419) in Spain, Alto Tâmega (PT11B), Terras de Trás-os-Montes (PT11E), and Beira Baixa (PT16H) in Portugal, Creuse (FRI22) and Lot (FRJ25) in France, and Etelä-Savo (FI1D1) in Finland, the proportion of the population aged 65 and over in these units ranged from 30 to 32%. The populations of seniors in Evrytania, Alto Tâmega, Zamora, Ourense, Suhl, and Terras de Trás-os-Montes in 2020 were three times larger than the populations of children aged 0–14 years.
The majority of the demographically oldest NTS3 units (including almost all of those mentioned above) had annual population declines between 2015 and 2019 (see Fig. 8 and 9).
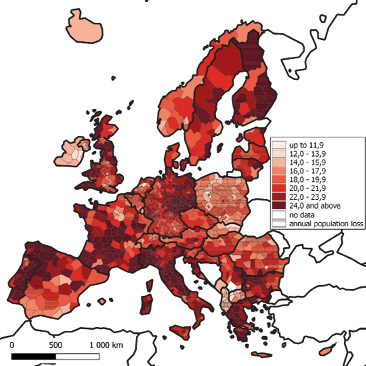
Note 1: see Note 1 for Fig. 2
Source: own work based on EUROSTAT data.
Note: see Note 1 for Fig. 2
Source: own work based on EUROSTAT data.
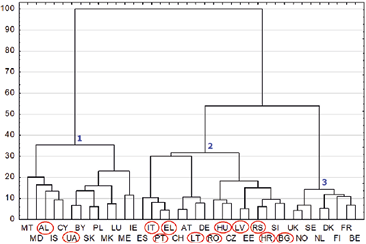
The aggregation of countries and NTS3 units into groups with similar population age structures was performed using Ward’s method, assuming that the optimal group sizes for countries and NTS3 units were 3 and 9, respectively.[8] The majority of the countries that experienced annual population declines in the 2010s or in the subperiods of the decade (they were also the demographically oldest countries) were in Group 2. The pairs of countries with the most similar population age structures in 2020 were Greece and Portugal, the UK and Norway, Austria and Switzerland, and Latvia and Estonia. In a number of cases similar age structures were found for countries lying in the same part of Europe (viz Spain, Italy, Portugal and Greece in southern Europe, and Ukraine, Belarus, Poland, and Slovakia in Eastern Europe).
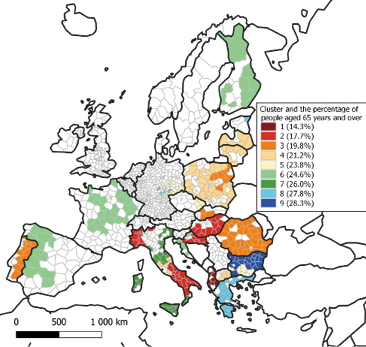
NTS3 units with annual population loss between 2015 and 2019 (Fig. 10) and with similar population age structures were concentrated in the same country or in adjacent countries.
Note 1: The red circles denote countries with annual declines in population (see Note 1 for Table 2).
Note 2: see Note 2 for Table 2.
Source: own work based on EUROSTAT data.
Note: see Note 1 for Fig. 2
Source: own work based on EUROSTAT data.
4. DISCUSSION
The results of the study correspond to the findings published by other authors. They, too, reveal differences in demographic processes in Europe, particularly in terms of population change and population ageing (see, for instance, Brons, 2024; Deimantas et al., 2024; Eurostat, 2020; Espon, 2017, 2018; Kiniorska et al., 2023; Newsham and Rowe, 2022; Truskolaski and Bugowski, 2022).
Depopulation in Europe mainly occurs in countries and regions in the eastern and southern parts of the continent. Many have been affected by population loss for several decades. Rural areas remote from conurbations are the most prone to depopulation, but towns and cities also increasingly lose populations, mainly due to suburbanisation.
“Rural shrinkage is simultaneously a demographic and economic phenomenon and has been interpreted as part of wider trends in European territorial restructuring, where agriculture has become less labour intensive and economic and employment growth has become progressively tertiarised, favouring larger urban centres. […] Rural shrinkage therefore becomes indicative of a broader structural crisis of economic and labour market decline, peripheralization and a deepening urban-rural divide – intensifying the inherent disadvantages of rural areas,” (ESPON, 2017, p. 3).
The problem of urban shrinkage mainly affects eastern European cities (particularly those in Poland, Lithuania, Latvia, Croatia, Hungary, Bulgaria, and Romania), but it is also present in Eastern Germany, Spain, Greece, and Portugal. “In Europe, urban shrinkage has been predominantly associated with deindustrialisation (linked to globalisation and global economic conditions), ageing and population outmigration from the mediterranean and east peripheries into the central ‘blue banana’.[9] The process of suburbanisation is also important at the local scale […]. Declining cities were almost always concentrated in declining regions, with economic factors being a key driver,” (Aurambout et al., 2021).
The demographic and socio-economic situation is relatively the least favourable in areas with a comparatively low level of economic development, where a natural decrease frequently coincides with a negative net migration rate. Among these areas are post-communist countries (or some of their regions) and some regions in South Europe. The majority of NUTS-3 units that had type F or G of population change (i.e., units depopulating as a result of a natural decrease and migrations) in the 2010s lagged in economic development[10] (see European Commission, 2017; Ganau and Kilroy, 2023; see also Pilati and Hunter, 2020; ESPON, 2020).
A major problem and challenge that the long-term depopulating countries with stagnant or inefficient economies and high unemployment face is the outflow of well-skilled employees (see, e.g., Guzi et al., 2021; Hasselbalch, 2017). “Regions combining a low share of highly skilled people and outward migration of the young and educated may fall into a talent development trap, limiting their capacity to build sustainable, competitive and knowledge-based economies” (Brons, 2024, pp. xxiv and 206–208). The problem is observed in regions “which are mostly in Bulgaria, Romania, Hungary, Croatia, the south of Italy, Portugal, eastern Germany and the north-east and outermost regions of France” (Brons, 2024, pp. 206–208).
An important role in family formation processes is played by economic factors and worldviews, which can potentially cause people to marry at an older age, postpone having the first child (both decisions contribute to low fertility), or not start a family at all. These problems are particularly distinct in post-communist countries, as most of them have ineffective family policies. The biggest demographic challenges in most post-communist countries occur in rural areas that are remote and poorly communicated with large cities. The demographic problems of Serbia and Croatia are partly determined by their recent history and ailing economies (see, e.g., Čipin, 2017; Czibere et al., 2021; Dahs et al., 2021; Daugirdas and Pociūtė-Sereikienė, 2018; Domachowska, 2021; Fihel and Okólski, 2019; Frejka and Gietel-Basten, 2016; Ilieva, 2017; Juska and Woolfson, 2014; Kotowska et al., 2008; Koytcheva and Philipov, 2008; Lerch, 2018; Levchuk, 2009; Lutz and Gailey, 2020; Marinković, 2020; Marinković and Radivojević, 2016; Muntele et al., 2023; Mureşan et al., 2008; Perelli-Harris, 2008; Philipov, 2002, 2003; Pinilla and Sáez, 2017; Pires de Almeida, 2017, 2018; Rašević, 2017; Recaño, 2017; Reynaud and Miccoli, 2018; Stankuniene and Jasilioniene, 2008; Szukalski, 2019; Tatarenko, 2021; Ubarevičienė and Burneika, 2020; Zarins, 2020).
The distinctiveness of social phenomena and demographic changes in Eastern Europe seems to be associated with those countries being controlled by the USSR for almost fifty years after the Second World War and, consequently, being cut off from the exchange of people, commodities, and ideas. The demographic trends in post-communist countries can be briefly described as: “a decrease in population, low birth rates, ageing, a concentration of population in the large agglomerations, an upsetting of the principal structures of the population, a deepening of regional demographic differences, as well as higher rates of mortality and intensive external migration, the last two being typical of the countries in transition,” (Ilieva, 2017, p. 8).
Differences in the mortality, health, and wellbeing of European populations (see WHO, 2018) are largely related to their history (see Zatoński et al., 2016). Higher mortality rates from cardiovascular diseases and cancers in Eastern European countries, particularly in the ex-Soviet Union republics, than elsewhere are also caused by the overuse of alcohol and tobacco, unhealthy lifestyles, including eating habits, and the limited awareness of healthy behaviours (see Doniec et al., 2018; Santucci et al., 2022; Stefler et al., 2021; Stefler et al., 2018; Yakovlev, 2021).
Despite many eastern EU Member States being affected by depopulation, the region does and should fare better in terms of age dependency than the south, and it is on par with the west (Potančoková, 2021, p. 1317). The challenges arising from high age dependency will be greater in southern EU countries than in eastern and western Europe, as their adaptability to population ageing is hindered by relatively low education levels (Potančoková et al., 2021, p. 1345).
5. CONCLUSIONS
Depopulation in the 2010s occurred mostly in eastern and southern Europe. In many of these countries or their regions, this phenomenon has gone on for decades. The most affected were countries and NTS3 units whose populations were reduced annually by natural decrease and migrations.
The findings of the study can be summarised as follows: the populations of eight countries (Bulgaria, Croatia, Greece, Hungary, Latvia, Romania, Serbia, and Ukraine) declined in all years between 2011 and 2020. In Albania, Lithuania, and Portugal, there were only one or two years in that period without population declines. Belarus, Estonia, Montenegro, Spain, and Poland had negative TCRs in several of the sample years. The greatest variety of the types of population change was found for Poland and Spain (six and five, respectively). It is notable that the populations of Bulgaria, Latvia, Lituania, Serbia, Croatia, Romania, Ukraine, and Hungary decreased annually (the countries’ TCRs were negative) after political transition and that in almost all the countries depopulation was a combined effect of migration and a natural decrease.
The worst demographic problems occurred in Bulgaria, Croatia, Latvia, and Romania, where natural causes and migration contributed to population loss in all (or almost all) years in the 2010s.
Emigration was the single reason for population decline in Albania, while natural decrease was in Ukraine, Hungary, Serbia, and Greece (since 2016), and Italy (since 2015).
One-fourth of the NUTS-3 units had a negative TCR in all years from 2015 to 2019. Most of them were in Romania, Portugal, Poland, Hungary, Latvia, Croatia, Spain, Greece, Germany, and Bulgaria.
The majority of NTS3 units with annual population declines from 2015 to 2019 were classified as ‘lagging regions’. Additionally, most of the NTS3 units that recorded population losses between 2015 and 2019 had the oldest populations in 2019, and they belonged to Portugal, Spain, Greece, Italy, and Germany.
Most of the annually depopulating countries were relatively similar in terms of population age structure. NTS3 units with annual population loss and similar population age structures usually occurred within the same country or occupied neighbouring areas in adjacent countries.
Many European regions or countries have reached a point where depopulation cannot be reversed and can only be slowed down. Thus, a policy change towards investments in education or health is necessary to mitigate the negative impact of population shrinkage. It is also needed to increase workers’ human capital enough for productivity gains to offset a likely decrease in the number of workers (Luts and Gailey, 2020, p. 29). Long-term strategies to counter population declines should also address the economic, social, and environmental issues associated with depopulation (ESPON, 2018, p. 9).
It is almost certain that the demographic picture of Europe in the third decade of the 21st century will be different from that in the 2010s, as many regions will be affected by further consolidation of the existing demographic trends. Depopulation processes in areas that have been losing populations for decades will continue in most cases. Also, substantial demographic changes in Europe, especially in its eastern and central parts, can be expected as a result of the war in Ukraine and the exodus of Ukrainian refugees to European countries.
The demographic situation of Europe will also be influenced by Brexit and the COVID-19 pandemic (by temporarily increasing mortality rates, it slightly shortened life expectancy and affected demographic structures), as well as by other developments that may unexpectedly occur in the future (see European Commission, 2023, p. 2).
The ageing of Europe’s population will accelerate in the 2020s, as a result of low fertility rates, increasing life expectancy, migrations, declining percentages of children and working-age people in many countries, and further ageing of the baby-boom generations. These unfavourable trends will require intervention from national and regional social and family policies and labor markets (see, e.g., Brons, 2024; see also European Commission, 2024). “The shrinking working-age population puts pressure on labour markets and welfare states; increases the old-age dependency ratio; and raises the per-capita burden of public debt,” (see European Commission, 2023, p. 2, and European Commission, 2024).
Autorzy
REFERENCES
AURAMBOUT, J. P., SCHIAVINA, M., MELCHIORI, M., FIORETTI, C., GUZZO, F., VANDECASTEELE, I., PROIETTI, P., KAVALOV, B., PANELLA, F. and KOUKOUFIKIS, G. (2021), Shrinking Cities, European Commission, https://publications.jrc.ec.europa.eu/repository/handle/JRC126011 [accessed on: 15.11.2024].
BLOOM, D. E. and CANNING, D. (2008), ‘Global demographic change: Dimensions and economic significance’, Population and Development Review, 34, pp. 17–51.
BRONS, M. (2024), ‘The demographic transition’, [in:] LAGUNA, J. D. (ed.), Ninth report on economic, social and territorial cohesion, Luxembourg, Publications Office of the European Union, pp. 191–213. https://doi.org/10.2776/264833
CZIBERE, I., KOVACH, I., SZUKALSKI, P. and STAROSTA, P. (2021), ‘Depopulation and Public Policies in Rural Central Europe. The Hungarian and Polish Cases’, AGER: Revista de Estudios sobre Despoblación y Desarrollo Rural (Journal of Depopulation and Rural Development Studies), 33, pp. 57–82. https://doi.org/10.4422/ager.2021.20
ČIPIN, I. (2017), ‘Recent Demographic Trends and Policy Initiatives in Croatia’, [in:] ČIPIN, I. and ILIEVA, N., Coping with Demographic Decline in Croatia and Bulgaria, Analysis, Recent demographic trends and policy initiatives in Croatia, https://croatia.fes.de/fileadmin/user_upload/171107_Demografija_WEB.pdf [accessed on: 26.04.2022].
DAHS, A., BERZINS, A. and KRUMINS, J. (2021), ‘Challenges of depopulation in Latvia’s rural areas’, [in:] Proceedings of the 2021 International Conference “Economic Science For Rural Development” Jelgava, LLU ESAF, 11–14 May 2021, pp. 535–545. https://doi.org/10.22616/ESRD.2021.55.055
DAUGIRDAS, V. and POCIŪTĖ-SEREIKIENĖ, G. (2018), ‘Depopulation tendencies and territorial development in Lithuania’, Regional Statistics, 8 (2), pp. 1–23. https://doi.org/10.15196/RS080203
DEIMANTAS, V. J., ŞANLITÜRK, A. E., AZZOLLINI, L. and KÖKSAL, S. (2024), ‘Population Dynamics and Policies in Europe: Analysis of Population Resilience at the Subnational and National Levels’, Population Research and Policy Review, 43 (art no 27), pp. 1–28. https://doi.org/10.1007/s11113-024-09871-w
DOMACHOWSKA, A. (2021), ‘Albania: The Demographic Crisis and Its Consequences’, IEŚ Commentaries, 352 (49), Institute of Central Europe, https://ies.lublin.pl/en/comments/albania-the-demographic-crisis-and-its-consequences/ [accessed on: 24.04.2022].
DONIEC, K., STEFLER, D., MURPHY, M., GUGUSHVILI, A., MCKEE, M., MARMOT, M., BOBAK, M. and KING, L. (2018), ‘Education and mortality in three Eastern European populations: findings from the PrivMort retrospective cohort study’, The European Journal of Public Health, 29 (3), pp. 549–554. https://doi.org/10.1093/eurpub/cky254
ESPON (2017), Shrinking rural regions in Europe, Luxembourg, Espon EGTC, https://www.espon.eu/sites/default/files/attachments/ESPON%20Policy%20Brief%20on%20Shrinking%20Rural%20Regions.pdf [accessed on: 24.04.2022].
ESPON (2018), Fighting rural depopulation in Southern Europe, Luxembourg, Espon EGTC, https://www.espon.eu/sites/default/files/attachments/af-espon_spain_02052018-en.pdf [accessed on: 24.04.2022].
ESPON (2020), ESCAPE. European Shrinking Rural Areas: Challenges, Actions and Perspectives for Territorial Governance. Final Report, Luxembourg, Espon EGTC, https://archive.espon.eu/sites/default/files/attachments/ESPON%20ESCAPE%20Main%20Final%20Report.pdf [accessed on: 15.09.2024].
ESZERGÁR-KISS, D. and CAESAR, B. (2017), ‘Definition of user groups applying Ward’s method’, Transportation Research Procedia, 22, pp. 25–34. https://doi.org/10.1016/j.trpro.2017.03.004
EUROPEAN COMMISSION (2017), Final report. Economic challenges of lagging regions, April, Luxembourg: Publications Office of the European Union. https://doi.org/10.2776/513206
EUROPEAN COMMISSION (2023), Commission staff working document. The impact of demographic change – in a changing environment. Brussels, 17.01.2023, SWD (2023) 21 final, https://commission.europa.eu/system/files/2023-01/the_impact_of_demographic_change_in_a_changing_environment_2023.PDF [accessed on: 10.11.2024].
EUROPEAN COMMISSION (2024), 2024 Ageing Report: Economic & Budgetary Projections for the EU member states (2022–2070), European Economy Institutional Papers, 279, Directorate-General for Economic and Financial Affairs. https://doi.org/10.2765/022983
EUROSTAT (2014), Glossary: Population change, https://ec.europa.eu/eurostat/statistics-explained/index.php?title=Glossary:Population_change [accessed on: 24.04.2022].
EUROSTAT (2020), Eurostat regional yearbook – 2020 edition, Luxembourg: Publications Office of the European Union. https://doi.org/10.2785/764915
EUROSTAT (2023), Eurostat regional yearbook – 2023 edition, Luxembourg: Publications Office of the European Union. https://doi.org/10.2785/243734
FIHEL, A. and OKÓLSKI, M. (2019), ‘Population decline in the post-communist countries of the European Union’, Population & Societies, 567, pp. 1–4, INED. https://doi.org/10.3917/popsoc.567.0001
FRĄTCZAK, E. (2002), ‘Proces starzenia się ludności Polski’, Studia Demograficzne, 2 (142), pp. 3–28.
FREJKA, T. and GIETEL-BASTEN, S. (2016), ‘Fertility and family policies in Central and Eastern Europe after 1990’, Comparative Population Studies, 41 (1), pp. 3–56. https://doi.org/10.12765/CPoS-2016-03
GANAU, R. and KILROY, A. (2023), ‘Detecting economic growth pathways in the EU’s lagging regions’, Regional Studies, 57 (1), pp. 41–56. https://doi.org/10.1080/00343404.2022.2050200
GOLDSTEIN, J. R. (2009), ‘How populations age’, [in:] UHLENBERG, P. (ed.), International handbook of population aging, Dordrecht, Springer, pp. 7–18. https://doi.org/10.1007/978-1-4020-8356-3
GÖTMARK, F., CAFARO, P. and O’SULLIVAN, J. (2018), ‘Aging Human Populations: Good for Us, Good for the Earth’, Trends in Ecology & Evolution, 33 (11), pp. 851–862. https://doi.org/10.1016/j.tree.2018.08.015
GUZI, M., KAHANEC, M. and ULCELUSE, M. M. (2021), ‘Europe’s Migration Experience and Its Effects on Economic Inequality’, [in:] FISCHER, G. and STRAUSS, R. (eds) Europe’s Income, Wealth, Consumption, and Inequality, New York: Oxford University Press, pp. 486–515. https://doi.org/10.1093/oso/9780197545706.003.0014
HASSELBALCH, J. A. (2017), ‘The European Politics of Brain Drain: A Fast or Slow-Burning Crisis?’, CSGRWorking Paper No. 285/17, Centre for the Study of Globalisation and Regionalisation, University of Warwick, http://www.warwick.ac.uk/csgr/papers/285-17.pdf [accessed on: 20.09.2024].
HOSPERS, G. J. (2003), ‘Beyond the blue banana? Structural change in Europe’s geo-economy’, Intereconomics, 38 (2), pp. 76–85. https://doi.org/10.1007/BF03031774
ILIEVA, N. (2017), ‘Territorial Characteristics of the Demographic Processes and Trends in Bulgaria’, [in:] ČIPIN, I. and ILIEVA, N., Coping with Demographic Decline in Croatia and Bulgaria, Analysis, Recent demographic trends and policy initiatives in Croatia, https://croatia.fes.de/fileadmin/user_upload/171107_Demografija_WEB.pdf [accessed on: 24.04.2022].
JAGIELSKI, A. (1978), Geografia ludności, PWN, Warszawa.
JARZEBSKI, M. P., ELMQVIST, T. and GASPARATOS, A., et al. (2021), ‘Ageing and population shrinking: implications for sustainability in the urban century’, npj Urban Sustain, 1, p. 17. https://doi.org/10.1038/s42949-021-00023-z
JOHNSON, K. M. and LICHTER, D. T. (2019), ‘Rural Depopulation: Growth and Decline Processes over the Past Century’, Rural Sociology, 84 (1), pp. 3–27. https://doi.org/10.1111/ruso.12266
JUSKA, A. and WOOLFSON, CH. (2014), ‘Exodus from Lithuania: state, social disenfranchisement and resistance in era of austerity’, [in:] GOODALL, K., MUNRO, W. and MALLOCH, W. (eds), Building justice in post-transition Europe: Processes of criminalisation within central and east European societies, Routledge, pp. 56–77.
KINIORSKA, I., BRAMBERT, P., KAMIŃSKA, W. and KOPACZ-WYRWAŁ, I. (2023), ‘Aging of the society: the European perspective’, Bulletin of Geography. Socio-economic Series, 60, pp. 81–100. http://doi.org/10.12775/bgss-2023-0017
KIRK, D. (1996), ‘Demographic transition theory’, Population Studies, 50, pp. 361–387. https://doi.org/10.1080/0032472031000149536
KOHLER, H. P., BILLARI, F. C. and ORTEGA, J. A. (2002), ‘The emergence of lowest-low fertility in Europe during the 1990s.’, Population and Development Review, 28 (4), pp. 641–680. https://doi.org/10.1111/j.1728-4457.2002.00641.x
KOTOWSKA, I., JÓŹWIAK, J., MATYSIAK, A., and BARANOWSKA, A. (2008), ‘Poland: Fertility decline as a response to profound societal and labour market changes?’, Demographic Research, 19, pp. 795–854. https://doi.org/10.4054/DemRes.2008.19.22
KOYTCHEVA, E. and PHILIPOV, D. (2008), ‘Bulgaria: Ethnic differentials in rapidly declining fertility’, Demographic Research, 19, pp. 361–402. https://doi.org/10.4054/DemRes.2008.19.13
LERCH, M. (2018), ‘Fertility and union formation during crisis and societal consolidation in the Western Balkans’, Population Studies. A Journal of Demography, 752 (2), pp. 217–234. https://doi.org/10.1080/00324728.2017.1412492
LESTHAEGHE, R. (2010), ‘The unfolding story of the second demographic transition’, Population and Development Review, 36 (2), pp. 211–251. https://doi.org/10.1111/j.1728-4457.2010.00328.x
LESTHAEGHE, R. (2020), ‘The second demographic transition, 1986–2020: sub-replacement fertility and rising cohabitation – a global update’, Genus, 76, article no. 10. https://doi.org/10.1186/s41118-020-00077-4
LEVCHUK, N. (2009), Alcohol and mortality in Ukraine, MPIDP Working Paper WP 2009-017. https://doi.org/10.4054/MPIDR-WP-2009-017
LUTZ, W. and GAILEY, N. (2020), Depopulation as a Policy Challenge in the Context of Global Demographic Trends, Human Development Series, UNDP Serbia, https://eeca.unfpa.org/sites/default/files/pub-pdf/depopulation20as20a20policy20challenge.pdf [accessed on: 24.04.2022].
MAJDZIŃSKA, A. (2021), ‘The types of fertility patterns in Europe’, Journal of Geography, Politics and Society, 11 (2), pp. 50–66. https://doi.org/10.26881/jpgs.2021.2.06
MAJDZIŃSKA, A. (2022), ‘The typology of first marriage patterns in Europe’, Journal of Geography, Politics and Society, 12 (3), pp. 14–30. https://doi.org/10.26881/jpgs.2022.3.02
MARINKOVIĆ, I. (2020), ‘Demografska slika Srbije’, Napredak – časopis za političku teoriju i praksu, 1 (1), pp. 99–108. https://doi.org/10.5937/Napredak2001099M
MARINKOVIĆ, I. and RADIVOJEVIĆ, B. (2016), ‘Mortality trends and depopulation in Serbia’, Geographica Pannonica, 20 (4), pp. 220–226. https://doi.org/10.5937/GeoPan1604220M
MERINO, F. and PRATS, M. A. (2020), ‘Why do some areas depopulate? The role of economic factors and local governments’, Cities, 97, pp. 1–13. https://doi.org/10.1016/j.cities.2019.102506
MUNTELE, I., ISTRATE, M., ATHES, H. and BĂNICĂ, A. (2023), ‘An Overview of Population Dynamics in Romanian Carpathians (1912–2021): Factors, Spatial Patterns and Urban–Rural Disparities’, Land, 12, 1756. https://doi.org/10.3390/land12091756
MUREŞAN, C., HĂRĂGUŞ, P. T., HĂRĂGUŞ, M. and SCHRÖDER, C. (2008), ‘Romania: Childbearing metamorphosis within a changing context’, Demographic Research, 19, pp. 855–906. https://doi.org/10.4054/DemRes.2008.19.23
NEWSHAM, N. and ROWE, F. (2022), ‘Understanding trajectories of population decline acrossrural and urban Europe: A sequence analysis’, Population, Space and Place, 29 (3), pp. 1–16. https://doi.org/10.1002/psp.2630
NIKITOVIĆ, V., ARSENOVIĆ, D., SEKULIĆ, A. and BAJAT, B. (2019), ‘Is the Second Demographic Transition a useful framework for understanding the spatial patterns of fertility change in Serbia at the beginning of the 21st century?’, AUC Geographica 54 (2), pp. 152–167. https://doi.org/10.14712/23361980.2019.14
OLÁH, L. Sz. (2015), Changing families in the European Union: trends and policy implications, Families and Societies Working Paper, 44, http://www.familiesandsocieties.eu/wp-content/uploads/2015/09/WP44Olah2015.pdf [accessed on: 20.09.2024].
PERELLI-HARRIS, B. (2008), ‘Ukraine: On the border between old and new in uncertain times’, Demographic Research, 19, pp. 1145–1178. https://doi.org/10.4054/DemRes.2008.19.29
PHILIPOV, D. (2002), Fertility in times of discontinuous societal change: The case of Central and Eastern Europe, MPiDR working paper 2002-024. https://doi.org/10.4054/MPIDR-WP-2002-024
PHILIPOV, D. (2003), ‘Major trends affecting families in Central and Eastern Europe. Major trends affecting families: A background document’, New York: United Nations Programme on the Family, pp. 27-44.
PHILIPOV, D. and KOHLER, H. (2001), ‘Tempo effects in the fertility decline in Eastern Europe: Evidence from Bulgaria, the Czech Republic, Hungary, Poland, and Russia’, European Journal of Population, 17 (1), pp. 37–60. https://doi.org/10.1023/A:1010740213453
PILATI, M. and HUNTER, A. (2020), Research for REGI Committee – EU Lagging Regions: state of play and future challenges, Brussels: European Parliament, Policy Department for Structural and Cohesion Policies.
PINILLA, V. and SÁEZ, L. A. (2017), Rural depopulation in Spain: Genesis of a problem and innovative policies, CEDDAR, https://sspa-network.eu/wp-content/uploads/Informe-CEDDAR-def-1_EN-GB-1.pdf [accessed on: 24.04.2022].
PIRES DE ALMEIDA, M.A. (2017), ‘Territorial inequalities: depopulation and local development policies in the Portuguese rural world’, Ager. Revista de Estudios sobre Despoblación y Desarrollo Rural, 22, pp. 61–87. https://doi.org/10.4422/ager.2016.08
PIRES DE ALMEIDA, M.A. (2018), ‘Fighting depopulation in Portugal: Local and central government policies in times of crisis’, Portuguese Journal of Social Science, 17 (3), pp. 289–309. https://doi.org/10.1386/pjss.17.3.289_1
POTANČOKOVÁ, M., STONAWSKI, M., and GAILEY, N. (2021), ‘Migration and demographic disparities in macro-regions of the European Union, a view to 2060’, Demographic Research, 45, Article 44. https://doi.org/10.4054/DemRes.2021.45.44
POTANČOKOVÁ, M., VAŇO, B., PILINSKÁ, V. and JURČOVÁ, D. (2008), ‘Slovakia: Fertility between tradition and modernity’, Demographic Research, 19, pp. 973–1018. https://doi.org/10.4054/DemRes.2008.19.25
RAŠEVIĆ, M. (2017), ‘Low fertility in Serbia: new insight’, [in:] JANESKA, V. and LOZANOSKA, A. (eds), The population of the Balkans at the dawn of the 21st century, Fifth International Conference of the Balkans Demography, Ohrid, 21–24 October 2015, Skopje: Cyril and Methodius University in Skopje, Institute of Economics, pp. 31–41. http://iriss.idn.org.rs/187/1/MRasevic_Low_fertility_in_Serbia.pdf [accessed on: 29.04.2022].
RAŠEVIĆ, M. and GALJAK, M. (2022), ‘Demographic Challenges in Serbia’, [in:] MANIC, E., NIKITOVIC, V. and DJUROVIC, P. (eds), The Geography of Serbia. Nature, People, Economy, World Regional Geography Book Series, Switzerland: Springer, pp. 143–155. https://doi.org/10.1007/978-3-030-74701-5_11
RECAÑO, J. (2017), The Demographic Sustainability of Empty Spain. Perspectives Demogràfiques. CED. https://doi.org/10.46710/ced.pd.eng.7
REYNAUD, C. and MICCOLI, S. (2018), ‘Depopulation and the ageing population: The relationship in Italian municipalities’, Sustainability, 10 (4), p. 1004. https://doi.org/10.3390/su10041004
SANTUCCI, C., PATEL, L., MALVEZZI, M., WOJTYLA, C., La VECCHIA, C., NEGRI, E. and BERTUCCIO, P. (2022), ‘Persisting cancer mortality gap between western and eastern Europe’, European Journal of Cancer, 165, pp. 1–12. https://doi.org/10.1016/j.ejca.2022.01.007
SHVINDINA, H. (2016), ‘The depopulation in Ukraine: Trapped in mortality crisis’, Forum Scientiae Oeconomia, 4 (1), pp. 5–19.
STANKUNIENE, V. and JASILIONIENE, A. (2008), ‘Lithuania: Fertility decline and its determinants’, Demographic Research, 19, pp. 705–742. https://doi.org/10.4054/DemRes.2008.19.20
STEFLER, D., MURPHY, M., IRDAM, D., HORVAT, P., JARVIS, M., KING, L., MCKEE, M. and BOBAK, M. (2018), ‘Smoking and Mortality in Eastern Europe: Results From the PrivMort Retrospective Cohort Study of 177 376 Individuals’, Nicotine & Tobacco Research, 20 (6), pp. 749–754. https://doi.org/10.1093/ntr/ntx122
STEFLER, D., BRETT, D., SARKADI-NAGY, E., et al. (2021), ‘Traditional Eastern European diet and mortality: prospective evidence from the HAPIEE study’, European Journal of Nutrition, 60, pp. 1091–1100. https://doi.org/10.1007/s00394-020-02319-9
SZUKALSKI, P. (2019), ‘Depopulacja – wybrane konsekwencje dla lokalnej polityki społecznej’, Polityka Społeczna, 10, pp. 10–15.
TATARENKO, A. (2021), ‘Romania: 30 years of demographic decline’, IEŚ Commentaries, 348 (45), Institute of Central Europe, https://ies.lublin.pl/wp-content/uploads/2021/03/ies-commentaries-348-45-2021.pdf [accessed on: 30.04.2022].
TRUSKOLASKI, T. and BUGOWSKI, Ł. K. (2022), ‘The Process of Depopulation in Central and Eastern Europe – Determinants and Causes of Population Change between 2008 and 2019’, European Research Studies Journal, XXV (3), pp. 3–21. https://doi.org/10.35808/ersj/2990
UBAREVIČIENĖ, R. and BURNEIKA, D. (2020), ‘Fast and uncoordinated suburbanization of Vilnius in the context of depopulation in Lithuania’, Environmental & Socio-economic Studies, 8 (4), pp. 44–56. https://doi.org/10.2478/environ-2020-0022
VAN DE KAA, D. J. (1987), ‘Europe’s Second Demographic Transition’, Population Bulletin, 42 (1), pp. 1–59.
VAN DE KAA, D. J. (1997), ‘Options and sequences: Europe’s demographic patterns’, Journal of Australian Population Association, 14 (1), pp. 1–29. https://doi.org/10.1007/BF03029484
VAN DE KAA, D. J. (2003), ‘The idea of a Second Demographic Transition in industrialized countries’, Journal of Population and Social Security: Population Study, 1 (1).
WARD, J. H. (1963), ‘Hierarchical Grouping to Optimize an Objective Function’, Journal of the American Statistical Association, 58 (301), pp. 236–244. https://doi.org/10.1080/01621459.1963.10500845
WEBB, J. W. (1963), ‘The Natural and Migrational Components of Population Changes in England and Wales, 1921–1931’, Economic Geographypp. – https://doi.org/10.2307/142506
WILLEKENS, F. (2015), ‘Demographic transitions in Europe and the World’, [in:] MATTHIJS, K., NEELS, K., TIMMERMAN, C., HAERS, J. and MELS, S. (eds), Population change in Europe, the Middle-East and North Africa. Beyond the demographic divide, London: Ashgate Publishing, pp. 13–44.
WORLD HEALTH ORGANIZATION (WHO) (2018), European Health Report 2018. More than numbers – evidence for all, Denmark: World Health Organization, Regional Office for Europe.
YAKOVLEV, E. (2021), ‘Alcoholism and mortality in Eastern Europe’, IZA World of Labor, 168, pp. 1–11. https://doi.org/10.15185/izawol.168.v2
ZARINS, E. and PAIDERS, J. (2020). ‘Factors affecting and determining local depopulation’, Folia Geographica. New Geographies of Wellbeing: Nature, Resources, Populations And Mobilities, 18, pp. 13–19. https://doi.org/10.22364/fg.18.2
ZATOŃSKI, M., ZATOŃSKI, W. A. and WOJTYŁA, A. (2016), ‘Premature mortality: Europe’s persisting iron Curtain?’, Journal of Health Inequal, 2 (1), pp. 3–6. https://doi.org/10.5114/jhi.2016.61412
ZIMNY, A. and ZAWIEJA-ŻUROWSKA, K. (2015), ‘«Blue Banana» or Central and Eastern Europe? The Development of European Logistics Hubs’, Revija za ekonomske in poslovne vede, 2 (1), pp. 97–111.
Eurostat database, https://ec.europa.eu/eurostat/data/database [accessed on: 30.07.2021].
Eurostat, GISCO, https://ec.europa.eu/eurostat/web/gisco/geodata/reference-data/administrative-units-statistical-units/countries [accessed on: 30.08.2021].
Eurostat, GISCO, https://ec.europa.eu/eurostat/web/gisco/geodata/reference-data/administrative-units-statistical-units/nuts [accessed on: 30.08.2021].
United Nations, Department of Economic and Social Affairs, Population Division (2019), World Population Prospects 2019, Online Edition. Rev. 1, https://population.un.org/wpp/Download/Standard/Population/ [accessed on: 25.04.2022].
FOOTNOTES
- 1 In the early 2010s, the countries with the highest TFRs (1.9–2.0 children per woman) were France, Iceland, Ireland, Norway, Sweden, United Kingdom, Finland, and Belgium; at the end of that decade, the highest TFR (1.7–1.8) occurred in Bulgaria, Czechia, France, Iceland, Ireland, Montenegro, Romania, Sweden, and Denmark. In all (or most) years of the 2010s, the lowest TFRs (below 1.4) were noted in Cyprus, Greece, Italy, Malta, Poland, Portugal, Spain, and Ukraine (Eurostat data).
- 2 European countries have different mortality rates. The lowest mortality occurs in the south and north of Europe (particularly in Switzerland, Spain, Italy, Iceland, Sweden, Norway, France, and Liechtenstein) where at the end of the 2010s (excluding 2020) the average life expectancy of a new-born (male or female) was 83–84 years; the highest mortality characterises the post-communist countries (particularly Ukraine, Bulgaria, Romania, Latvia, Lithuania, and Serbia), with an average life expectancy of 73–76 years (Eurostat data). In 2020 and 2021, mortality rates in most European countries were higher than in 2019 due to the COVID-19 pandemic (hence life expectancy was lower than before).
- 3 The changes include older average age at marriage, older age of mothers at first birth, fewer marriages, an increasing number of informal relationships, more people choosing not to have children, an increasing percentage of extramarital births, and a falling percentage of multi-child families. The changes are mainly driven by the evolving societal background, including a “rise of «higher order» needs: individual autonomy, self-actualisation, expressive work and socialisation values” […], “rising symmetry in gender roles, female economic autonomy” (Lesthaeghe, 2010, pp. 5–6; see also van de Kaa, 1997; van de Kaa, 2003). “The growing proportion of women giving birth later in life […] may be linked, among other factors, to: higher female participation rates in further education and/or more women choosing to establish a career before starting a family; lower levels of job security (for example, in precarious employment), the increasing cost of raising children and of housing” (European Commission, 2023, p. 28).
- 4 The Demographic Transition Theory describes changes in societies that “experience modernization progress from a premodern regime of high fertility and high mortality to a post-modern one, in which both are low” (Kirk, 1996, p. 361).
- 5 “Ward’s method is agglomerative; thus, it partitions elements into a dedicated number of clusters in several steps. First, each element is independent, and then step by step, more elements are ordered to a cluster. At each step, the method includes those elements which are the ‘closest’ (according to a metric) to the existing clusters. The number of steps may reach from 1 to n (number of analysed elements). In [the] case of 1, only one single cluster contains all elements, while in the case of n, all elements form [their] own cluster. Once a cluster is created as a result of a step, the elements of the new cluster cannot be separated again. The algorithm tries to find the optimal number of clustering steps” (Eszergár-Kiss and Caesar, 2017, p. 26).
- 6 The analyses were conducted in 2010s because in many regions population processes dynamically changed during that decade, especially in its second part. The author decided to finish the regional analysis (at the NUTS-3 level) with 2019 because of the Covid-19 pandemic outbreak at the end of that year. The pandemic disturbed the demographic processes that had been observed so far, and some demographic data for 2020 were particularly unusual in many regions.
- 7 European countries differ significantly in family formation and fertility patterns because they are determined by country-specific demographic, social, cultural, and economic factors (Kirk, 1996; Willekens, 2015; Kohler et al., 2002).
- 8 The optimal group sizes were determined based on the outcomes of the analysis of amalgamation schedule graphs in Statistica software. The scale applied to Euclidean distances (Fig. 10) was appropriately modified using the following formula: (linkage distance)/(maximum linkage distance) *100.
- 9 The “Blue Banana” or “Bluemerang” is a banana-shaped area formed by linking the economically vibrant metropolitan centres in England, Belgium, the Netherlands, the western part of Germany, Switzerland, and Italy (see, for instance, Hospers, 2003; Zimny and Zawieja-Żurowska, 2015).
- 10 In the European Commission’s Report of 2017, regions located in the eastern part of the EU (particularly those in eastern Poland, Bulgaria, Romania, and in southern and eastern Hungary) were described as “low income lagging regions” (“regions with a GDP per head in PPS below 50% of the EU average in 2013”), and regions in Portugal, southern Spain, southern Italy, and southern Greece as “low growth lagging regions” (“that did not converge to the EU average GDP per head at PPS between the years 2000 and 2013”), (European Commission, 2017, pp. 4 and 16–17). Ganau and Kilroy (2023, p. 46) classified NTS3 units located mainly in the Baltic States, Poland, Romania, Bulgaria, Croatia, and Serbia as “lagging low income” areas, and regions in Portugal, Spain, southern Italy, and southern Greece ad “lagging low growth” areas.