
ESTIMATING URBAN GROWTH ON MERSIN, TARSUS AND ADANA CORRIDOR IN TÜRKİYE BY USING CELLULAR AUTOMATA AND MARKOV CHAIN
Selin YILDIZ GORENTAS  *
*
Sevil SARGIN *
Abstract. In many developing countries, urban growth is often unplanned and haphazard, leading to significant threats to the sustainable use of urban land. This study predicts future urban expansion patterns in the Mersin, Tarsus and Adana corridor in Türkiye using Cellular Automata and Markov Chain models. Analysing Landsat satellite images from 1989 to 2019, we simulated land use changes for 2019, 2031, and 2049. The results indicate a projected increase in urban areas from 3.8% in 2019 to 7.4% by 2049, with significant expansion onto fertile agricultural areas. This unregulated growth highlights the urgent need for a well-planned governance approach that balances economic, social, and environmental factors to ensure resilient and sustainable urban development.
Key words: urban growth simulation, CA_Markov model, land cover/use, Türkiye.
1. INTRODUCTION
Rapid urbanisation in the developing countries triggers significant land use changes which threaten economic and environmental sustainability (Theres et al., 2023). Unplanned urban expansion often leads to deterioration of fertile lands. Transformation of agricultural lands into commercial, residential, and industrial areas poses serious threats to the ecosystems, as well as the sustainability of the economic growths (Al-sharif and Pradhan, 2014). Urbanisation is a complex process that requires careful planning. Simulating future urban expansion is essential for improving planning policies.
There is a growing literature on urban expansion and the problems that it causes (Bayrakdar et al., 2020; Belal and Moghanm, 2011; Cai et al., 2015; Ishtiaque et al., 2017; Kaya and Curran, 2006; Mundia and Aniya, 2005; Tariq et al., 2023). Land-use change is one of the most popular topics in the environmental and sustainable development research area. Various studies have examined how rapid alters spatial patterns in cities (Mohan et al., 2011), contributes to environmental pollution (Sun et al., 2019), and results in the overconsumption of natural resources (Ahmad et al., 2017). The conversion of agricultural and forestry lands to built-up areas is another critical issue that threatens ecological and economic sustainability (Theres et al., 2023). These studies collectively suggest that the problems associated with urban expansion will persist, making it essential to predict spatial changes in urban areas. Estimating urban growth is particularly crucial for developing countries to observe and predict the future of urban expansion to improve planning policies for more sustainable economic developments and the ecosystems (Theres et al., 2023).
Urban growth simulations, developed by urban growth models, provide information about the possible directions of urban growth, boundaries, and changes in land use of cities (Kong et al., 2012). These simulations facilitate location-based planning by forecasting the future spatial pattern and preventing the degradation of natural areas beforehand. Urban growth models have been used in developing ideal simulations of spatial sustainability and the conservation of natural areas, in addition to revealing a possible spatial pattern (Liu and Feng, 2011; Martellozzo et al., 2018). They provide well-needed data for local governments and policymakers to design nature-friendly and sustainable urban planning.
There are various computer-based programs that predict urban growth by integrating parameters such as land use, population, employment, and transportation (Bhatta, 2010). Complex urban growth models, including Logistic Regression, Artificial Neural Networks, and Agent-Based Modelling are commonly employed to simulate the future of cities with different spatial dynamics (Ozturk, 2015; Pooyandeh et al., 2007). Logistic Regression is widely used to model the probability of land use change by analysing various spatial factors such as proximity to roads, population density, and land value (Hu and Lo, 2007). Artificial Neural Networks provide an advanced approach to modelling urban growth. They are capable of processing extensive datasets and accommodating the complex interactions, such as those involving economic activities, infrastructure development, and demographic changes (Pijanowski et al., 2002). Agent-Based Modelling adopts a distinct approach by simulating the interactions of individual agents, such as households, businesses, or governments. It provides a valuable framework for exploring how micro-level behaviours and decisions coalesce to generate macro-level patterns of urban growth (Dai et al., 2024; Parker et al., 2003). While these methodologies, each with its unique strengths, offer valuable insights into urban growth, this study utilises the integration of Cellular Automata and Markov Chain methods to capture the spatial and temporal dynamics of urbanisation in greater detail.
Many studies have used the integration of different methods instead of a single modelling method to develop urban growth simulations (Basse et al., 2014; Cagliyan and Dagli, 2022; Guan et al., 2011; Iizuka et al., 2017; Liu et al., 2015; Losiri et al., 2016). Among these, the integration of Cellular Automata (CA) and Markov Chain (MC) models has emerged as a particularly effective method for predicting land use changes and urban growth (Guan et al., 2011; Moghadam and Helbich, 2013; Mohamed and Worku, 2020; Myint and Wang, 2006). The CA model is capable of simulating complex spatial dynamics by considering the local interactions between neighbouring cells, while the MC model provides a statistical framework for predicting future states based on historical data. The foundation of MC is to determine the probability of future situations using the possibilities of change between past and present situations (Mondal et al., 2017). MC performs the probability analysis based on the number of cells in the probability matrix (Arsanjani et al., 2013). It is vital to support modelling spatially because the MC disregards the location and condition of the cells. The incorporation of the CA and MC provides more effective and reliable simulations (Ke et al., 2016; Rimal et al., 2017). CA refers to the state change that the status change of each cell in an image depends on the status of the cells around it for a certain period (Wang, 2012). Each city has its own different physical, socio-economic, and spatial dynamics. Hence, CA-MC integration, which helps to identify many variables in the modelling process, is a significant and effective method for predicting future land use changes.
CA-MC modelling has been widely used in recent years as it is a powerful method for evaluating urban growth (Ghosh et al., 2017). It is particularly significant to use CA-MC modelling in the developing countries to understand the spatial changes of cities with different features (Aburas et al., 2021). CA-MC modelling enables the evaluation of different driving factors together to obtain more accurate simulations. Theres et al. (2023) has also emphasised that there is limited data about the future of urban growth in the developing countries, and indicated the need for further research that would consider multiple driving factors together that affect urban growth.
This study aims to simulate potential future urban growth patterns on the Mersin, Tarsus and Adana corridor by using the Cellular Automata and Markov Chain methods. The primary goal is to forecast the spatial implications of urbanisation in this region and provide insights that could guide sustainable urban planning. By doing so, the study seeks to inform local policymakers and urban planners about the probable directions of urban expansion. The study firstly obtained the land cover/use maps and conversion matrices from 1989 to 2019. Using these matrices, the simulation map of 2019 was produced and compared with the actual land cover/use map of 2019 to determine the accuracy of the model. After reaching high accuracy rates, the urban growth of 2031 and 2049 was simulated.
The Mersin, Tarsus and Adana corridor is one of the most populated and developed urban areas in Türkiye, characterised by a unique set of features that make it the ideal study area. The region is densely populated, continues to attract more residents, serves as a major industrial and commercial hub, and includes significant agricultural areas. These factors contribute to rapid urban growth, which poses risks to the region’s environmental sustainability. Sustainable urban growth planning is essential, and predicting the future directions of urban expansion is a critical component of this effort.
Numerous studies have examined urban growth in this region (Adiguzel et al., 2015; Akin Tanriover, 2011; Gulersoy et al., 2014; Kara, 1988; Sargin, 1998). These studies are critical in understanding the urban growth of the region. However, when the existing literature is analysed, this study differs from previous studies in some respects. Previous studies focused on one of the cities of Mersin, Tarsus or Adana and analysed them individually. The spatial growth of these cities, which are in close proximity and constantly interact, cannot be considered independently. Studies that examine them individually make it difficult to evaluate the region as a whole and to understand the multi-centred and multi-functional structure of the region (Batman, 2014). This research adopts a holistic approach, analysing Mersin, Tarsus and Adana as an integrated urban region, which is crucial for accurately capturing the complex urban dynamics. Additionally, previous studies have mostly focused on the past and present land use change of the cities and its impacts. An important gap in the literature is the prediction of the future urban growth. There is only one study that focused on the future of the urban growth in the region. Akin Tanriover’s (2011) work focuses on only Adana city as the research area and it aimed to determine an accurate modelling method by comparing different urban growth models. Considering all these, this study constitutes valuable and unique research for both considering these three cities as one region and simulating the future urban growth that is well-needed to improve the planning policies for the environmental and economic sustainability of the region.
2. MATERIALS AND METHODS
2.1. Study area
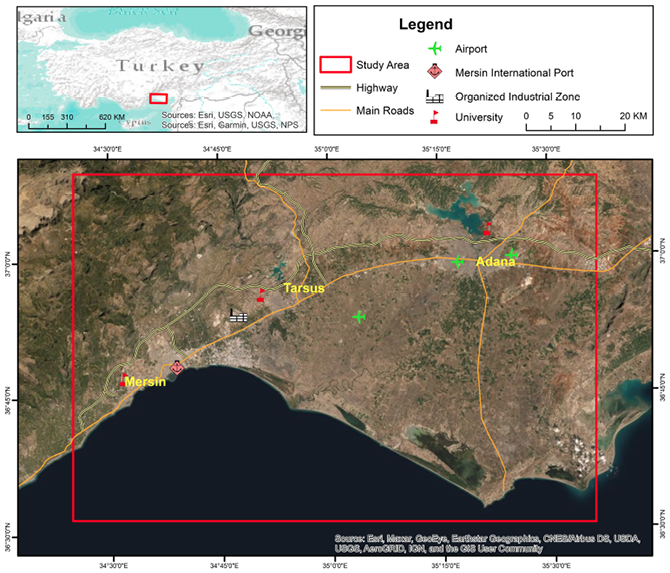
The Mersin, Tarsus and Adana corridor, one of Türkiye’s most important urban agglomerations, has a considerably dynamic structure. It covers an area of approximately 7,453 km2 in southern Türkiye and east of the Mediterranean Sea (Fig. 1). The north-western part of the region is mountainous and rough, while other parts are relatively flat. The study area has a central position in administrative, industrial, commercial, social, cultural, and logistical characteristics. Cukurova, forming the southern part of the cities of Tarsus and Adana, is among Türkiye’s largest and most productive plains, which shapes the region’s economy with its significant water supply and agricultural potential. The presence of the main transportation lines, the location of the port of Mersin and its airports, and the activities of industrial and commercial enterprises attract the population from different centres to the region.
The conurbation process between Mersin, Tarsus, and Adana in southern Türkiye is rooted in the region’s rich historical and geographical significance, which has shaped its modern urban landscape. Adana, with its ancient origins and strategic location on the Seyhan River, has long been a key agricultural and commercial centre, particularly flourishing during the Ottoman period with the development of cotton production (Falay, 2020). Tarsus, one of the world’s oldest continuously inhabited cities, has been an important cultural and trade hub since antiquity, notably during the Roman and Byzantine eras (Deniz and Umar, 2023). Mersin, although a relatively newer city, rapidly developed in the 19th and 20th centuries due to its port, which became crucial for regional and international trade (Dönmez, 2022). The conurbation process accelerated in the late 20th century, driven by the expansion of transportation infrastructure, including highways and railways, which facilitated the economic and physical integration of these cities. This integration saw Adana continue as an industrial powerhouse, Mersin as a vital trade port, and Tarsus maintaining its cultural significance. The merging of these urban areas has formed a large, continuous metropolitan region, reflecting both the historical importance of each city and the modern challenges of urban planning, infrastructure demands, and sustainable development in this dynamic region of Türkiye.
Mass housing projects, as well as industrial, transportation, energy, and socio-cultural investments on a national scale have led to both the spatial expansion of the cities in the region and the rapid increase in population. The cities in the study area are connected to each other and functional relationships are maintained and sustained along transportation lines. Especially the transportation lines extending in the southwest-northeast direction are parallel to the spatial distribution of the cities. The cities of Mersin, Tarsus, and Adana provide fast and easy access both to each other and to important centres outside the region in terms of economic relations. Cukurova, one of the largest and most productive agricultural basins in Türkiye, is located within the research area. Cukurova’s high agricultural potential and the fact that it is the source of the agro-industries in the region emphasise the importance of this basin in the regional economy.
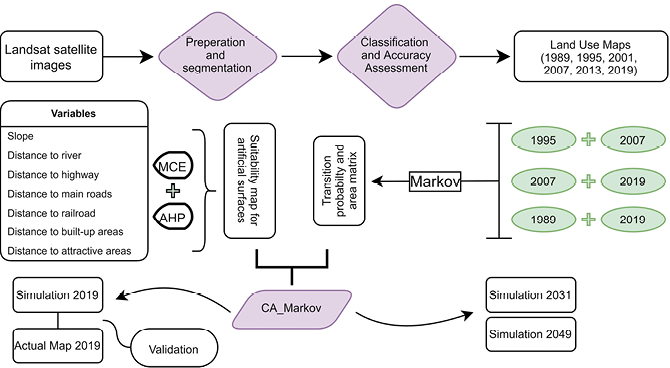
The data analysis of this study has been conducted in three phases using the IDRISI Selva 17.0 software (Fig. 2). The first was the preliminary preparation phase, which steps for obtaining satellite images and optimising them for classification. The second phase was to produce land cover/use maps with the classification of satellite images and accuracy analyses. The third phase was modelling, consisting of change detection, suitability analysis, CA_Markov, and validation processes.
Source: own work.
Source: own work.
2.2. Preparation of satellite images
The study utilised a variety of data sources to model and predict urban growth in the Mersin-Tarsus-Adana corridor. The primary data consisted of Landsat satellite images spanning 30 years, from 1989 to 2019 (Table 1). These images were obtained from the United States Geological Survey (USGS), specifically from the Landsat 4–5 Thematic Mapper (TM) sensors for the years 1989, 1995, 2001, and 2007, and the Landsat 8 Operational Land Imager (OLI) sensors for the years 2013 and 2019 (USGS, 2020). The spatial resolution of these images was 30 meters, which provided a sufficient level of detail for analyzing land cover/use changes over time. In addition to satellite imagery, the study also incorporated several ancillary datasets, including topographic maps, development plans, Digital Elevation Model (DEM), and various vector datasets representing infrastructure, water bodies, and protected areas. These supplementary datasets were crucial for the land-use suitability analysis and for refining the accuracy of the simulation models. The DEM data was obtained from USGS, while the remaining data were sourced from the local government units in Adana, and Mersin.
| 1989 | 1995 | 2001 | 2007 | 2013 | 2019 | |
|---|---|---|---|---|---|---|
| TIME | 25 July | 12 September | 10 July | 25 June | 13 September | 26 June |
| SENSOR | TM | TM | TM | TM | OLI | OLI |
Source: USGS, 2020.
Preparing satellite images for classification consists of data conversion, image fusion, clipping, band combination, and segmentation steps. The segmentation process was implemented to prepare satellite images for classification. This makes it easier for the user to assign pixels that are grouped homogeneously according to spectral similarities to the most appropriate land cover/use class (Eastman, 2016). Six land cover/use classes were then defined based on CORINE (the Coordination of Information on the Environment) land cover system involving artificial surfaces, agricultural areas, forest, semi-natural areas, wetland, and water bodies (Table 2).
| Land cover/ use type |
Description |
|---|---|
| Artificial Surfaces | Residential areas, public buildings, commercial and industrial areas, roads. |
| Agricultural Areas | Arable lands, dry and irrigated farming fields, vineyards, orchards, olive groves. |
| Forest | Forests, green spaces. |
| Semi-Natural Areas | Maquis shrublands, coastal areas, sandy beaches, bare lands. |
| Wetlands | Marshes, salt fields. |
| Water Bodies | Sea, rivers, lakes, lagoons. |
Source: own work based on CORINE Land Cover (European Environment Agency, 2020).
2.3. Classification and accuracy assessment
The classification of satellite images was conducted using a supervised classification method, specifically the maximum likelihood classification technique. This approach relies on the identification of sample areas (or training datasets) for each land cover/use class. In this study, six land cover/use classes were defined based on the CORINE land cover system: artificial surfaces, agricultural areas, forest, semi-natural areas, wetlands, and water bodies.
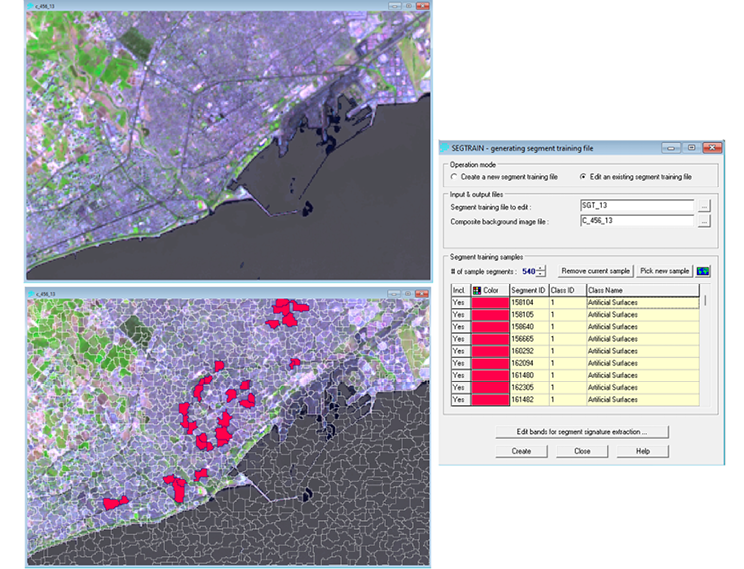
The sampling process involved selecting more than 500 sample areas for each dataset year. These sample areas were manually defined on the segmented satellite images based on known land cover/use characteristics (Fig. 3). The selection of these sample areas was guided by expert knowledge, previous studies, and visual interpretation of the satellite imagery. The use of many sample areas ensured that the classification was robust and representative of the actual land cover/use conditions in the study area.
The maximum likelihood technique was used to implement supervised classification through the defined training datasets. Supervised classification is about classifying unknown similar pixels using known similar samples (Campbell and Wynne, 2011). In this way, the pixels identified by the user on a satellite image are grouped in a given range of reflection and assigned to the appropriate class. Maximum likelihood, one of the supervised classification techniques, is a method that uses the mean and variance values of sampled fields and calculates the probability of pixels in each class (Eastman, 2016). Finally, six land cover/use maps obtained for different years from 1989 to 2019.
The accuracy of the classified maps was evaluated using the stratified random sampling method, which relies on selecting independent samples from each group that formed the universe. This involved selecting 300 sample points for each classified map, which were then compared to the actual land cover/use data to determine the classification accuracy. Accordingly, the error matrix and accuracy rates for six land cover/use maps have been obtained (Table 3). The overall accuracy of the classified maps ranged from 90% to 94%, with Kappa values exceeding 85%, indicating a high level of reliability and agreement between the classified maps and actual land cover/use conditions.
Source: own work.
| 1989 | 1995 | 2001 | 2007 | 2013 | 2019 | |
|---|---|---|---|---|---|---|
| Overall accuracy (%) | 90 | 92 | 90 | 93 | 92 | 94 |
| Kappa (%) | 84 | 87 | 83 | 89 | 87 | 89 |
Source: own work.
2.4. Modelling
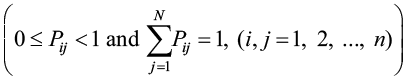
We employe Markov Chain and Cellular Automata modelling methods to predict possible urban growth. The Markov Chain determines the future land cover/use by using the transition probability of each land cover/use class to itself and others between years. Collins (1975) emphasised that conversion matrices identify the probability of transition between states. According to the mathematical formula of the Markov Chain, it refers to where Pij is the transition probability matrix, and n is the land use type (Sang et al., 2011) as Eq. 1. A prediction model based on the Bayes probability formula is obtained when the Markov Chain analysis meets the Pij state (Rimal et al., 2017) (Eq. 2). P(n) refers to the probability state of the system on the requested date, the first state vector of the P(n–1) system (Harvey, 2013) (Eq. 3).
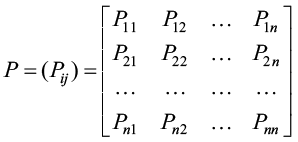
(1)
(2)
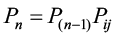
(3)
The cellular automation method that supports the model spatially has five components representing space: cell, state, neighbourhood, transition rule, and time (Liu, 2008). The components of the cellular automation system exist in the mathematical formula below (Eq. 4). Accordingly, S(t+1), SN, f, and S(t) represent the state of the cell at t+1 time, the neighbourhood state, the function of the transition rules, and the cell’s state at t time, respectively (Pooyandeh et al., 2007).
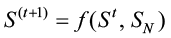
(4)
The prediction of the region’s land cover/use change relies on the implementation of modelling by producing conversion matrices and suitability maps and validating the simulation. The study aims to develop three different scenarios: the present, the near future, and the distant future:
- To perform the land cover/use simulation for 2019 by using land cover/use maps of 1995 and 2007. Therefore, the model can be verified by comparing the actual map with the simulation.
- To perform the land cover/use simulation for 2031 by using land cover/use maps of 2007 and 2019.
- To perform the land cover/use simulation for 2049 by using land cover/use maps of 1989 and 2019.
2.5. Change detection
The spatial pattern predictions for the coming years emerge by considering the spatial changes experienced in the past years. For instance, the spatial situation of 2031 was predicted by estimating the spatial changes the had occurred between 2007 and 2019. It is assumed that the spatial changes estimated between 2007 and 2019 will remain the same between 2019 and 2031. The Markov module and Cross-Tabulation analyses were used to identify land-use changes for the three targets. Accordingly, the study has reached the probability-based matrix of the conversion movement of land-use classes to other classes.
2.6. Suitability analysis
The land-use suitability analysis was a critical step in the modelling process, and it involved the fuzzification of various driving factors that influence spatial changes. Fuzzification is the process of transforming input values into degrees of membership within a fuzzy set, which enables more flexible and realistic modelling of spatial phenomena.
In this process, a user should know and define the parameters that will affect spatial changes in a study area. Land-use suitability analysis refers to the process of reaching the most appropriate spatial pattern for a land cover/use class with identification of various variables (Malczewski, 2004). This process enables users to manage the modelling to determine the most appropriate and correct future land uses. Land-use suitability analysis for the artificial area class was conducted for the simulations. The Multi-Criteria Evaluation (MCE) method, which includes the identification of variables, the fuzzy logic for scale standardisation, and the detection of variable weights processes, was employed for the suitability analysis of the artificial areas. MCE, which is widely used in the generation of suitability maps, requires the identification of different variables that may influence spatial changes in the study area (Baysal, 2013). The variables for the land-use suitability analysis were determined by examining previous studies and identifying the regional parameters that influence the region’s development (Berberoglu et al., 2016; Dadashpoor et al., 2019; Maithani, 2010; Ren et al., 2019; Shuaibu and Kara, 2019).
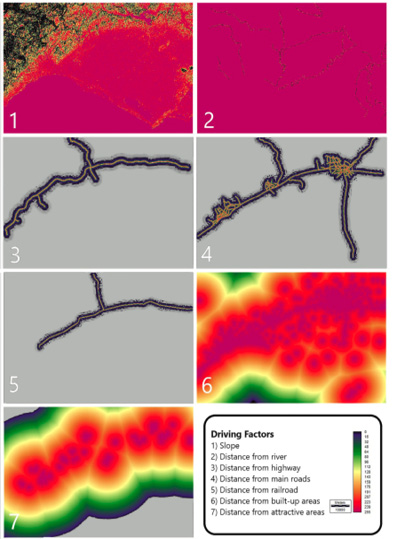
In this study, nine variables have been identified for the land-use suitability analysis. There are two constraints: land use and protected areas; and seven driving factors: slope, distance from rivers, distance from highways, distance from main roads, distance from railroad, distance from built-up areas, and distance from attractive areas. The variable of ‘distance from attractive areas’ is only used in the simulations of 2031 and 2049. It is because the impacts of the ongoing large-scale new regional projects will only occur in the future.
The factors determined for suitability maps of the artificial area class have different reference units (percentage, meter, etc.) and scales (different minimum and maximum value ranges). It is because the factors are not in an absolute value; and they need to be standardised on the same scale (Jiang and Eastman, 2000). By using the fuzzy logic method, each factor standardised is defined by the same scale between a minimum of 0 and a maximum of 255 values. The fuzzy logic method is developed based on the fuzzy set membership approach, represented by a degree of suitability ranging from 0 to 1.
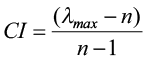
The weights of the variable in the MCE are determined by using the Analytical Hierarchy Process (AHP), which defines how much each factor variable will affect the suitability map. AHP refers to how important a factor variable is compared to another factor to produce a suitability map (Saaty, 2008). It is calculated in a pairwise comparison of the factor variables and consistency ratio. The coherence ratio (CR) is the division of the consistency index (CI) into a random index (RI) in Eq. 5. In the consistency index formula, λmax represents the highest self-value, and n is the number of factors in Eq. 6 (Saaty, 1987; Zabihi et al., 2019). A randomness index is a standard scale of consistency indicators with different values depending on the number of factors. The random index value is determined by the number of factors used in producing suitability maps (Table 4).

(5)
(6)
| n | 1 | 2 | 3 | 4 | 5 | 6 | 7 | 8 | 9 | 10 | 11 | 12 | 13 | 14 | 15 |
|---|---|---|---|---|---|---|---|---|---|---|---|---|---|---|---|
| RI | 0 | 0 | 0.58 | 0.90 | 1.12 | 1.24 | 1.32 | 1.41 | 1.45 | 1.49 | 1.51 | 1.48 | 1.56 | 1.57 | 1.59 |
Source: adapted from Saaty (1987).
The land cover/use constraint defines whether the urban area can expand on the fields beyond the water bodies and the artificial surfaces in the study area. The artifical areas are already occupied by existing artificial objects; and thus, the artificial area class has been defined as a constraint (Ahmed, 2011). The protected areas in this study consist of the areas with the nature conservation status that are protected by official institutions (Turkish Official Gazette, 1956, 1983). These areas include natural conservation sites, wildlife improvement areas, wetlands, sea turtle nesting areas, ancient cities, archaeological sites, and forest areas defined within the scope of the CORINE project.
For the slope factor, a percentage slope map has been generated using the 30-meter spatial resolution DEM data obtained from the SRTM satellite platform. The slope is one of the most significant factors determining the potential limits of spatial interventions. The possible urban expansion occurs in less inclined (flat) areas than in vertical areas (Chim et al., 2019; Moghadam and Helbich, 2013). We have also considered the Turkish Coastal Law No. 3621 for the control points of the river factor (Turkish Official Gazette, 1990). New urban structures and development areas often emerge near existing urban areas and along the transportation network (Araya and Cabral, 2010; Megahed et al., 2015; Mishra and Rai, 2016). The distance to transportation networks is thus considered as an important variable in this study. Attraction areas include the structures in the project phase, under construction or newly constructed, industrial, trading, and logistics centres. In this study, housing zones, terminals, hospitals, organised industrial areas, universities, ports, and commercial centres are some of the attractions that will affect urban expansion.
A membership function has been defined for each driving factor. A standardised scale, values from 0 to 255, was applied to each driving factor and their weights have been calculated by using the fuzzy logic (Fig. 4). The Consistency Ratio is obtained by calculating the weighting values of the factors through the analytical hierarchy process (Table 5). The consistency ratio of the pairwise comparison matrices used in suitability maps is calculated as 0.06. A consistency ratio of less than 0.10 indicates a high level of consistency (Eastman, 2009). The fact that the coherence ratio has a value of less than 0.10 (0.06 < 0.10) indicates that the comparisons are at a highly acceptable level.
Source: own work.
| Driving factors | Membership function | Control points | Weights | |
|---|---|---|---|---|
| 2019 | 2031–2049 | |||
| Slope | Sigmoidal monotonically decreasing | 0%–20% | 0.253 | 0.173 |
| Distance from river | Sigmoidal monotonically increasing | 30 m–50 m | 0.054 | 0.040 |
| Distance from highway | J-shaped monotonically decreasing | 0 m–30 km | 0.211 | 0.182 |
| Distance from main roads | J-shaped monotonically decreasing | 0 m–20 km | 0.124 | 0.089 |
| Distance from railroad | J-shaped monotonically decreasing | 0 m–15 km | 0.071 | 0.052 |
| Distance from built-up areas | Linear monotonically decreasing | 0 m–30 km | 0.287 | 0.153 |
| Distance from attractive areas | Linear monotonically decreasing | 0 m–30 km | – | 0.311 |
| Consistency ratio | 0.06 | 0.06 | ||
Source: own work.
2.7. CA_Markov
CA_Markov refers to the integration of Cellular Automation and Markov Chain. The simulation maps of 2019, 2031, and 2049 were created by defining the basis land cover/use image. As the basis land cover/use image, the land cover/use map of 2007 was used for the simulation of 2019, and the land cover/use map of 2019 was used for the 2031 and 2049 simulations.
2.8. Validation
Validation, which aims to test the reliability of the modelling, measures the level of conformity between the simulation and the actual result. The validation analysis of this study was conducted by comparing the simulation map of 2019 with the actual land cover/use map of 2019. Model validation contains agreement, disagreement, and Kappa variations defined by a number of mathematical formulas. The mathematical formulas in Table 6 show the two maps are similar in terms of location and quantity (Pontius Jr and Suedmeyer, 2004; Pontius, 2002). After the validation process in this study, we have reached 11 different variation results.
| Variations | Formula definition | Results (%) | |
|---|---|---|---|
| Components | Disagreement due to quantity | P(p)-P(m) | 0.0178 = 1% |
| Disagreement at stratum level | P(m)-K(m) | 0.0000 = 0% | |
| Disagreement at grid cell level | K(m)-M(m) | 0.1200 = 12% | |
| Agreement at grid cell level | MAX[M(m)-H(m),0] | 0.1667 = 16% | |
| Agreement at stratum level | If MIN[N(m),H(m),M(m)] = N(m), then MIN [H(m)-N(m),M(m)-N(m)], else 0 | 0.0000 = 0% | |
| Agreement due to quantity | If MIN[N(n),N(m),H(m),M(m)] = N(n), then MIN [N(m)-N(n),H(m)-N(n),M(m)-N(n)], else 0 | 0.1920 = 19% | |
| Agreement due to chance | MIN [N(n),N(m),H(m),M(m)] | 0.1667 = 16% | |
| Kappa | Standard Kappa (Kstandard) | ((M(m)-N(m)))/((P(p)-N(m))) | 0.7851 = 78% |
| Kappa for no information (Kno) | ((M(m)-N(n)))/((P(p)-N(n))) | 0.8346 = 83% | |
| Kappa for grid-cell level location (Klocation) | ((M(m)-N(m)))/((P(m)-N(m))) | 0.8075 = 80% | |
| Kappa for stratum-level location (KlocationStrata) | ((M(m)-H(m)))/((K(m)-H(m))) | 0.8075 = 80% |
Source: own work.
Pontius Jr and Millones (2011) have indicated that agreement or disagreement values provide much simpler and more useful information than the Kappa indicators. The components of quantity disagreement and allocation disagreement are the basic parameters indicating model validation. According to the validation results of the 2019 simulation, the overall accuracy value, which refers to the conformity rate between the simulation map and the actual land cover/use map, is 86%. The quantity disagreement is 1%, and the allocation disagreement is 12%. The number of cells in each class on the 2019 simulation map corresponds to 99% in quantity and 88% in allocation, compared to the actual map. All these validation values have proven that the model is valid and reliable. The fact that Kappa’s statistics also provide an average of 80% is a significant result of the validation process.
3. RESULTS AND DISCUSSION
3.1. Spatial development process
The study’s analysis of urban growth in the Mersin-Tarsus-Adana corridor from 1989 to 2019 reveals a clear pattern of linear expansion, primarily along major transportation routes. The data indicates that this linear growth pattern is closely tied to the region’s infrastructure, particularly highways and railways, which have acted as conduits for urban expansion. Over the 30-year period analysed, the urbanised areas expanded from 1.6% in 1989 to 3.8% in 2019, with simulations predicting further increases to 5.2% by 2031 and 7.4% by 2049. This expansion is predominantly at the expense of agricultural and semi-natural areas, with the latter showing a significant decline from 22.4% in 1989 to 7.9% in 2019. This shift represents a substantial transformation in land use, driven by both population growth and economic development pressures.
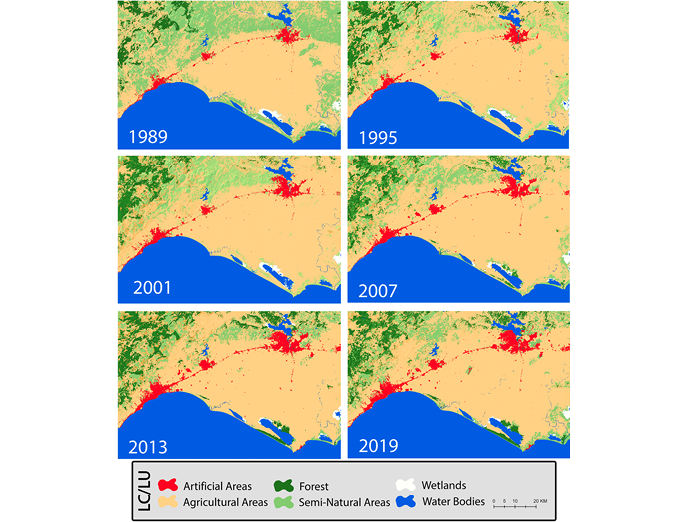
The urban growth during this period had some important spatial impacts which could be observed through the changes in the land cover/use classes (Yildiz Gorentas and Sargin, 2021). The agricultural areas consisted of the largest area in the region, with an area of 3,286 sq. km in 1989, and 3,898 sq. km in 2019. The main reason for this increase in agricultural areas was that three wetlands in the south part of the region were drained and converted into agricultural land during this period. The agricultural areas occupy more than half of the study area (52.3%), mainly due to the presence of the Cukurova plain in the region (Fig. 5). This is also related to the fact that most of the commercial and industrial activities in the region are related to agriculture, including the production, storage, transportation, and the processing of agricultural products.
Source: own work.
One of the most critical findings of this study is the extensive conversion of agricultural lands into urban areas. The region’s fertile agricultural lands, particularly in the Cukurova plain, historically were the backbone of local food production and agro-industrial activities. However, the results indicate that these lands are increasingly being encroached upon by urban development. The artificial areas, which represent the urban sprawl, increased from 1.6% in 1989 to 3.8% in 2019. Compared to the other land-use classes, the artificial area is the only land cover/use class that has shown a steady increase spatially in the region during this period. The cities of Mersin, Tarsus, and Adana extend from the southwest to the northeast. The results show that the urban growth took place on the line between these three cities from 1989 to 2019.
| LULC | 1989 | 1995 | 2001 | 2007 | 2013 | 2019 | ||||||
|---|---|---|---|---|---|---|---|---|---|---|---|---|
| sq. km | % | sq. km | % | sq. km | % | sq. km | % | sq. km | % | sq. km | % | |
| Artificial Surfaces | 116 | 1.6 | 127 | 1.7 | 182 | 2.4 | 203 | 2.7 | 272 | 3.7 | 284 | 3.8 |
| Agricultural Areas | 3,286 | 44.1 | 3,992 | 53.5 | 3,928 | 52.7 | 4,045 | 54.3 | 3,965 | 53.2 | 3,899 | 52.3 |
| Forest | 265 | 3.6 | 412 | 5.5 | 387 | 5.2 | 480 | 6.4 | 560 | 7.5 | 562 | 7.6 |
| Semi-Natural Areas | 1,670 | 22.4 | 819 | 11.0 | 849 | 11.4 | 631 | 8.5 | 552 | 7.4 | 590 | 7.9 |
| Wetlands | 63 | 0.8 | 42 | 0.6 | 51 | 0.7 | 33 | 0.4 | 31 | 0.4 | 28 | 0.4 |
| Water Bodies | 2,053 | 27.5 | 2,061 | 27.7 | 2,056 | 27.6 | 2,061 | 27.7 | 2,073 | 27.8 | 2,090 | 28.0 |
| Total | 7,453 | 100 | 7,453 | 100 | 7,453 | 100 | 7,453 | 100 | 7,453 | 100 | 7,453 | 100 |
Source: own work.
It is crucial to assess the urban growth and spatial changes that have occurred in the region within the context of planning decisions. The large-scale regional investments made in the region, particularly on agricultural areas, imply that planning measures may not impose strict constraints on urban expansion. According to Environmental Impact Assessment reports by the Ministry of Environment, Urbanization, and Climate Change, planning decisions have been modified, and the status of lands has been altered, citing the absence of alternative sites for investment and prioritising the public interest. Notable examples include the Çukurova International Airport, the Tarsus Food Specialization Organized Industrial Zone, and the Toros Tarim Special Industrial Zone (ÇED, 2009; ÇŞB, 2017, 2020). The development of these structures on fertile agricultural lands suggests that their operational areas may expand further in the future, potentially leading to industrial pollutants impacting the region ecologically.
3.2. Transition probabilities of land cover/use classes
The transition probability matrix provides a more granular view of the conversion processes. The probability matrix of the movement of each land cover/use class to itself and to the other land cover/use classes were produced for the periods 1995–2007, 2007–2019, and 1989–2019. The cross-product of the matrix in which each land cover/use class intersects in row and column gives the value of conversion of a land-use class into itself in the future (Table 8). The likelihood of the artificial surface conversion to itself is similar in each of the three periods (79%, 78%, 75%). The transition probability matrix shows that a proportion of the agricultural areas and semi-natural areas turned into artificial areas. For example, 2% of the agricultural areas and 4% of the semi-natural areas became artificial areas during the period between 1995 and 2007. The matrix also indicates that the probability of conversion from any other land-use class to the artificial land-use class is relatively low in rate. However, since agricultural and the semi-natural areas cover a large area in the region, even the slightest change in rate will correspond to large areas spatially. For instance, 5,000 ha of the agricultural areas and 3,300 ha of the semi-natural areas were converted into artificial areas during the period between 1995 and 2007. The conversion of the agricultural and the semi-natural areas into the artificial area in the study area in each of the three periods is an indication that the urban growth will continue to occur on these land-use classes in the future.
| LULC | Period | Artificial surfaces | Agricultural areas | Forest | Semi-natural areas | Wetlands | Water bodies |
|---|---|---|---|---|---|---|---|
| Artificial surfaces | 1995–2007 | 0.7954 | 0.1683 | 0.0005 | 0.0236 | 0.0000 | 0.0123 |
| 2007–2019 | 0.7821 | 0.1947 | 0.0040 | 0.0168 | 0.0000 | 0.0025 | |
| 1989–2019 | 0.7522 | 0.2124 | 0.0088 | 0.0134 | 0.0000 | 0.0133 | |
| Agricultural areas | 1995–2007 | 0.0291 | 0.7619 | 0.0691 | 0.1321 | 0.0009 | 0.0069 |
| 2007–2019 | 0.0425 | 0.7382 | 0.0713 | 0.1354 | 0.0017 | 0.0109 | |
| 1989–2019 | 0.0488 | 0.7185 | 0.1610 | 0.0633 | 0.0006 | 0.0078 | |
| Forest | 1995–2007 | 0.0006 | 0.2359 | 0.7192 | 0.0439 | 0.0000 | 0.0004 |
| 2007–2019 | 0.0003 | 0.2176 | 0.7170 | 0.0563 | 0.0023 | 0.0066 | |
| 1989–2019 | 0.0000 | 0.2330 | 0.6878 | 0.0756 | 0.0001 | 0.0035 | |
| Semi-natural areas | 1995–2007 | 0.0459 | 0.5359 | 0.0055 | 0.4000 | 0.0057 | 0.0069 |
| 2007–2019 | 0.0174 | 0.5582 | 0.0166 | 0.3957 | 0.0041 | 0.0079 | |
| 1989–2019 | 0.0584 | 0.6700 | 0.0289 | 0.2284 | 0.0026 | 0.0117 | |
| Wetlands | 1995–2007 | 0.0001 | 0.1972 | 0.2004 | 0.0880 | 0.4647 | 0.0497 |
| 2007–2019 | 0.0000 | 0.0472 | 0.0996 | 0.1519 | 0.5289 | 0.1724 | |
| 1989–2019 | 0.0000 | 0.0874 | 0.1803 | 0.2072 | 0.2957 | 0.2294 | |
| Water bodies | 1995–2007 | 0.0039 | 0.0976 | 0.0079 | 0.0168 | 0.0319 | 0.8419 |
| 2007–2019 | 0.0187 | 0.0283 | 0.0071 | 0.0396 | 0.0578 | 0.8485 | |
| 1989–2019 | 0.0082 | 0.0978 | 0.0032 | 0.0282 | 0.0168 | 0.8459 |
Source: own work.
3.3. Simulation
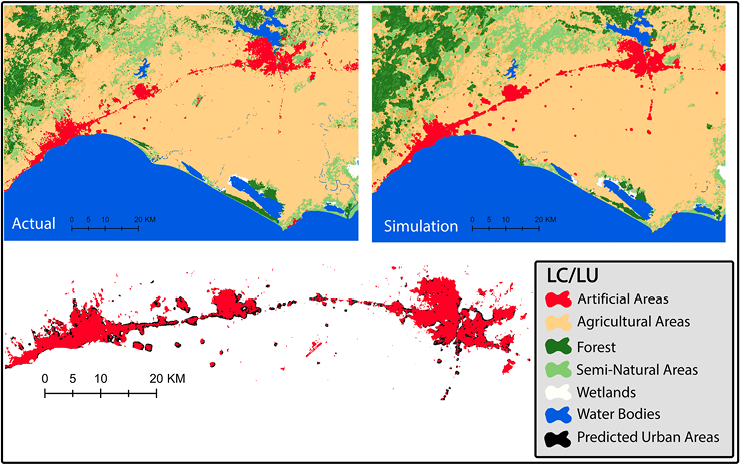
The first simulation map was created to predict the land cover/use classes in 2019. The simulation map was then compared with the actual one. The results show that the two maps overlap in terms of both the quantity and the allocation. The artificial area covers an area of 284 sq. km in the actual map of 2019, and 287 sq. km in the simulation map (Table 9). The spatial expansions of the artificial areas in both maps are the same; they constitute 3.8% of the total area in both maps (Fig. 6). The area ratios of the other land cover/use classes on the actual map and the simulation map were 52.3–50.9% agricultural areas, 7.6–8.7% forest, 7.9–8.5% semi-natural areas, 0.4–0.4% wetlands, and 28.7%–28.7% water bodies, respectively. The results show that there is a high degree of similarity between the two maps, both in quantity and allocation. All these results indicate that the modelling is accurate and reliable.
| LULC | Actual map (2019) | Simulated map (2019) | Simulated map (2031) | Simulated map (2049) | ||||
|---|---|---|---|---|---|---|---|---|
| sq. km | % | sq. km | % | sq. km | % | sq. km | % | |
| Artificial surfaces | 284 | 3.8 | 287 | 3.8 | 391 | 5.2 | 554 | 7.4 |
| Agricultural areas | 3,899 | 52.3 | 3,796 | 50.9 | 3,459 | 46.4 | 3,592 | 48.2 |
| Forest | 562 | 7.6 | 647 | 8.7 | 711 | 9.5 | 592 | 7.9 |
| Semi-natural areas | 590 | 7.9 | 630 | 8.5 | 774 | 10.4 | 598 | 8.0 |
| Wetlands | 28 | 0.4 | 33 | 0.4 | 28 | 0.4 | 28 | 0.4 |
| Water bodies | 2,090 | 28.1 | 2,060 | 27.7 | 2,090 | 29.1 | 2,089 | 28.1 |
| Total | 7,453 | 100 | 7,453 | 100 | 7,453 | 100 | 7,453 | 100 |
Source: own work.
Source: own work.
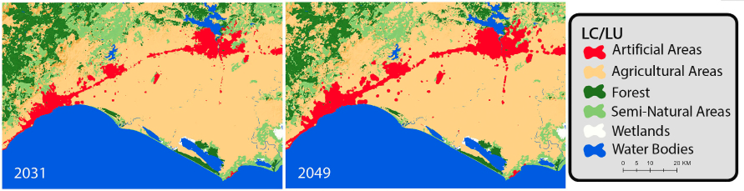
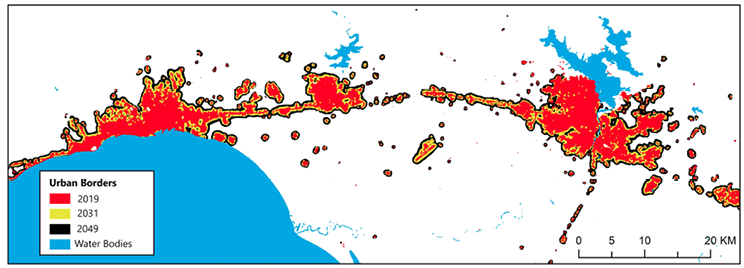
The simulations for 2031 and 2049 suggest that urban growth will continue to be driven by economic and infrastructural factors, with the most intense growth expected along the Mersin-Tarsus-Adana axis. This region, already characterised by high levels of industrial and commercial activity, is likely to see further densification, which will place additional strain on local resources and infrastructure. The results indicate that the artificial areas will increase to an area of 391 sq. km in 2031 and 554 sq. km in 2049. The urban sprawl is estimated to occur in the undeveloped lands and in the northern parts of the cities (Fig. 7). The urban expansion will occur more intensely around the attraction centres, due to economic, social, and cultural life exists in these areas. The main road between these three cities is one of the most important economic lines of the country and being intensely used for commercial and industrial purposes. This is the main reason why urban growth occurs horizontally along a linear line. The predicted northward expansion, facilitated by the Adana-Erdemli highway, underscores the role of transportation infrastructure in shaping urban growth patterns. The highway has a great impact on the direction of the urban expansion, due to its feature that allows relatively faster and easier interactions with other important economic and cultural centres outside of the region.
The simulation results have shown a significant change in land use occurred in the artificial areas class. The simulation maps of 2031 and 2049 predict a decrease in the agricultural areas, and an increase in the artificial areas. The simulations predict that the urbanised areas will further increase to 5.2% by 2031 and 7.4% by 2049. Since the modelling process is conducted by the experience of land cover/use changes in the past, such scenarios will inevitably occur in the future predictions. The current situation clearly confirms the degradation of the agricultural areas in the past, especially in the urban fringe. The simulations of 2031 and 2049 show that the three cities will grow towards their peripheries, and along a linear line towards each other (Fig. 8). The urban growth is predicted to encroach partly on the agricultural and semi-natural areas in the region. The artificial areas are estimated to expand on 8,772 ha of the agricultural areas and on 179 ha of the semi-natural areas in 2031; and the expansion will continue on 22,207 ha of the agricultural areas and on 4,888 ha of the semi-natural areas in 2049.
Source: own work.
Source: own work.
The study’s findings also highlight a critical sustainability challenge: the current trajectory of urban growth is significantly unsustainable. The expansion of urban areas into fertile agricultural land not only threatens food security but also undermines efforts to promote sustainable land use practices. The continued encroachment into agricultural areas is a clear indication that current land-use planning and governance frameworks are inadequate to manage the pressures of urbanisation. To mitigate these challenges, the study suggests that urban growth should be redirected towards less productive areas, such as semi-natural lands, which could serve as a buffer zone for urban expansion. The northward urban expansion will be more beneficial for environmental sustainability. However, this approach must be carefully managed to avoid the complete loss of these semi-natural areas, which also play a vital role in maintaining ecological balance.
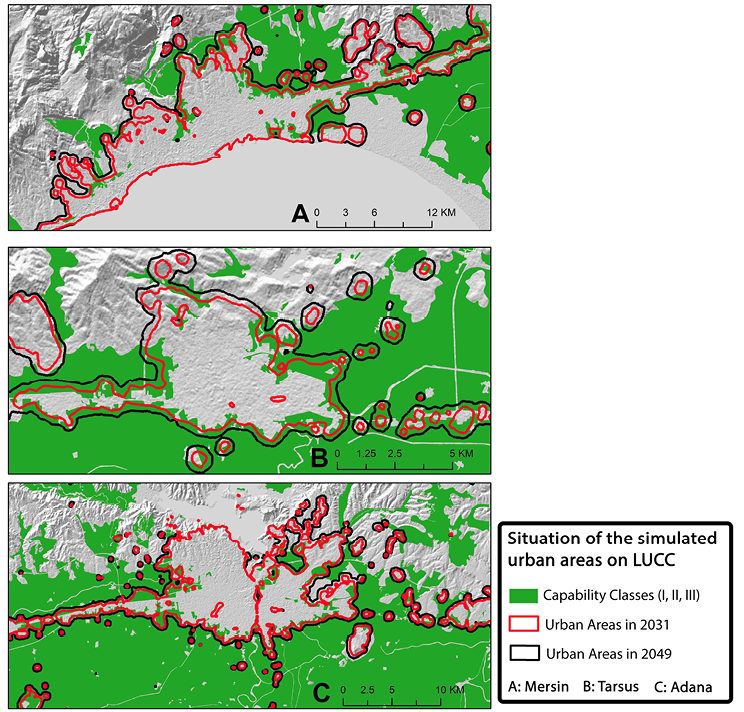
Everest et al. (2011) have argued that I., II., and III. classes of agricultural lands should not be used for non-agricultural purposes, even for the public interest. Yet, this study clearly showed that this advice has not been followed in this study area. The simulation maps of 2031 and 2049 predict that the artificial areas will expand on grade I, II, and III agricultural lands in the region. The simulation of 2031 estimates that the artificial areas will occur on the grade I agricultural areas of 44 sq. km, grade II of 9 sq. km, and grade III of 15 sq. km. The situation might be even worse in 2049, as the urban growth will continue the grade I agricultural areas of 94 sq. km, grade II of 24 sq. km, and grade III of 36 sq. km (Table 10). Thus, 17% of the artificial areas in 2031 and 28% of the artificial areas in 2049 will grow on arable agricultural areas.
| Land Use Capability Classes | Actual map (2019) | 2031 | 2049 |
|---|---|---|---|
| I | 16 | 44 | 94 |
| II | 4 | 9 | 24 |
| III | 5 | 15 | 36 |
| Total | 25 | 68 | 154 |
Source: own work.
According to the simulation maps, the northern part of Mersin, the western and eastern parts of Adana and the western and eastern parts Tarsus are the areas where the urban growth will occur on the agricultural areas, especially in 2049 (Fig. 9).
The broader implications of this study extend beyond the immediate region of Mersin, Tarsus and Adana. The findings provide valuable insights for other rapidly urbanising regions in developing countries facing similar challenges. The integration of CA and MC models offers a robust framework for predicting urban growth patterns and assessing the potential impacts on land use. Policymakers and urban planners can use these models to develop more effective land-use strategies that balance the needs of urban development with the imperative of environmental sustainability. The study also underscores the need for a more integrated approach to urban planning, one that considers the complex interactions between economic, social, and environmental factors. For instance, the ongoing investments in large-scale investment projects, such as the new airport and logistics centres, must be aligned with sustainable land-use practices. This requires not only stricter enforcement of existing regulations but also the development of new policies that promote vertical growth and the densification of urban areas, rather than unchecked horizontal sprawl.
Source: own work.
Finally, the study highlights the potential socio-economic impacts of urban growth on local communities. The conversion of agricultural land to urban areas can lead to the displacement of rural populations, changes in land ownership patterns, and increased socio-economic inequality. These issues are often overlooked in urban planning processes, but they are crucial for ensuring that urban growth benefits all segments of the population. Future research should focus on these socio-economic dimensions, exploring how urbanisation affects local communities and identifying strategies to mitigate negative impacts. Additionally, further studies could investigate the potential for alternative land-use scenarios that prioritise environmental sustainability and social equity. This could include exploring the role of green infrastructure, community-based land management practices, and innovative urban design approaches that promote sustainable development.
4. CONCLUSIONS
This study utilised Cellular Automata (CA) and Markov Chain (MC) modelling techniques to analyse urban growth in the Mersin, Tarsus and Adana corridor, revealing significant trends and future projections. Over the past three decades, the region has experienced substantial urban expansion, driven by infrastructural developments and economic activities. This growth, predominantly linear along major transportation routes, has resulted in the conversion of extensive areas of fertile agricultural land and semi-natural areas into urban spaces.
From 1989 to 2019, artificial areas in the region expanded from 1.6% to 3.8%, with the simulations predicting a further increase to 7.4% by 2049. This expansion is largely at the expense of agricultural and semi-natural areas, with agricultural areas being increasingly encroached upon. The Cukurova plain, one of Türkiye’s most productive agricultural zones, is under significant threat as urban sprawl continues. The study emphasises that this trajectory of urban growth is unsustainable, posing severe risks to the economic viability of agriculture and the environmental sustainability in the area.
The projected urban expansion for 2031 and 2049 indicates that the cities of Mersin, Tarsus, and Adana will continue to grow towards each other, leading to a densely populated corridor characterised by significant infrastructure development. The simulations suggest that the most intense urban growth will occur in the northern peripheries of these cities, with a notable trend of horizontal expansion along the linear axis connecting them. This pattern of growth is expected to further exacerbate the loss of agricultural and semi-natural areas, with the artificial areas predicted to occupy 68 sq. km of fertile agricultural land by 2031 and 154 sq. km by 2049.
These findings highlight the urgent need for integrated, sustainable urban planning. The study advocates for stricter development plans and land-use legislation to protect agricultural lands from further encroachment. Redirecting urban growth towards less productive areas, such as semi-natural areas, and promoting vertical development within existing urban centres are crucial strategies for mitigating the adverse effects of urbanisation. By focusing on densification rather than horizontal sprawl, policymakers can help to preserve fertile agricultural areas.
Furthermore, the study highlights the importance of carefully managing future investment projects to avoid further degradation of natural resources. The ongoing and planned projects, such as new industrial zones and transportation hubs, should be aligned with sustainable land-use practices to ensure that they do not contribute to the unsustainable expansion of urban areas into fertile agricultural land. A planned and controllable governance approach is essential, balancing economic development with environmental protection to achieve sustainable urban growth.
The implications of this study extend beyond the Mersin, Tarsus and Adana corridor, offering valuable insights into other rapidly urbanizing regions in developing countries. The integration of CA and MC models provides a robust framework for predicting urban growth patterns and assessing their potential impacts on land use. These models can serve as critical tools for policymakers and urban planners, helping to develop more effective land-use strategies that address the complex interactions between economic, social, and environmental factors.
In conclusion, the study of urban growth in the Mersin, Tarsus and Adana corridor provides a compelling case for the need to rethink current urban planning practices. The findings clearly demonstrate the risks associated with rapid urban expansion, particularly the loss of valuable agricultural land and the degradation of natural areas. As urbanisation continues to accelerate, it is imperative that policymakers, urban planners, and researchers work together to develop more sustainable and resilient approaches to urban growth. By integrating the lessons learned from this study into future urban planning initiatives, there is an opportunity to create more liveable and sustainable urban environments. Through such collaborative efforts, it is possible to achieve a balance between urban development and environmental protection.
Autorzy
Acknowledgements.
This study is based on Selin Yildiz Gorentas’, Ph.D., thesis and Sevil Sargin was supervisor. We thank Asst. Prof Bilal Gorentas for assistance for comments that greatly improved the manuscript.
REFERENCES
ABURAS, M. M., HO, Y. M., PRADHAN, B., SALLEH, A. H. and ALAZAIZA, M. Y. (2021), ‘Spatio-temporal simulation of future urban growth trends using an integrated CA-Markov model’, Arabian Journal of Geosciences, 14 (2), pp. 1–12. https://doi.org/10.1007/s12517-021-06487-8
ADIGUZEL, F., TOROGLU, E. and KAYA, O. (2015), ‘Kentsel gelişme ile ulaşım ilişkisi: Adana örneği’, Journal of Turkish Studies, 10 (6), pp. 27–46. https://doi.org/10.7827/TurkishStudies.8109
AHMAD, F., GOPARAJU, L. and QAYUM, A. (2017), ‘LULC analysis of urban spaces using Markov chain predictive model at Ranchi in India’, Spatial Information Research, 25 (3), pp. 351–359. https://doi.org/10.1007/s41324-017-0102-x
AHMED, B. (2011), Urban Land Cover Change Detection Analysis and Modeling Spatio-Temporal Growth Dynamics Using Remote Sensing and GIS Techniques: A Case Study of Dhaka, Bangladesh (Master’s thesis), Universidade Nova de Lisboa (UNL), Lisbon, Portugal.
AKIN TANRIOVER, A. (2011), Adana Kentsel Gelişiminin Uzaktan Algılama ve Coğrafi Bilgi Sistemleri Kullanılarak Modellenmesi (Doctoral Dissertation), University of Çukurova, Adana.
AL-SHARIF, A. A. and PRADHAN, B. (2014), ‘Monitoring and predicting land use change in Tripoli Metropolitan City using an integrated Markov chain and cellular automata models in GIS’, Arabian Journal of Geosciences, 7, pp. 4291–4301. https://doi.org/10.1007/s12517-013-1119-7
ARAYA, Y. H. and CABRAL, P. (2010), ‘Analysis and modeling of urban land cover change in Setúbal and Sesimbra, Portugal’, Remote Sensing, 2 (6), pp. 1549–1563. https://doi.org/10.3390/rs2061549
ARSANJANI, J. J., HELBICH, M., KAINZ, W. and BOLOORANI, A. D. (2013), ‘Integration of logistic regression, Markov chain and cellular automata models to simulate urban expansion’, International Journal of Applied Earth Observation and Geoinformation, 21, pp. 265–275. https://doi.org/10.1016/j.jag.2011.12.014
BASSE, R. M., OMRANI, H., CHARIF, O., GERBER, P. and BóDIS, K. (2014), ‘Land use changes modelling using advanced methods: Cellular automata and artificial neural networks. The spatial and explicit representation of land cover dynamics at the cross-border region scale’, Applied Geography, 53, pp. 160–171. https://doi.org/10.1016/j.apgeog.2014.06.016
BATMAN, S. (2014), Türkiyede Kent-Bölgeleşme Eğilimleri: Adana-Tarsus-Mersin Örneği (Master’s Thesis), University of Süleyman Demirel, Isparta.
BAYRAKDAR, C., DOKER, M. F. and KESERCI, F. (2020), ‘Polyelerde hatalı arazi kullanımların sebep olduğu afetlere bir örnek: 31 Ocak 2019 Kayaköy Polyesi taşkını’, Coğrafya Dergisi, 41, pp. 109–128. https://doi.org/10.26650/JGEOG2020-0046
BAYSAL, G. (2013), Urban Land Use and Land Cover Change Analysis and Modeling: A Case Study Area Malatya, Turkey (Master’s Thesis), Westfälische Wilhelms-Universität, Münster, Germany.
BELAL, A. and MOGHANM, F. S. (2011), ‘Detecting urban growth using remote sensing and GIS techniques in Al Gharbiya governorate, Egypt’, The Egyptian Journal of Remote Sensing and Space Science, 14 (2), pp. 73–79. https://doi.org/10.1016/j.ejrs.2011.09.001
BERBEROGLU, S., AKIN, A. and CLARKE, K. C. (2016), ‘Cellular automata modeling approaches to forecast urban growth for adana, Turkey: A comparative approach’, Landscape and Urban Planning, 153, pp. 11–27. https://doi.org/10.1016/j.landurbplan.2016.04.017
BHATTA, B. (2010), Analysis of urban growth and sprawl from Remote Sensing data. Springer Science & Business Media.
CAGLIYAN, A. and DAGLI, D. (2022), ‘Monitoring land use land cover changes and modelling of urban growth using a future land use simulation model (FLUS) in Diyarbakır, Turkey’, Sustainability, 14 (15), pp. 1–24. https://doi.org/10.3390/su14159180
CAI, Y., ZHANG, H. and PAN, W. (2015), ‘Detecting urban growth patterns and wetland conversion processes in a natural wetlands distribution area’, Polish Journal of Environmental Studies, 24 (5), pp. 1919–1929. https://doi.org/10.15244/pjoes/58593
CAMPBELL, J. B. and WYNNE, R. H. (2011), Introduction to Remote Sensing. Guilford Press.
CHIM, K., TUNNICLIFFE, J., SHAMSELDIN, A. and OTA, T. (2019), ‘Land use change detection and prediction in upper Siem Reap River, Cambodia’, Hydrology, 6 (3), pp. 64. https://doi.org/10.3390/hydrology6030064
COLLINS, L. (1975), An introduction to Markov Chain analysis, Geo Abstracts.
ÇED (2009), Çukurova Bölgesel Havaalanı Projesi, http://www.interport.com.tr/dokuman/cukurova_havaalani.pdf [accessed on: 21.04.2021].
ÇŞB (2017), Mersin-Adana Planlama Bölgesi 1/100.000 Ölçekli Revi- zyon Çevre Düzeni Planı Değişikliği (Mersin Tarsus Gıda İhtisas OSB) Plan Açıklama Raporu, https://webdosya.csb.gov.tr/db/mpgm/editordosya/file/CDP_100000/ma/PLANDEGISIKLIGIACIKLAMARAPORU_24112017.pdf [accessed on: 27.05.2021].
ÇŞB (2020), Mersin-Adana Planlama Bölgesi 1/100.000 Ölçekli Revi- zyon Çevre Düzeni Planı Değişikliği (Mersin İli, Akdeniz İlçesi, Karaduvar Mahallesi “Özel Endüstri Bölgesi”) Plan Açıklama Raporu, https://webdosya.csb.gov.tr/db/mpgm/icerikler/plan-aciklama-raporu-20200212153258.pdf [accessed on: 13.05.2021].
DADASHPOOR, H., AZIZI, P. and MOGHADASI, M. (2019), ‘Analyzing spatial patterns, driving forces and predicting future growth scenarios for supporting sustainable urban growth: Evidence from Tabriz metropolitan area, Iran’, Sustainable Cities and Society, 47, pp. 101502. https://doi.org/10.1016/j.scs.2019.101502
DAI, L., HAN, Q. and DE VRIES, B. (2024), ‘Simulating dynamical evolution of citizen participation leveraging agent-based modeling: Experiences from nature-based solutions in China’, Cities, 151, pp. 105–145. https://doi.org/10.1016/j.cities.2024.105145
DENIZ, M. and UMAR, N. (2023), ‘Kamusal alanların sürekliliğinin sağlanmasında kentsel belleğin rolü: Tarsus tarihi ticaret merkezi örneği’, TÜBA-KED Türkiye Bilimler Akademisi Kültür Envanteri Dergisi, 27, pp. 49–64. https://doi.org/10.22520/tubaked.1097787
DÖNMEZ, B. (2022), ‘Tamamlanmamış Bir Modernleşme Projesi Olarak Mersin’, Kent Akademisi, 15 (2), pp. 931–942. https://doi.org/10.35674/kent.1019828
EASTMAN, J. (2009), IDRISI Taiga, guide to GIS and remote processing, Worcester.
EASTMAN, J. R. (2016), TerrSet geospatial monitoring and modeling system, Worcester.
EUROPEAN ENVIRONMENT AGENCY (2020), CORINE Land Cover, http://www.eea.europa.eu/publications/COR0-landcover [accessed on: 12.05.2020].
EVEREST, T., AKBULAK, C. and OZCAN, H. (2011), ‘Examination of land equavalent ratio: the case of Havsa district of Edirne province’, Anadolu Tarım Bilimleri Dergisi, 26 (3), pp. 251–257.
FALAY, N. (2020), ‘Adana’nın 18. Yüzyıl ve sonrasında sosyoekonomik yapısı’, Journal of Applied and Theoretical Social Sciences, 2 (2), pp. 43–65. https://doi.org/10.37241/jatss.2020.10
GHOSH, P., MUKHOPADHYAY, A., CHANDA, A., MONDAL, P., AKHAND, A., MUKHERJEE, S., NAYAK, S., GHOSH, S., MITRA, D. and GHOSH, T. (2017), ‘Application of Cellular automata and Markov-chain model in geospatial environmental modeling – A review’, Remote Sensing Applications: Society and Environment, 5, pp. 64–77. https://doi.org/10.1016/j.rsase.2017.01.005
GUAN, D., LI, H., INOHAE, T., SU, W., NAGAIE, T. and HOKAO, K. (2011), ‘Modeling urban land use change by the integration of cellular automaton and Markov model’, Ecological Modelling, 222 (20–22), pp. 3761–3772. https://doi.org/10.1016/j.ecolmodel.2011.09.009
GULERSOY, A. E., CELIK, M. A. and SONMEZ, M. E. (2014), ‘Tarsus şehrinin alansal gelişimine (1985–2011) ekolojik bakış’, Electronic Turkish Studies, 9 (2), pp. 741–759.
HARVEY, D. (2013), ‘Models of the Evolution of Spatial Patterns in Human Geography’, [in:] CHORLEY, R. and HAGGETT, P. (eds), Integrated Models in Geography (Routledge Revivals), Routledge, pp. 549–608.
HU, Z. and LO, C. (2007), ‘Modeling urban growth in Atlanta using logistic regression’, Computers, Environment and Urban Systems, 31 (6), pp. 667–688. https://doi.org/10.1016/j.compenvurbsys.2006.11.001
IIZUKA, K., JOHNSON, B. A., ONISHI, A., MAGCALE-MACANDOG, D. B., ENDO, I. and BRAGAIS, M. (2017), ‘Modeling future urban sprawl and landscape change in the Laguna de Bay Area, Philippines’, Land, 6 (2), p. 26. https://doi.org/10.3390/land6020026
ISHTIAQUE, A., SHRESTHA, M. and CHHETRI, N. (2017), ‘Rapid urban growth in the Kathmandu Valley, Nepal: Monitoring land use land cover dynamics of a himalayan city with landsat imageries’, Environments, 4 (4), p. 72. https://doi.org/10.3390/environments4040072
JIANG, H. and EASTMAN, J. R. (2000), ‘Application of fuzzy measures in multi-criteria evaluation in GIS’, International Journal of Geographical Information Science, 14 (2), pp. 173–184. https://doi.org/10.1080/136588100240903
KARA, H. (1988), ‘Çukurova’da kentleşme ve sanayileşmenin tarım topraklarına etkisi’, Ankara Üniversitesi Dil ve Tarih-Coğrafya Fakültesi Dergisi, 32 (1–2), pp. 267–280.
KAYA, S. and CURRAN, P. (2006), ‘Monitoring urban growth on the European side of the Istanbul metropolitan area: A case study’, International Journal of Applied Earth Observation and Geoinformation, 8 (1), pp. 18–25. https://doi.org/10.1016/j.jag.2005.05.002
KE, X., QI, L. and ZENG, C. (2016), ‘A partitioned and asynchronous cellular automata model for urban growth simulation’, International Journal of Geographical Information Science, 30 (4), pp. 637–659. https://doi.org/10.1080/13658816.2015.1084510
KONG, F., YIN, H., NAKAGOSHI, N. and JAMES, P. (2012), ‘Simulating urban growth processes incorporating a potential model with spatial metrics’, Ecological Indicators, 20, pp. 82–91. https://doi.org/10.1016/j.ecolind.2012.02.003
LIU, Y. (2008), Modelling urban development with Geographical Information Systems and Cellular Automata. Crc Press.
LIU, Y. and FENG, Y. (2011), ‘A Logistic Based Cellular Automata Model for Continuous Urban Growth Simulation: A Case Study of the Gold Coast City, Australia’, [in:] HEPPENSTALL, A. J., CROOKS, A. T., SEE, L. M. and BATTY, M. (eds), Agent-Based Models of Geographical Systems, Springer, pp. 643–662.
LIU, Y., DAI, L. and XIONG, H. (2015), ‘Simulation of urban expansion patterns by integrating auto-logistic regression, Markov chain and cellular automata models’, Journal of Environmental Planning and Management, 58 (6), pp. 1113–1136. https://doi.org/10.1080/09640568.2014.916612
LOSIRI, C., NAGAI, M., NINSAWAT, S. and SHRESTHA, R. P. (2016), ‘Modeling urban expansion in Bangkok metropolitan region using demographic–economic data through cellular automata-Markov chain and multi-layer perceptron-Markov chain models’, Sustainability, 8 (7), p. 686. https://doi.org/10.3390/su8070686
MAITHANI, S. (2010), ‘Cellular automata based model of urban spatial growth’, Journal of the Indian Society of Remote Sensing, 38, pp. 604–610. https://doi.org/10.1007/s12524-010-0053-3
MALCZEWSKI, J. (2004), ‘GIS-based land-use suitability analysis: a critical overview’, Progress in Planning, 62 (1), pp. 3–65. https://doi.org/10.1016/j.progress.2003.09.002
MARTELLOZZO, F., AMATO, F., MURGANTE, B. and CLARKE, K. (2018), ‘Modelling the impact of urban growth on agriculture and natural land in Italy to 2030’, Applied Geography, 91, pp. 156–167. https://doi.org/10.1016/j.apgeog.2017.12.004
MEGAHED, Y., CABRAL, P., SILVA, J. and CAETANO, M. (2015), ‘Land cover mapping analysis and urban growth modelling using remote sensing techniques in Greater Cairo Region – Egypt’, ISPRS International Journal of Geo-Information, 4 (3), pp. 1750–1769. https://doi.org/10.3390/ijgi4031750
MISHRA, V. N. and RAI, P. K. (2016), ‘A remote sensing aided multi-layer perceptron-Markov chain analysis for land use and land cover change prediction in Patna district (Bihar), India’, Arabian Journal of Geosciences, 9, pp. 1–18. https://doi.org/10.1007/s12517-015-2138-3
MOGHADAM, H. S. and HELBICH, M. (2013), ‘Spatiotemporal urbanization processes in the megacity of Mumbai, India: A Markov chains-cellular automata urban growth model’, Applied Geography, 40, pp. 140–149. https://doi.org/10.1016/j.apgeog.2013.01.009
MOHAMED, A. and WORKU, H. (2020), ‘Simulating urban land use and cover dynamics using cellular automata and Markov chain approach in Addis Ababa and the surrounding’, Urban Climate, 31, p. 100545. https://doi.org/10.1016/j.uclim.2019.100545
MOHAN, M., PATHAN, S. K., NARENDRAREDDY, K., KANDYA, A. and PANDEY, S. (2011), ‘Dynamics of urbanization and its impact on land-use/land-cover: a case study of megacity Delhi’, Journal of Environmental Protection, 2 (09), p. 1274. https://doi.org/10.4236/jep.2011.29147
MONDAL, B., DAS, D. N. and BHATTA, B. (2017), ‘Integrating cellular automata and Markov techniques to generate urban development potential surface: a study on Kolkata agglomeration’, Geocarto International, 32 (4), pp. 401–419. https://doi.org/10.1080/10106049.2016.1155656
MUNDIA, C. N. and ANIYA, M. (2005), ‘Analysis of land use/cover changes and urban expansion of Nairobi city using remote sensing and GIS’, International Journal of Remote Sensing, 26 (13), pp. 2831–2849. https://doi.org/10.1080/01431160500117865
MYINT, S. W. and WANG, L. (2006), ‘Multicriteria decision approach for land use land cover change using Markov chain analysis and a cellular automata approach’, Canadian Journal of Remote Sensing, 32 (6), pp. 390–404. https://doi.org/10.5589/m06-032
OZTURK, D. (2015), ‘Urban growth simulation of Atakum (Samsun, Turkey) using cellular automata-Markov chain and multi-layer perceptron-Markov chain models’, Remote Sensing, 7 (5), pp. 5918–5950. https://doi.org/10.3390/rs70505918
PARKER, D. C., MANSON, S. M., JANSSEN, M. A., HOFFMANN, M. J. and DEADMAN, P. (2003), ‘Multi-agent systems for the simulation of land-use and land-cover change: a review’, Annals of the association of American Geographers, 93 (2), pp. 314–337. https://doi.org/10.1111/1467-8306.9302004
PIJANOWSKI, B. C., BROWN, D. G., SHELLITO, B. A. and MANIK, G. A. (2002), ‘Using neural networks and GIS to forecast land use changes: a land transformation model’, Computers, environment and urban systems, 26 (6), pp. 553–575. https://doi.org/10.1016/S0198-9715(01)00015-1
PONTIUS JR, R. G. and MILLONES, M. (2011), ‘Death to Kappa: birth of quantity disagreement and allocation disagreement for accuracy assessment’, International Journal of Remote Sensing, 32 (15), pp. 4407–4429. https://doi.org/10.1080/01431161.2011.552923
PONTIUS JR, R. G. and SUEDMEYER, B. (2004), ‘Components of agreement between categorical maps at multiple resolutions’, Remote Sensing and GIS Accuracy Assessment, pp. 233–251.
PONTIUS, R. G. (2002), ‘Statistical methods to partition effects of quantity and location during comparison of categorical maps at multiple resolutions’, Photogrammetric Engineering and Remote Sensing, 68 (10), p. 1041.
POOYANDEH, M., MESGARI, S., ALIMOHAMMADI, A. and SHAD, R. (2007), ‘A comparison between complexity and temporal GIS models for spatio-temporal urban applications’, Computational Science and Its Applications–ICCSA 2007: International Conference, Kuala Lumpur, Malaysia, 26–29 August.
REN, J., ZHOU, W., LIU, X., ZHOU, L., GUO, J., WANG, Y., GUAN, Y., MAO, J., HUANG, Y. and MA, R. (2019), ‘Urban Expansion and growth boundaries in an Oasis City in an arid region: A case study of Jiayuguan City, China’, Sustainability, 12 (1), p. 210. https://doi.org/10.3390/su12010210
RIMAL, B., ZHANG, L., KESHTKAR, H., WANG, N. and LIN, Y. (2017), ‘Monitoring and modeling of spatiotemporal urban expansion and land-use/land-cover change using integrated Markov chain cellular automata model’, ISPRS International Journal of Geo-Information, 6 (9), p. 288. https://doi.org/10.3390/ijgi6090288
SAATY, R. W. (1987), ‘The analytic hierarchy process – what it is and how it is used’, Mathematical Modelling, 9 (3–5), pp. 161–176.
SAATY, T. L. (2008), ‘Decision making with the analytic hierarchy process’, International Journal of Services Sciences, 1 (1), pp. 83–98.
SANG, L., ZHANG, C., YANG, J., ZHU, D. and YUN, W. (2011), ‘Simulation of land use spatial pattern of towns and villages based on CA–Markov model’, Mathematical and Computer Modelling, 54 (3–4), pp. 938–943. https://doi.org/10.1016/j.mcm.2010.11.019
SARGIN, S. (1998), Şehirlerin Mekansal Gelişiminin Tarım Alanları Üzerindeki Etkilerinin Örnek Şehirlerde İncelenmesi (Doctoral Dissertation), University of İstanbul, İstanbul.
SHUAIBU, J. A. and KARA, C. (2019), ‘Evaluating suitability for sustainable urban growth of Abuja by using MCE and GIS’, International Journal of Advanced and Applied Sciences, 6 (7), pp. 68–76. https://doi.org/10.21833/ijaas.2019.07.009
SUN, J., WANG, J., WANG, T. and ZHANG, T. (2019), ‘Urbanization, economic growth, and environmental pollution: Partial differential analysis based on the spatial Durbin model’, Management of Environmental Quality: An International Journal, 30 (2), pp. 483–494. https://doi.org/10.1108/MEQ-05-2018-0101
TARIQ, A., MUMTAZ, F., MAJEED, M. and ZENG, X. (2023), ‘Spatio-temporal assessment of land use land cover based on trajectories and cellular automata Markov modelling and its impact on land surface temperature of Lahore district Pakistan’, Environmental Monitoring and Assessment, 195 (1), p. 114. https://doi.org/10.1007/s10661-022-10738-w
THERES, L., RADHAKRISHNAN, S. and RAHMAN, A. (2023), ‘Simulating Urban Growth Using the Cellular Automata Markov Chain Model in the Context of Spatiotemporal Influences for Salem and Its Peripherals, India’, Earth, 4 (2), pp. 296–314. https://doi.org/10.3390/earth4020016
TURKISH OFFICIAL GAZETTE (1956), Forest Law, https://www.mevzuat.gov.tr/MevzuatMetin/1.3.6831.pdf [accessed on: 17.09.2020].
TURKISH OFFICIAL GAZETTE (1983), Code of Protection of Cultural and Natural Properties, https://www.mevzuat.gov.tr/MevzuatMetin/1.5.2863.pdf [accessed on: 21.09.2020].
TURKISH OFFICIAL GAZETTE (1990), Coastal Law, https://www.mevzuat.gov.tr/MevzuatMetin/1.5.3621.pdf [accessed on: 22.10.2020].
USGS (2020), Earth Explorer, https://earthexplorer.usgs.gov [accessed on: 10.06.2020].
WANG, F. (2012), A Cellular Automata Model to Simulate Land-Use Changes at Fine Spatial Resolution (Doctoral Dissertation), University of Calgary, Canada.
YILDIZ GORENTAS, S. and SARGIN, S. (2021), ‘Mersin, Tarsus ve Adana hattındaki şehirsel büyümenin mekânsal etkileri’, Coğrafya Dergisi, 43, pp. 127–142. https://doi.org/10.26650/JGEOG2021-936379
ZABIHI, H., ALIZADEH, M., KIBET LANGAT, P., KARAMI, M., SHAHABI, H., AHMAD, A., NOR SAID, M. and LEE, S. (2019), ‘GIS Multi-Criteria Analysis by Ordered Weighted Averaging (OWA): toward an integrated citrus management strategy’, Sustainability, 11 (4), p. 1009. https://doi.org/10.3390/su11041009