Volume 30, 2023, Number 2
https://doi.org/10.18778/1231-1952.30.2.12


Abstract. Slovakia is a suitable object for the study of income inequalities. The dynamic development of the country in recent years has significantly changed the social situation of its inhabitants. This development made visible the already considerable inequalities of income and wealth at the regional level (rich West and poor East), between the city and the countryside (richer cities and poorer lagging countryside), but also among the considerably wealthy elite and marginalised populations. This contribution has three objectives. The first is to capture the development of income inequality and poverty in Slovakia, the second is to capture the distribution of income at different geographic scales, and the third is to identify low-income regions.
Key words: income inequalities, at risk of poverty, income profile of regional societies.
Income is an important phenomenon that is currently significantly affecting several spheres of the life of the individual and society, particularly the level of income inequality. Motivation through income is the driving force of social development or decline. Income inequality should not be too high, because extreme and unfair income inequality causes dissatisfaction, frustrations, and various forms of deprivation among the population. However, it should not be very low either, because an “egalitarian” reward system (income egalitarianism) is demotivating. The combination of these two measures (level and inequality of income) differs between countries; in any case, a very low level of income and its high inequality are pessimistic, undesirable, and socially unacceptable in the long term. In the historical context, a prime example of this state was the situation in the socialist countries of the former Eastern bloc (Central and Eastern European countries) before 1989. Very low income together with a very low level of income inequality was typical for the majority of their populations (Michálek and Výbošťok, 2019). The situation was different in countries with a social model in which income egalitarianism at a higher level of income, together with the benefits of full social security, created motivational assumptions and pointed to the efficiency of, for example, the Scandinavian model of the social state. While little income inequality sometimes produces “the poverty of society,” very high levels of income inequality tend to produce poverty “in” society.
This contribution pursues several objectives: it captures in detail the level and development of income and income inequality in Slovakia over the past 17 years (2004–2020), because relevant longitudinal data exists. It tracks the differentiation of income inequalities with the help of the three relevant and most used measures of income inequality. Significant attention is devoted to the development, level, and depth of poverty to determine the degree of the risk of poverty or social exclusion, the degree of the risk of income poverty, and its differences from the aspect of selected population structures, households, and degree of urbanisation. The differentiation of poverty is monitored using the eight most significant and widely used measures of poverty. A very important part of the contribution is the monitoring of income, income inequality, and poverty at all spatial levels, from regional to local. This study monitors income inequality and poverty at the level of eight regions of Slovakia. Income profiles of regional societies were created at the spatial level of 49 functional urban regions (FUR). These represent a rigorously defined reference framework for the spatial organisation of the country. Significantly differentiated income levels were monitored at the local level in 2,927 municipalities in Slovakia. All analyses and results led to a relatively detailed picture of income distribution, quantification of income inequality, and poverty in Slovakia.
In the former socialist states of Central and Eastern Europe, the topics of income inequality and poverty were taboo until 1990. Since significant income inequalities and poverty “did not officially exist” in most of these countries, there were no data based on which the phenomena could be investigated. The situation changed only in 2004, after the admission of eight post-socialist countries to the EU. Newly acceded countries adopted common statistics for various social and economic development areas. The primary source for the income and poverty analyses was the EU SILC sample survey (EU Statistics on Income and Living Conditions). Moreover, the EU SILC database has become the main source for income and poverty analyses in this paper. With the help of longitudinal income data, it is possible to identify changes, dynamics, and trends in the development of incomes and income inequalities, as well as movements in the structure of incomes, income, and social groups. Longitudinal poverty data can be used to identify cycles of poverty, time profiles of poverty, risk groups, vulnerable populations, quantify changes in stratification, depth and severity of poverty, as well as other significant temporal aspects of poverty.
The advantage of older EU member countries is that they have longer EU SILC time series and other data sources with which they can analyse and investigate various aspects and connections of income and poverty in their countries and regions. Based on the level and development of income inequalities in Denmark (1980−1995), Pedersen and Smith (1998) reported that income was very evenly distributed throughout the period. They used the time series of data to examine whether low income was mainly a short-term or long-term problem of the identified vulnerable population groups. Muffels et al. (2000) analysed and compared the situation in Germany, the Netherlands and the United Kingdom based on longitudinal data on income and poverty. Using the Gini coefficient and the inequality of income distribution S80/S20 and S90/S10, they examined the differences between countries in income inequality before and after social transfers. Based on the analysis of the duration of poverty, they identified four “temporal” poverty profiles and estimated the probability of belonging to each of the poverty profiles using multinominal regression models. Piketty and Saez (2003) focused their attention on the top earners, examining their development and changes in the USA over the long period of 1913−1998. They found that the top earners changed significantly over almost a century and that crises, recessions, wars, and other turning events significantly impacted the highest incomes or their distribution in society. Gray et al. (2004), examining household incomes in Canada from 1991 to 1997 found that while household income inequalities between provinces were insignificant, within-province household income inequalities were significant. Förster et al. (2005) reported that although national-level surveys contributed significantly to understanding the dynamics of the income distribution, they simultaneously masked differences in the level of income inequality within a country. Ezcurra et al. (2007), who focused on the distribution of income inequality between EU regions (in the years 1993−2000), found that despite significant differences in the level of inequality between regions, the process of regional income convergence prevailed during the observed period. Using time-based data, Dorling and Pritchard (2010) found that the poverty level in Britain changed much less than they expected. Changes in the development of poverty of selected demographic groups in the period after the financial crisis are pointed out by the ASPE report (2013), which states that poverty increased in most demographic groups after the crisis (2008). Duiella and Turrini (2014) noted post-crisis increases in poverty mainly in connection with severe material deprivation and a low level of work intensity, especially in the countries most affected by the crisis (Greece, Spain, Ireland and Italy). Based on spatial decomposition, Paredes et al. (2014) reported that high and persistent income inequality in Chile (for 1992 and 2009) was largely the result of geographic heterogeneity of inequality. An interesting use of longitudinal data on poverty can also be found in the work of Chaudry et al. (2016), who examined the impact of social networks on the development of poverty rates in at-risk populations in the USA. They found that government programmes’ impact on reducing the poverty rate was particularly significant between 1967 and 2012. Interesting results were found in the work of the Joseph Rowntree Foundation (JRF, 2017), which reported that changes in benefits and tax credits for working-age families reduced household incomes with low incomes, high housing costs have significantly reduced the incomes of the poor, and rising inflation has been higher for people with lower incomes than for higher earners. The report also found that most low-income people had no savings, were not building up enough retirement income, and that the proportion of working-age residents buying their own homes was falling. The contribution of Francis-Devine et al. (2019) provides information on long-term trends in income levels and poverty rates in the UK. The data structure allowed them to track overall trends for the entire population and by age, economic activity, and region. Turečková (2015) investigated income inequality in 11 countries of Central and Eastern Europe. Based on the determination of income inequality, she performed an analysis of the development of income inequality, including a subsequent interregional comparison. She was able to map changes in income inequality using the alternative method of non-weighted average absolute deviation.
Income inequality refers to the unequal distribution of household or individual incomes within the entire society. It is often expressed as a percentage of income in proportion to a percentage of the population. The number of methods for measuring income inequality and poverty is ever-expanding. Analyses have focused on standard indicators and measures of income inequality and poverty research (e.g., Gini coefficient, the inequality of income distribution S80/S20, the rate of risk of poverty or social exclusion, the rate of severe material deprivation), but also on less frequent (specific) indicators of their measurements (e.g., the Palma ratio, the rate of poverty risk anchored in time, the rate of poverty risk according to the degree of urbanization, the relative decline of the median income in the risk of poverty, and dispersion around the poverty risk line).
Among the most frequently used and most telling indicators of income inequality are the Gini coefficient, the inequality of income distribution S80/S20, and the Palma index. The Gini coefficient (Gk) is one of the most well-known indicators of income inequality, which considers the income of the entire society. Gk expresses the relationship of the cumulative shares of the population divided by the amount of equivalent disposable income to the cumulative shares of their total equivalent disposable income. Theoretically, it can take on values from 0 to 1, or from 0% to 100% in percentage terms. If there was absolute income equality in society, the coefficient would take on the value of 0%. Conversely, if all income in a company belonged to only one person, the coefficient would have the value of 100%. A higher coefficient indicates greater income inequality. Income quintile share ratio S80/S20 (ISR-80) expresses the ratio/share of the amount of equivalent disposable income of 20% of the population with the highest incomes (upper quintile) and the amount of equivalent disposable income of 20% of the population with the lowest incomes (lower quintile). It can theoretically take on values from 1 to infinity, and the higher its value, the higher the total income of the richest 20% of people in society relative to the total income of the poorest 20%. Income share ratio S10/S40 (Palma ratio), or the inequality of income distribution S10/S40 (hereinafter referred to as ISR-10), is defined as the ratio of the share of the richest 10% of the population in the gross national income divided by the share of the poorest 40% (Cobham and Sumner, 2013). It builds on the work of a Chilean economist Gabriel Palma, who found that middle-class incomes almost always represent roughly half of the gross national income, while the other half is shared between the richest 10% and the poorest 40%. The ratio/share of these two income groups is what differs significantly in individual countries (Palma, 2011). The Palma ratio solves the excessive sensitivity of Gk to changes in the middle of the distribution and insensitivity to changes in the upper and lower parts. More precisely, it reflects the economic impact of income inequality on society as a whole. Palma has suggested that distributional politics is mainly about the struggle between the rich and the poor and on whose side the middle class is.
The contribution is based on the definition of poverty for developed countries, where the population whose disposable income is below the poverty risk threshold (less than 60 percent of the median disposable income of the country) is considered poor. In the article, social exclusion is understood as social disadvantage and relegation to the margins of society. Social exclusion is the process in which individuals are blocked from various rights, opportunities, and resources that are normally available to members of a different group, and which are fundamental to social integration and observance of human rights within that particular group.
People at risk of poverty or social exclusion. The indicator of the rate of risk of poverty or social exclusion (AROPE) is the main indicator for monitoring the EU 2030 goal in the area of poverty and social exclusion. In addition to the concept of income poverty, the indicator considers two other dimensions: material and social deprivation and exclusion from the labour market. This aggregate poverty indicator is based on a combination of three sub-indicators: the rate of risk of income poverty (RIP), the rate of severe material and social deprivation, and the rate of very low work intensity. The RIP rate represents the share of persons (in percentages) in the total population whose equivalent disposable income is below the poverty risk threshold. The poverty risk threshold is set as 60% of the median national equivalent disposable income. The rate of severe material and social deprivation expresses the share of the population (in percentages) that faces a forced shortage in at least four items of the list of nine items of material and social need (Statistical Office of the Slovak Republic, 2022a). The rate of very low work intensity expresses the share of all persons aged 0–64 living in households in which members of working age worked less than 20% of their annual work potential during the previous year. The AROPE indicator is defined as the number of people who are at risk of income poverty and/or are severely materially and socially depressed and/or live in a household with very low work intensity. The AROPE rate is expressed as the proportion of people at risk of poverty or social exclusion.
At-risk-of-poverty rate by poverty threshold. Of the three dimensions of AROPE, the most people in Slovakia are at risk of the so-called income poverty (RIP). This type of poverty mainly concerns unemployed, multiple or incomplete households, and people with a risky socio-demographic profile. These are residents in households with incomes below the national poverty line. Severe material deprivation rate. The rate of severe material deprivation (SMD) expresses the share of the population (in percentage) that faces a forced shortage in at least four of the nine deprivation items belonging to the dimension of financial burden and ownership of durable goods. Very low work intensity rate. The rate of low work intensity (LWI) expresses the share of persons who live in households with very low work intensity (less than 20%) among the population aged 0–59. The work intensity of the household represents the ratio between the number of months that all household members of working age worked during the income reference period and the total number of months that could theoretically be worked by these household members. The definition of working age refers to persons aged 18–59, excluding persons who are students aged 18–24.
At-risk-of-poverty rate anchored at a fixed moment in time (2008). The rate of poverty risk anchored in time (RPT) for the given year t-2008 is the share of persons whose equivalent disposable income that year was below the poverty risk threshold, calculated in the standard way for the earlier year t−3 and then overestimated by inflation. At-risk-of-poverty rate by degree of urbanization. The rate of risk of poverty according to the degree of urbanisation (RPdU) expresses the share of persons at risk of poverty who live in households in the environment of cities, suburbs, and rural areas. Relative median at-risk-of-poverty gap. The relative drop in median income at risk of poverty (MRPG) expresses the degree of severity/depth of poverty, which means the extent to which people below the poverty line are poor. It represents the difference between the median equivalent disposable income of persons below the poverty risk threshold and the poverty threshold itself, expressed as a percentage. This indicator can be considered a direct indicator of the severity of poverty—that is, the fall of the population’s income below the poverty line. It compares the median income of people below the poverty line with the at-risk-of-poverty line. The further below the poverty line this value is, the greater the depth of poverty and the more difficult it is for people to get out of the risk of poverty. The MRPG determines how poor the people below the poverty line really are. Thus, the MRPG determines the intensity of poverty. Dispersion around the at-risk-of-poverty threshold. The dispersion around the risk of poverty line (DRP) is another very important direct indicator of the severity of poverty. It expresses the share of persons (in percentage) in the total population whose equivalent disposable income is below the line of risk of poverty, which is set as 40%, 50%, and 70% of the national median equivalent disposable income (ŠÚ SR, 2022a).
In addition to the mentioned standard and specific indicators, selected methods (decomposition, stratification, spatial analysis) are also used to monitor structural characteristics and the horizontal (spatial) and vertical (hierarchical) stratification of income and poverty in Slovakia. Decomposition represents an important partial method for investigating the differentiated level of income and poverty. Its main contribution lies in the fact that it can penetrate into their structural characteristics—that is, quantify their level according to various signs. With its help, it is possible to identify at-risk and vulnerable population groups. In this sense, decomposition represents a suitable and desirable complement to the traditional analyses of income inequality and poverty research. Another important method and specific type of measurement for defining income inequalities and poverty is income stratification. Conceptually and technically, it is a relatively more complex measurement of the stratification of the population according to income. There are several ways to define income stratification that include criteria of a socio-economic nature (e.g., ownership, property, income, standard of living, and housing) to reveal inequalities and stratification of incomes, what main income groups (layers) the population consists of and their ratio. The basis for the creation of a system of income stratification of the population is the determination of the criteria/parameters of wealth (e.g., property, salary, and income) and indicators (averages, ratios, and indices) with the help of which individual layers will be defined. The fundamental question on the basis of which we can stratify regional societies is the choice of criteria, or the determination of parameters and their measurement. The third important partial method for researching the level of income and poverty are spatial analyses, which provide significant information about the differentiated level of income, their inequalities, and poverty at different geographical scales. They can determine where, in which territories, regions, or localities the mentioned phenomena are concentrated, as well as which groups are most threatened by them. Using the standard and specific measures and the selected methods (decomposition, stratification, spatial analysis) has made it possible to monitor all significant aspects of income inequality and poverty in Slovakia.
In Slovakia, the Gk value was only 21.8% in 2020, up to 8.3 p.p. lower than the EU value. The highest Gk value in Slovakia was reached in 2005: 28.1%. The average value of Gk for the entire monitored period (2004–2020) was 24.2%. Figure 1 shows that the Gk curve fluctuated considerably, which was a consequence of several dynamic changes in the economy, but also in the area of social policy. While before the financial crisis (except for 2005) Gk values fell to a value of 23.7%, in the years after the financial crisis up to 2013 they rose to 26.1%. From 2015, the values started to fall again, while in 2017 and 2019, the lowest values appeared, exactly 20.9%.
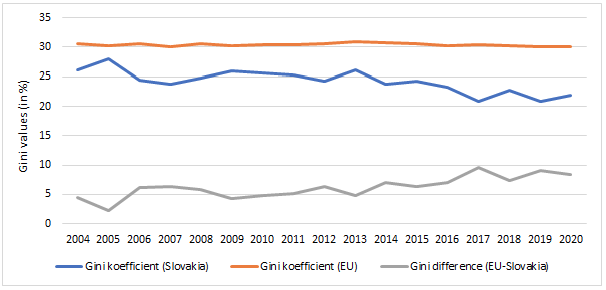
Fig. 1. Development of the Gini coefficient in the EU and Slovakia in the years 2004–2020
Source: own work based on Statistical Office of the Slovak Republic (2022b), Eurostat (2022).
ISR-80 in Slovakia in the monitored period showed a fairly even development, with a decrease since 2013. The variance of the achieved values between the year with the highest value of 4.1 (2005) and the lowest value of 3.0 (2017) was relatively small: only 1.1. Only in one year (2005) did ISR-80 exceed the value of 4.0 (Fig. 2).
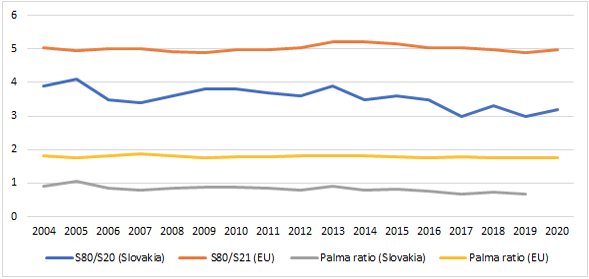
Fig. 2. Development of the rate of income inequality (S80/S20 and Palma ratio)
Source: own work based on Statistical Office of the Slovak Republic (2022a), Eurostat (2022).
During the entire period (except for 2005, when the ISR-10 barely exceeded the value of one), the Palma ratio values in Slovakia were below 1 (Fig. 2). This means that the income of the poorest 40% of the population was higher than the income of the top 10%. The average ISR-10 value in Slovakia (0.82) was much lower than the EU average value (1.12), which indicates a more favourable development for the lower income groups of the population.
Based on the EU SILC 2021 survey, more than 800,000 people in Slovakia were in AROPE in 2020, which represented 15.6% of the total population of the Slovak Republic. As shown in the graphic representation (Fig. 3), this is the sum of all the mutual penetration of the four above-mentioned sub-indicators, which means that some households and individuals were at risk of income poverty (12.3%), severe material and social deprivation (5.7%), or very low work intensity (3.9%). Among the three dimensions of poverty and social exclusion, people in Slovakia were most at risk of the so-called income poverty. Income poverty primarily concerns persons with a vulnerable position on the labour market and especially persons outside the labour market, as well as persons with a specific household composition and a risky socio-demographic profile. These are residents who live in households with lower incomes than the national poverty line. Social exclusion means having unequal access to the basic resources of society (e.g., employment, education, housing, health care, and social protection), and the impossibility of engaging in normal relationships and activities in which the majority of people in society engage (e.g., economic, social, cultural or political relations) that ensure integration in society. To an individual who does not have access to normal goods and services, this means that even his or her basic life needs are not covered. At the same time, he or she is excluded from the events and a relationships in which most of the society in which he or she lives is involved.
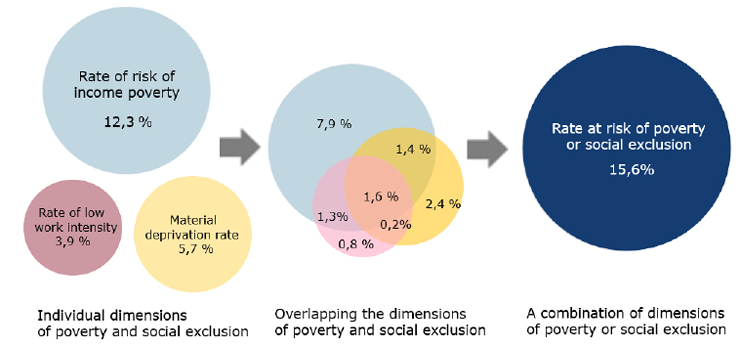
Fig. 3. Share of persons at risk of poverty and social exclusion (AROPE) in 2020
Source: own work based on Statistical Office of the Slovak Republic 2022a (EU SILC, 2021).
In 2020, 12.3% of people lived below the income poverty line, which was approximately 660,000 inhabitants (45,000 more than in the previous year, 2019). The rate of severe material and social deprivation in Slovakia was rather lower and followed a downward trend in the long term. In 2020, 5.7% of the population was depressed (306,000 inhabitants). The rate of very low work intensity was 3.9%. This is the share of people living in households who worked less than a fifth of the annual working potential of its members. For this group, the risk of poverty increased over time, and there was a risk that they would become dependent on various forms of social assistance.
From the percentage representation of persons in AROPE, according to the penetration of individual sub-indicators, it is clear that the largest share was made up of persons who were only at risk of income poverty (7.9%). Through the mutual penetration of all three sub-indicators, we extracted the most endangered group of people, where all risks were cumulative. In 2020, they made up 1.6% of Slovakia’s population and represented the most vulnerable group in terms of poverty.
Looking at changes over time, the share of residents in AROPE in Slovakia decreased since 2004 from 32.0% to 15.6% in 2020. Thus, in the monitored period, the number of residents in AROPE decreased by more than half (Fig. 4). For the years 2004–2020, the average value for AROPE was 19.4%. The values for the monitored years ranged from 32.0% to 13.8% and decreased throughout the study period.
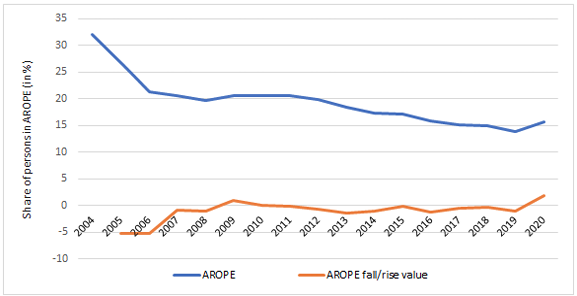
Fig. 4. Development of the share of persons at risk of poverty or social exclusion (AROPE) in the Slovak Republic
Source: own work based on Statistical Office of the Slovak Republic (2022a) and EU SILC (2021).
Of the three dimensions of AROPE, the most people in Slovakia were at risk of the so-called income poverty (RIP). This type of poverty mainly concerns unemployed, multiple or incomplete households, and people with a risky socio-demographic profile. These were residents in households with incomes below the national poverty line. Figure 5 illustrates the development of RIP in the monitored years. After the initial decline even before the crisis (2006), the curve began to rise and rose until 2011, when it reached 13.2%. With the improvement of the economic situation, income poverty began to gradually decrease until 2019, when it reached 11.4%. The relatively significant increase in the RIP value in 2020 to 13.2% was related to the pandemic crisis, especially to the situation on the labour market (reduced income in some sectors of the economy most affected by the crisis).
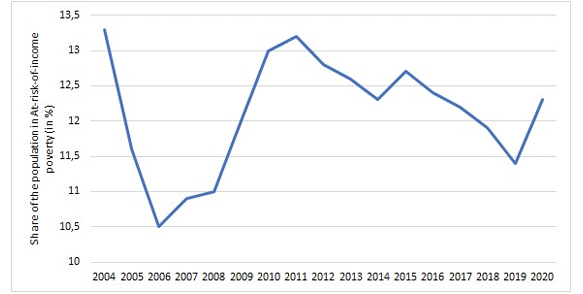
Fig. 5. Development of the rate of risk of income poverty (RIP) in the years 2004–2020
Source: own work based on Statistical Office of the Slovak Republic (2022a) and EU SILC (2021).
The rate of RIP shows significantly different values for selected population structures. In terms of age, children in Slovakia were exposed to higher RIP than adults or older residents. The RIP reached an annual value of 17.6% in the 0–17 age group in 2020, which was 1.43 times more than that for the total population. With increasing age, the share of persons in RIP decreased. While the population aged 65 and older (7.7%) was least at risk of RIP during the entire observed period, in 2020 it was the population of productive age (50–64). RIP was only 9.7% in 2020, while it was 10.3% for residents aged 65 and older. Figure 6 illustrates the development of RIP by age. It is obvious that, even in the long term, children (age group 0–17) are most at risk and older residents (50–64 and 65+) are least at risk. While the average value of RIP for children was 19.0%, it reached 7.7% in the senior population (over 65 years). This difference of 11.3 p.p. is significant, although it was significantly decreasing since 2017 (in 2020, this difference was 7.3 p.p.)
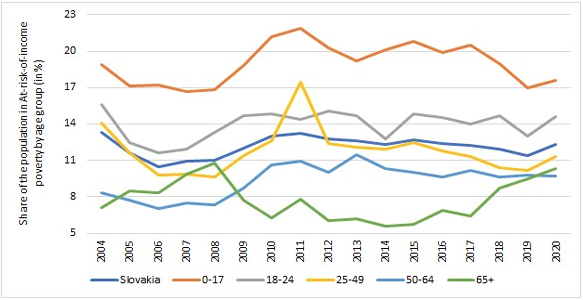
Fig. 6. Development of the rate of risk of income poverty (RIP) by age, 2004–2020
Source: own work based on Statistical Office of the Slovak Republic (2022a) and EU SILC (2021).
Another important factor affecting RIP is household type and size. In 2020, households with dependent children were 1.2 times more at risk than households without children. While the RIP was 9.2% for households without dependent children, it was 14.6% for households with children. This means that households that take care of dependent children were significantly more at risk of poverty than households without children. Among households with dependent children, households with a higher number of children were most at risk, that is, two adults with three or more dependent children (36.3%): this was almost three times greater than the rate for the total population. A higher risk also appeared in single-parent households (one parent with one dependent child), where the RIP was 33.6%. Among households without dependent children, single-member households consisting of a person aged 65 and over (28.5%) were most at risk of RIP. Higher vulnerability was related to a poorer ability of households to mobilise resources (especially its workforce, which is the most important source of income), but also to the number of children in the household.
Figure 7 illustrates the development of the RIP rate by household type. It is obvious that, even in the long term, households with three or more dependent children and single-parent families were most at risk, and households without children were least at risk. The average RIP value of households with three or more dependent children reached 31.9%, while for single-parent families it was 29.9%. In a household without dependent children, the RIP value was only 7.9%. The average RIP value for all households was 18.6%. In a household with three or more dependent children, the RIP was 13.3 p.p. than average; for single-parent families, it was 11.3 p.p. higher. These differences were so marked that households with three or more dependent children and single-parent households can be referred to as households with a high RIP. A common feature of both types of households was an increase in their share in RIP, as well as an increase in values in the last monitored year (2020) compared to the starting year 2004. While the increase in RIP for single-parent households was relatively low (only 1.8 p.p.), in large households (three or more children) it was very high–up to 12.1 p.p.
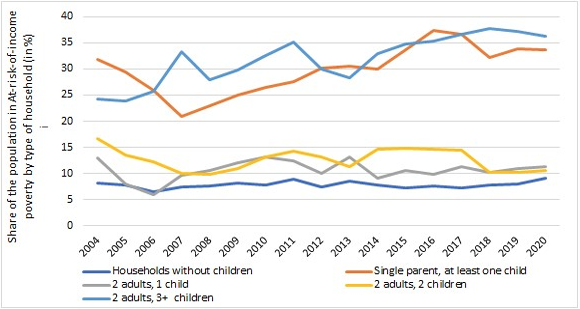
Fig. 7. Development of the rate of risk of income poverty (RIP) by household type in 2004–2020
Source: own work based on Statistical Office of the Slovak Republic (2022a) and EU SILC (2021).
In terms of economic activity, the unemployed were exposed to the highest RIP in Slovakia. In 2020, the RIP value reached 52.6% among the unemployed–that is, more than half of the unemployed suffered from RIP. Conversely, the lowest RIP appeared among the economically active, where only 6.7% of the population suffered from RIP; this was primarily the group that is often referred to as the working poor. This group recorded RIP value up to 45.9 p.p. lower than those among the unemployed. Figure 8 illustrates the development of the unemployed according to economic activity. It is obvious that, even in the long term, RIP appears in the most threatened group of the unemployed and the least employed. While the average RIP value of the unemployed was 46.8%, it was only 6.0% for the employed. The difference in RIP between the mentioned groups has been increasing in recent years, mainly due to the rapidly growing share of RIP among the unemployed.
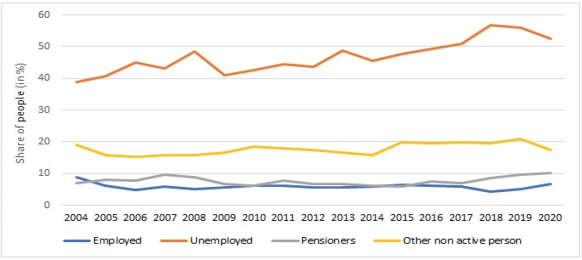
Fig. 8. Development of the rate of risk of income poverty (RIP) according to economic activity in 2004–2020
Source: own work based on Statistical Office of the Slovak Republic (2022a) and EU SILC (2021).
If we look at the development of severe material deprivation rate (SMD) in Slovakia, it appears to have shown the greatest progress of all poverty indicators. In the observed period, the share of people who felt deprivation/lack in the financial burden dimensions decreased significantly. While in the first year of monitoring (2004) around a fifth of people (21.7%) showed serious material deprivation, in the last monitored year (2020) it was only 5.9% (Fig. 9). In 2020, the most people, 35%, said they could not afford to pay for a week’s holiday away from home once a year. The second most common problem was the inability to face unexpected expenses (27%). Almost 23% of people in Slovakia stated they could not afford to replace worn-out furniture with new items.

Fig. 9. Development of the rate of severe material deprivation in Slovakia in the years 2004–2020
Source: own work based on Statistical Office of the Slovak Republic (2022a) and EU SILC (2021).
A total of 4.3% of the population aged 18–59 lived in households with LWI in Slovakia in 2020. Compared to the previous year, 2019, the rate of LWI decreased significantly by 1.9 p.p. In Fig. 10, we can see the development of LWI over the monitored period. The decrease in values indicates an improvement in the situation on the labour market and more opportunities for full-fledged economic activity. For the years 2005–2020, the average LWI rate was 6.4%, which gradually decreased. In 2010, the indicator reached a value of 7.9%, while in 2020 it reached a value of only 4.3% (a decrease of 3.6 p.p.).

Fig. 10. Development of the share of persons in households with very low work intensity (LWI)
Source: own work based on Statistical Office of the Slovak Republic (2022a) and EU SILC (2021).
Figure 11 captures the development of RPT for all persons. Until 2011, RPT decreased to 6.0%; it then grew for two years (after the financial crisis) and in 2013 reached 8.1%. It then decreased rather steeply until 2020 to 4.3%, and as a result of the health crisis (the COVID-19 pandemic), it rose again to 5.0%.
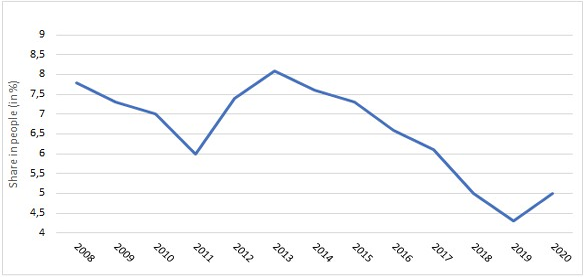
Fig. 11. Development of the rate of poverty anchored in time (RPT; as of 2008)
Source: own work based on Statistical Office of the Slovak Republic (2022a) and EU SILC (2021).
The rate of risk of poverty according to the degree of urbanisation (RPdU) expresses the share of persons at risk of poverty who live in households in the environment of cities, suburbs, and rural areas. As is clear from Figure 12, persons in rural areas showed a higher share in the risk of poverty throughout the monitored period, ranging from 14.6% to 17.9%. This growth was influenced by the financial crisis, which caused their share to increase relatively significantly until 2012. It then decreased and showed an alternation of growth and decrease in values, while the highest value was recorded in 2018 (17.9%). The share in the risk of poverty in cities and suburbs showed lower values in the interval from 10.6% to 15.1% throughout the monitored period. The curve of the development of the share of persons in RPdU in cities recorded a significant decrease, almost halving, from 14.0% to 7.5% in the years 2015–2020. This decrease of 6.5 p.p. indicates a significant improvement in the situation in cities, but at the same time a significant deterioration in the suburbs (increase in the share of persons in RPdU by 3.8 p.p.).
In 2020, the total value of the relative difference between the median income of persons at risk of poverty and the threshold of the risk of poverty was 27.7% and increased by 4.0 p.p. compared to the year prior. The most vulnerable age group consisted of persons aged 0–17 years, where the relative drop in the median income at risk of poverty was the highest (28.7%), or 1.0 p.p. higher than the share of persons in the entire population. In Fig. 13 we can see the development of MRPG over the observed period. The share of residents in MRPG showed values ranging from 18.1% to 29.0% throughout the monitored period.

Fig. 12. Persons at risk of poverty or social exclusion according to the degree of urbanization (RPdU)
Source: own work based on Statistical Office of the Slovak Republic (2022a) and EU SILC (2021).
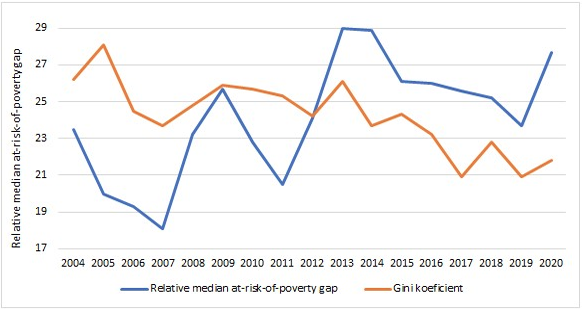
Fig. 13. Development of the relative drop in the median income (poverty depth) of persons at risk of poverty
Source: own work based on Statistical Office of the Slovak Republic (2022a) and EU SILC (2021).
The MRPG development curve was characterised by three significant decreases and increases (peaks) in values. Its decreased in the first three years indicates a favourable development–a decrease in the severity of poverty. The declines represented isolated years 2007, 2011, and 2019. The value peaks are also interesting. The peak in 2009 could be considered a consequence of the financial crisis, while the causes of the peaks in 2013 and 2014 are still unexplored and deserve deeper analysis. The MRPG peak in 2020 could be considered a consequence of the COVID-19 pandemic. MRPG appears to be largely related to the development of the asperities captured by Gk, with the similar course of the curves showing that the higher level MRPG reflects the growth of these asperities. In other words, the growth of inequalities significantly conditions the decline/fall in the median income of the poor. It can thus be concluded that this indicator is very sensitive to the development of income inequalities, so it is necessary to approach changes (growth of inequalities) with regards to the poorest sections of the population.
In connection with capturing the dispersion of poverty around the poverty line, in 2020 in Slovakia, 3.4% of persons had an income below 40% of the median equivalent disposable income, 9.7% of persons below 50% of the median, and up to 19.9% below 70% of the median persons. In Fig. 14, we can see the development of DRP for the monitored period. There are four curves with almost identical development, although at different value levels, with the DRP of 40% and 50% showing different development. While the 40% curve in the monitored period had a positive trend and the values in the monitored period fell from 4.8% to 3.4% − that is, by 1.4 p.p. − the 50% curve, conversely, increased by almost the same value (1.5 p.p.). This can be considered a slightly positive shift among the poor (the situation of poorest has thus slightly improved). As for the DRP of 70%, it underwent a fluctuating development, while the starting year values (20.0%) at the end of the period were almost identical (19.9%).
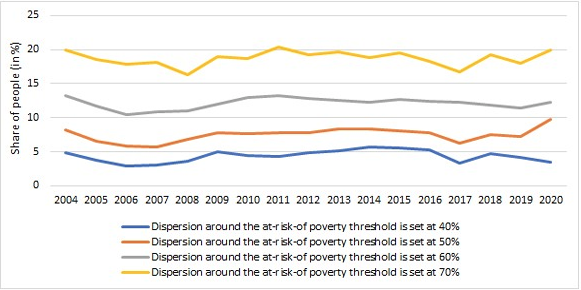
Fig. 14. Development of dispersion around the poverty risk line (DRP)
Source: own work based on Statistical Office of the Slovak Republic (2022a) and EU SILC (2021).
One of the most striking and observable signs of income inequality in poverty is space, which is the bearer of these inequalities through the population. Geographical analyses of these horizontal income inequalities and poverty provide much information not only about the income and poverty of the population in the regions, but also about the regions (or examined spatial units) themselves. At the same time, the growth and widening of income inequalities between regions further increases poverty in some regions. In many, the increase in income inequality and simultaneous very low income from employment leads to the refusal to work by employees and the non-utilisation of the economically active population by the state or employers. The interregional increase, as well as the increase in income inequalities and the concentration of poverty, is a consequence of differentiated economic conditions, social inequalities, and the opportunities for the regions and their ability to restructure. Low monetary income and poverty, whether of individuals or households, conditions the dissatisfaction of residents, especially in the area of income and material security.
The level of (low) income and poverty in regions is influenced by various external and internal factors. External factors mainly include a lack of financial and development resources, low (state or foreign) investments, various risks for the business, and weak and underdeveloped economic ties, relations, and connections with other regions. Internal factors include, among others, economic lagging, the region’s development potential and possibilities, the low level of human resources, and weak management. Individual factors are also important, such as people’s position on the labour market, education, age, and social or health handicaps. These factors, as well as others that have not been mentioned, multiply regional problems and have a very unfavourable effect, especially in economically weaker regions, which also show a higher degree of vulnerability. They intensify regions’ unfavourable position and negatively affect multiple aspects of residents’ quality of life. In these regions, low income and poverty are accompanied by many undesirable negative phenomena, such as low purchasing power, social dependence, poverty, social exclusion, and the emergence of subcultures. Low income and poverty are particularly characteristic features of the inhabitants of the lagging and marginal territories, regions, and localities of Slovakia. Relatively significant spatial income disparities and the related concentration of poverty in certain areas, regions, or settlements increases the marginalisation of these territories and causes financial problems for their populations.
The wide-ranging problems associated with the spatial dimension of income and poverty include the differentiation and concentration monitoring of income, identification of regions with low population income, regional income disparities, income stratification of the population, creation of income profiles of regional societies, identification of poor regions, and typification of poverty regions and poverty parameters (character, depth, duration, transmission, type). This points to the relevance of examining the issue of geographical income inequalities and poverty. Empirical findings can help positively shape social policy and improve the distribution of the effects of economic growth in regions.
Like other socio-economic phenomena, income and poverty in Slovakia are significantly spatially differentiated. Income inequality and poverty are mostly influenced by the significantly different demographic and socioeconomic levels (Gajdoš and Pašiak, 2006; Matlovič et al., 2008; Matlovič and Matlovičová, 2011; Madajová et al., 2014; Korec et al., 2016; Pauhofová et al., 2016; Michálek et al., 2020) of individual regions and are most often observed at the regional level in the spatial units of the territorial administrative organisation (i.e., at the NUTS 3 level). In Slovakia, NUTS 3 represents eight regions for which data on the income and poverty of the population are available. Figure 15 captures the values of the available indicators for both phenomena in the mentioned spatial units (regions) of Slovakia.
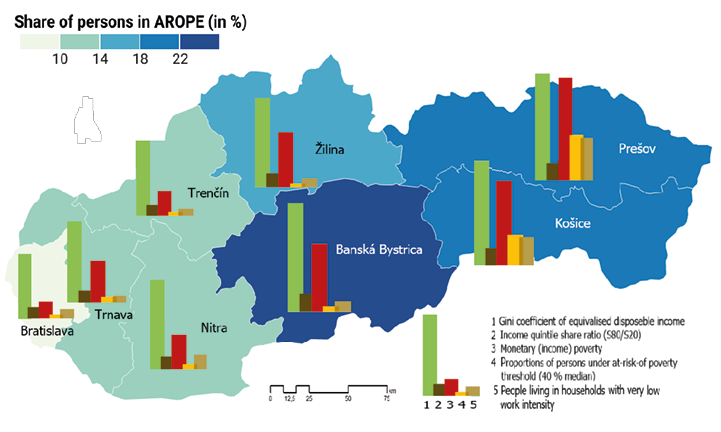
Fig. 15. Income inequality and poverty in eight regions of Slovakia in 2020
Source: own work based on Statistical Office of the Slovak Republic (2022b) and EU SILC (2021).
FURs were the most suitable regional level for monitoring the spatial stratification of incomes and their inequalities, as well as for creating a regional profile of residents’ incomes (regional income societies). The analysis of residents’ incomes by FUR eliminates not only the incorrect comparison of urban districts with other districts, but also excludes districts that do not belong to the set of evaluated units due to their size and internal structure from the comparison. In total, 49 FURs were thus used as the basic territorial units of income stratification in Slovakia; stratification was based on the representation (number) of the population in individual income categories.
A simple graphical model was used to capture the income distribution of regional societies. The income profile of a company was expressed by the number of inhabitants in 10 income intervals of the same range. The visual construction of regional societies profiles based on differentiated income can be seen in Figure 16. The map provides a detailed picture of income stratification and its differentiation at the FUR level. According to the representation of the individual income groups, five types of regional communities were classified. The two extreme types were the groups of the population with the highest (rich) and the lowest (poor) income. Due to the predominance of the poor over the rich, most of the studied regions had a pyramidal or pseudo-pyramidal arrangement of income. Pyramidal distribution is characterised when the share of income of the region’s inhabitants in the first three (lowest) income categories constitutes more than half of the income. A pseudo-pyramidal arrangement/income distribution is also pyramid-shaped, but the income distribution is shifted slightly upwards, meaning incomes are slightly higher; in Slovakia, 20 regional populations with such stratification were identified.
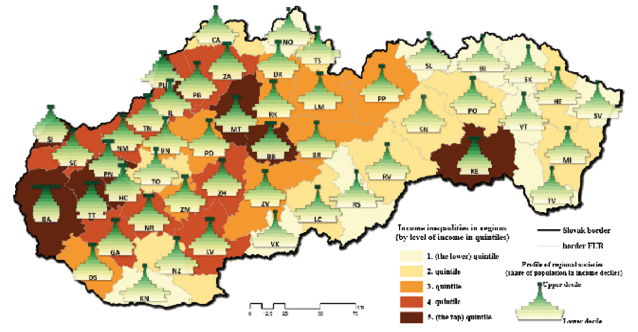
Fig. 16. Income inequality and stratification (profile) of the population in the regions of Slovakia in 2012–2016
Source: own work based on Social Insurance Agency of the Slovak Republic (2021).
The remaining three types of regional income communities had a pear-shaped profile, with each of the stratification types based on the predominance of middle-income groups. The first stratification type, a wide pear (with a wider lower part), was characteristic of a group of 15 regions with a majority of the population in the third to fifth income interval. The second and third pear-shaped types were represented by a group of 14 regions. Their common feature was a relatively higher representation of residents in the three highest income bands (they constituted more than 7%). We can talk about an extremely rich stratification type in connection with only one FUR–the metropolitan Bratislava region. The profile of this region has a significantly different shape (an inverted pear) from the other regions. This specific profile indicates that, in this region (the only one in Slovakia), the population with income from the highest income interval is most represented (up to 13.2% of the population). At the same time, the region is characterised by the most even income distribution due to the greater/more significant representation of residents with higher incomes. The used characteristic of income stratification of regional societies thus provides relatively detailed and quick information about incomes and income inequalities in the studied spatial units.
In Slovakia, incomes and their inequality are most differentiated at the municipal level. Figure 17, as in the previous figures shows significant income disparities, this time at the local level. It can be seen that most municipalities in north-western Slovakia are characterised by above-average incomes, while these are the highest in municipalities located in the western part of Slovakia and in larger cities.
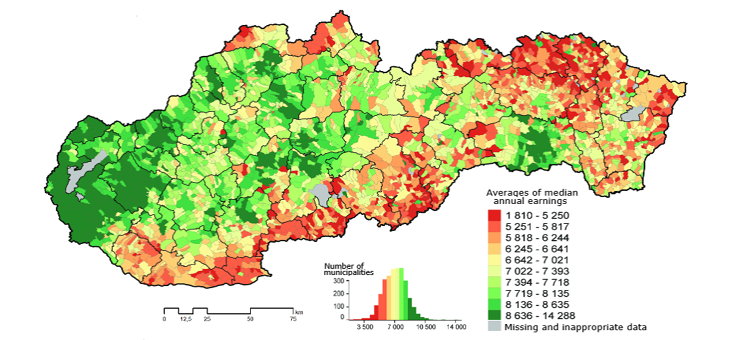
Fig. 17. Municipal income levels in Slovakia in 2014–2017
Source: Výbošťok (2020).
Conversely, municipalities in the south and northeast of Slovakia are characterised by below-average incomes (orange-red shades). While low-income municipalities occur only sporadically in the northwest, one atypical region can be seen in the territory of low-income municipalities (south and northeast). It is a region with different, significantly higher incomes among its inhabitants; the centre of this island is Košice, which is the second largest city in Slovakia and the metropolis of eastern Slovakia. It is this city, especially its industrial sector and services, that creates opportunities for higher earnings for its inhabitants, as well as its infrastructure.
The contribution using (so far the only) longitudinal data on income and poverty in Slovakia provided important insights into their development, changes, and differentiated spatial level. It proved that from the aspect of income distribution in the monitored years, income development in Slovakia was similar (albeit at a different level) to that in Denmark (Pedersen and Smith 1998). The paper also confirmed the findings of Förster et al. (2005) that national-level results significantly obscure/mask differences in income inequality across regions. The knowledge obtained is also in agreement with the findings of Piketty and Saez (2003) that the distribution and changes of incomes are significantly influenced by extraordinary events (crises, recessions, wars), which dynamise them and mostly negatively affect them (they reduce the incomes of the majority of the population, lead to concentrations/ accumulation of incomes for a narrow group, increase income inequalities, etc.). The results of the study of income inequality at the regional and local level showed that while household income inequality at the local level of municipalities was insignificant in Slovakia, household income inequality between districts, FUR and regions was significant. These are completely opposite results to those achieved by Gray et al. (2004) when examining household income in Canada.
Most of the findings and knowledge about the development and changes in poverty in Slovakia were more or less aligned with the results and conclusions of research from other EU countries. For example, the development of overall poverty, or changes in its level, were relatively slow, inconspicuous and similar to those in Great Britain (Dorling and Pritchard 2010). In agreement with ASPE (2013), post-crisis increases in poverty (after 2008) were also recorded in Slovakia, while poverty increased in most demographic groups. Like Francis-Devine et al. (2019), the results of this study confirmed that even in Slovakia, children, households with multiple children and single-parent households, and the unemployed were most at risk of poverty. Despite that, the results of Duiella and Turrini (2014), who noted post-crisis increases in poverty in EU countries, especially in connection with severe material deprivation, were not confirmed. In Slovakia, the increase in post-crisis poverty was most evident in the increased share of people at risk of income poverty.
Political-economic stabilisation and the calming of the social situation at the turn of the millennium changed the trajectory of development, with favourable effects on incomes (their increase) and poverty (its decrease). Looking at development in Slovakia, the share of the population in AROPE has decreased significantly—by more than half from 2004 to 2020 (from 32.0% to 15.6%). In the monitored period, Slovakia achieved the greatest progress in reducing severe material deprivation, while in 2020 the value of SMD equalled the EU value. Slovakia also recorded a decrease in poverty values in terms of LWI, which indicates an improvement in the situation on the labour market and more opportunities for full-fledged economic activity. The favourable development of poverty is also documented by the RPT, which fell steeply until 2019 to a value of 4.3%. In 2020—as a result of the health crisis (the COVID-19 pandemic)—it rose again. The results also showed that poverty is much more prevalent in rural areas than in cities. However, its significant increase in recent years (since 2016) in the suburbs is worrying. The growth of inequalities in Slovakia is significantly conditioned by the drop in the median income of the poor. This increases the severity (depth) of poverty, so it is necessary to approach the growth of income inequalities with respect to the poorest sections of the population. Changes in the dispersion around the poverty risk threshold, which is another very important direct indicator of the severity of poverty, must be treated equally seriously, especially for the group of residents with an income lower than 40% or 50% of the median equivalent disposable income. While the 40% curve in the monitored period had a positive trend (values decreased in the monitored period), the 50% curve, on the contrary, increased by almost the same value. This can only be considered as a transfer of income between the poor (the poorest have slightly improved, and the slightly less poor, on the contrary, have slightly worsened).
The analysis at the regional level confirmed large regional differences between the five regions of north-western Slovakia and the three regions located in the south and east of Slovakia. It is clear from the achieved results that the system of income stratification of the population was also significantly differentiated at the regional level in Slovakia. Low-income regions, which make up more than half of the set of 49 examined FURs in Slovakia, have been significantly predominant for a long time. Only eight regions were characterised by a higher or high income, which indicates not only the already mentioned significant income differentiation between regions, but, concurrently, points to a high regional concentration of income. The difference between the income richest and poorest regions was more than double. Municipalities with a slightly above-average income predominated in the territory of north-western Slovakia, while the lowest incomes appeared in the municipalities in the south and northeast of Slovakia, which are characterised by a high representation of elderly residents (dependent on relatively low pensions) or with a high proportion of the ethnic minority Roma. Some municipalities of this territory are even marked simultaneously by both threatened groups of inhabitants.
The obtained results represent the starting point for further investigation of the issue in question. Understanding of the development trends of income inequality and poverty and the identification of vulnerable regions is a necessary prerequisite for reducing income inequality and poverty in Slovakia. The obtained results and knowledge can be a significant contribution especially in decision-making in economic and social policy, but also inspirational in the academic sphere. Decision-making sphere is provided with clear information on which income and poverty parameters should be focused on.
It is obvious that the current global energy crisis and the internal political-economic situation in Slovakia will have a significant negative impact on the social development of the population. This is already apparent in the significant and rapid growth of inflation, the drop in real incomes, and the increase in income inequality and poverty, but also in the growth of social tension in Slovakia. The country, as shown by the latest data (as well as the real deteriorating living conditions of the inhabitants), is facing difficult times. It can be expected that, in the current crises (health, energy, and inflation), as in other crises, the most vulnerable will again lose the most—and not only in Slovakia.
Acknowledgements. The article was created with the support of the scientific project no. 2/0037/21 financed by the Scientific Grant Agency of the Ministry of Education, Science, Research and Sports of the Slovak Republic and the Slovak Academy of Sciences (VEGA) and The Slovak Research and Development Agency (APVV) under contract No. APVV-20-0302 and No. APVV-22-0438.
ALLIANZ (2019), Global Wealth Report 2019, https://www.allianz.com/en/economic_research/publications/specials_fmo/GWR2019_18092019.html [accessed on: 14.05.2022].
ASPE (2013), Change in poverty by select demographic groups: 2007–2012. Office of Human Services Policy, Issue brief, https://aspe.hhs.gov/reports/change-child-poverty-selected-demographic-characteristics-2007-2012 [accessed on: 17.09.2022]
COBHAM, A. and SUMNER, A. (2013), Is it all about the tails? The Palma measure of income inequality. CGD Working Paper 343. Washington, DC, USA: Centre for Global Development, http://www.cgdev.org/publication/it-all-about-tails-palma-measure-income-inequality [accessed on: 26.03.2022].
DORLING, D. and PRITCHARD, J. (2010), ‘The geography of poverty, inequality and wealth in the UK and abroad: because enough is never enough’, Applied Spatial Analysis and Policy, 10 (3), pp. 81−106.
DUIELLA, M. and TURRINI, A. (2014), Poverty developments in the EU after the crisis: a look at main drivers, ECFIN Economic Brief, 31, pp. 1−10. doi:10.2765/72447
EZCURRA, R., PASCUAL, P. and RAPÚN, M. (2007), ‘The spatial distribution of income inequality in the European Union’, Environment and Planning, 39 (4), pp. 869–890.
EUROSTAT (2022), Database, https://ec.europa.eu/eurostat/data/database [accessed on: 03.01.2023].
FRANCIS-DEVINE, B., BOOTH, L. and MCGUINNESS, F. (2019), Poverty in the UK: statistics. Briefing paper, number 7096, (2 July 2019).
FÖRSTER, M., JESUIT, D. and SMEEDING, T. (2005), ‘Regional poverty and income inequality in Central and Eastern Europe: evidence from the Luxembourg income study’, [in:] KANBUR, R. and VENABLES, A. J. (eds), Spatial inequality and development. Oxford: Oxford University Press, pp. 311–347.
GAJDOŠ, P. and PAŠIAK, J. (2006), Regionálny rozvoj Slovenska z pohľadu priestorovej sociológie (Regional development of Slovakia from the point of view of spatial sociology), Bratislava: Sociologický ústav SAV, NK UNESCO MOST.
GRAY, D., MILLS, J, A. and ZANDVAKILI, M. S. (2004), ‘An analysis of differential provincial income inequality trends in Canada’, [in:] BISHOP, J. A. and AMIEL, Y. (eds), Studies on Economic Well-Being: Essays in the Honour of John P. Formby (Research on Economic Inequality, 12), Emerald Group Publishing Limited, pp. 443–461. https://doi.org/10.1016/S1049-2585(04)12018-8
CHAUDRY, A., WIMER, CH., MACARTNEY, S., FROHLICH, L., CAMPBELL, C., SWENSON, C., OELLERICH, D. and HAUAN, S. (2016), Poverty in the United States: 50-Year trends and safety Net impacts office of Human services policy office of the Assistant secretary for planning and evaluation, U.S. Department of Health and Human Services.
JOSEPH ROWNTREE FOUNDATION (JRF), UK Poverty 2017. A comprehensive analysis of poverty trends and figures. Report by the JRF Analysis Unit. York: Joseph Rowntree Foundation.
KOREC, P., ONDOŠ, S. and RUSNÁK, J. (2016), ‘Regionálne disparity na Slovensku; niekoľko poznámok k ich bádaniu (Regional disparities in Slovakia; some remarks on their research)’, Acta Geographica Universitatis Comenianae, 60 (2), pp. 257−293.
MADAJOVÁ, M., MICHÁLEK, A. and PODOLÁK, P. (2014), ‘Úroveň regionálnych disparít na Slovensku a jej zmena v období rokov 2001-2011 (The level of regional disparities in Slovakia and its changes in 2001-2011)’, Geographia Slovaca, 28, pp. 127−152.
MATLOVIČ, R., KLAMÁR, R. and MATLOVIČOVÁ, K. (2008), ‘Vývoj regionálnych disparít začiatkom 21. storočia na Slovensku vo svetle vybraných indikátorov (Development of regional disparities in Slovakia at the beginning of 21st century based on the selected indicators)’, Regionální studia, 2, pp. 2−12.
MATLOVIČ, R. and MATLOVIČOVÁ, K. (2011), ‘Regionálne disparity a ich riešenie na Slovensku v rozličných kontextoch (Regional disparities and their solution in Slovakia in the various contexts)’, Prírodné vedy, Folia Geographica, LIII (18), pp. 8−88.
MICHÁLEK, A. and VÝBOŠŤOK, J. (2019), ‘Economic growth, inequalities and poverty in Slovakia from 2005 to 2015 (the analysis of relations and contexts at a regional level)’, European Spatial Research and Policy, 25 (1), pp. 55−74. https://doi.org/10.18778/1231-1952.25.1.04
MICHÁLEK, A. et al. (2020), Príjmové nerovnosti a ich prejavy v regiónoch Slovenska (Income inequality and their effects in regions of Slovakia). Bratislava: Veda.
MUFFELS, R., FOUARGE, D. and DEKKER, R. (2000), Longitudinal poverty and income inequality: a comparative panel study for the Netherlands, Germany and the UK. MPRA Paper No. 13298. OSA Institute for Labour Studies.
PALMA, J, G. (2011), Homogeneous middles vs. heterogeneous tails, and the end of the ‘Inverted-U’: the share of the rich is what it’s all about. Cambridge Working Papers in Economics (CWPE) 1111, Cambridge University, Great Britain: Retrieved: 19 March 2013.
PAREDES, D., ITURRA, V. and LUFIN, M. (2014), ‘A Spatial Decomposition of Income Inequality in Chile’, Regional Studies, 50 (5), pp. 771−789.
PAUHOFOVÁ, I. et al. (2016), Súvislosti príjmovej polarizácie na Slovensku (Context of income polarization in Slovakia), Bratislava: EU SAV.
PEDERSEN, P. J. and SMITH, N. (1998), Low Incomes in Denmark 1980–1995. Paper Provided by Centre for Labour Market and Social Research, Denmark – in its Series Papers with Number 98–19.
PIKETTY, T. and SAEZ, E. (2003), ‘Income inequality in the United States, 1913–1998’, Quarterly Journal of Economics, 118 (1), pp. 1–41.
SOCIAL INSURANCE AGENCY OF THE SLOVAK REPUBLIC (2021), Anonymizované údaje o vymeriavacích základoch na platenie poistného na sociálne poistenie v SR (2004–2017), Bratislava, Slovakia: Sociálna poisťovňa.
STATISTICAL OFFICE OF THE SLOVAK REPUBLIC (2022a), The EU Statistics on Income and Living Conditions (EU-SILC 2021), Sekcia sociálnych štatistík a demografie. Odbor štatistiky životnej úrovne obyvateľstva, Bratislava, Slovakia: SO SR.
STATISTICAL OFFICE OF THE SLOVAK REPUBLIC (2022b), DATAcube. http://datacube.statistics.sk [accessed on: 19.01.2023].
TUREČKOVÁ, K. (2015), ‘Income Inequality by Method of Non-weighted Average Absolute Deviation: case study of Central and Eastern European Countries. Equilibrium’, Quarterly Journal of Economics and Economic Policy, 10 (4), pp. 99−110. http://dx.doi.org/10.12775/EQUIL.2015.037
VÝBOŠŤOK, J. (2020), ‘Spravodlivá nerovnosť?’, Quark: magazín pre vedu a techniku, 26 (9). https://www.quark.sk/spravodliva-nerovnost/ [accessed on: 17.11.2022].