Volume 30, 2023, Number 2
https://doi.org/10.18778/1231-1952.30.2.09


Abstract. The study focuses on the factors affecting visitor numbers to archaeological sites in Turkey. The aim is to investigate the geographical, economic, and demographic factors underlying the visits using statistical methods. The study covers 117 archaeological site visits in 2019. Although existing studies analysed determinants of visits to archaeological sites of different countries, the evidence needs to be explicit. Methodologically, the classical linear regression models are primarily applied in the literature, whereas the incorporation of spatial dependence has largely been ignored. This study contributes to the literature by employing demographic, economic, and climatic factors and spatial relations between the sites. Therefore, spatial autoregressive (SAR) and spatial error models (SEM) are developed in the analyses. According to the results, WHL inscription and distance to the city centre are crucial factors for the visits. In addition, the study emphasizes the significant negative effect of spatial dependence on visitor numbers of archaeological sites near each other.
Key words: archaeological sites, World Heritage List, tourist, OLS regression, spatial regressions.
Visibility and recognition of Turkey’s archaeological heritage have developed in recent decades. As a subgroup of cultural heritage, the archaeological sites of Turkey consist of such structures as ancient cities, theatres, sanctuaries, castles, monasteries, mounds, caves, underground cities, mausoleums, rock tombs, and rock churches, which represent different periods from the prehistory to the Ottoman Empire. As of 2022, 22,898 archaeological sites, 35 urban archaeological, 63 archaeological-urban (mix), 18 archaeological-historical (mix), and 7 archaeological-historical-urban (mix) sites were registered in Turkey, which constituted approximately 97% of all of the site types (MCT, 2023a). The diversity and plentifulness of archaeological sites attract the attention of visitors. Formerly being the entertainment of merely the upper-class, cultural excursions became an activity that any segment could perform since the 1960s (Çokişler, 2022; Eres and Özdoğan, 2018). Governmental initiatives involving comprehensive conservation programs, partnerships with international organisations, and legislation to make sure the accessibility of archaeological remains were implemented (Ahunbay, 2010). The Ministry of Culture and Tourism, Republic of Turkey carries out activities for the identification, registration and, if necessary, expropriation of immovable cultural assets, including archaeological sites. The scientific excavation of archaeological sites approved seasonally by the Ministry is conducted by local and foreign universities. The Ministry provides the budget for these excavations, and, in some cases, private associations also contribute to the funding. It is also the responsibility of the Ministry to establish landscape organisation of the sites to open them for visitors. The Ministry also allocates a budget for the conservation and restoration projects of the structures in the archaeological sites. Some projects and implementations are funded internally, while others are awarded through the tender procedure (MCT, 2023b). In addition to financial support and cooperation, the Ministry announces certain years as archaeological site years to enhance the prominence of these significant sites. For instance, the year 2018 was declared the Year of Troy (MCT, 2018), 2019 was the Year of Göbeklitepe (MCT, 2019), and 2020 was the Year of Patara (MCT, 2020). These actions enhanced the visibility of Turkey’s archaeological sites and also fostered a deeper appreciation among both domestic and international visitors for the country’s cultural heritage (Türkoğlu, 2020). As a result, cultural excursions have been increasingly important for Turkey’s tourism industry, offering opportunities for visitors to immerse themselves in history and past civilisations.
The emergence of interest in archaeological and historic sites in the 19th century brought attention to the conservation of cultural heritage. In 1972, UNESCO initiated the Convention Concerning the Protection of the World Cultural and Natural Heritage (UNESCO, 1972, 2021), which resulted in creation of the World Heritage List (WHL) containing selected cultural and natural properties having Outstanding Universal Value (UNESCO, 1972, 2021). Inclusion in the WHL increases the chances of protection and raises the visibility of these sites (Selcuk et al., 2023). In Turkey, both governmental and academic efforts have been undertaken to facilitate the inclusion of archaeological sites in the WHL (Ulusan, 2023; Ulusan and Ersoy, 2019). These initiatives encompass various activities such as conservation, presentation, and promotion, all aimed at unveiling the value of these archaeological sites. As a result, these endeavours have significantly contributed to the inscription of sites in Turkey in the WHL (Türkoğlu, 2020). For the first time, the cultural properties of Turkey were included in the WHL in 1985. As of June 2023, Turkey has had 19 sites in the WHL and 84 sites on its Tentative List (TL), awaiting inscription to the WHL. Among these, 14 from the WHL and 51 from the TL are archaeological heritage sites (UNESCO, 2023a, 2023b). This information demonstrates Turkey’s ongoing commitment to increasing its recognition of its archaeological heritage, as also remarked by Ulusan and Yıldırım (2016). Moreover, 6 of Turkey’s top 10 most visited places are archaeological heritage, while 8 of the 10 most visited archaeological sites are in UNESCO’s WHL (DÖSİMM, 2019). Over the years, being in UNESCO’s WHL became an expression of prestige, as the List provided sites worldwide recognition (Meskell, 2018). Consequently, with the effect of rapid globalisation, WHL inclusion increased their visibility and usage for touristic purposes (Allkja and Dhrami, 2021; Assumma et al., 2022).
Along with being included in the WHL, there are also other factors that attract visitors, such as an area’s demographic, economic, climate, and geographical characteristics. For instance, the population of the region plays a vital role in understanding the visitation patterns. Research conducted by Huang et al. (2012) indicated that population significantly influences the visitation demand in archaeological sites. The influence of weather and climate on demand for tourism has also been widely recognised, as highlighted by Ridderstaat et al. (2014). The influence of climate and weather is expected to be significant for visits to archaeological sites, which predominantly comprise open areas. In addition to climate and weather, geographic factors have been acknowledged as crucial in shaping tourist behaviour. For instance, Liang and Zhang (2022) asserted the significance of the region’s distance from the city centre, while Mejjad et al. (2022) highlighted the role of being located on the coast or within a coastal city in attracting visitors. Furthermore, economic factors have a pronounced impact on visits. Nepal et al. (2019) and Karabulut et al. (2020) introduced the reciprocal effects of variables such as income per capita of the host region in promoting tourist visits. It is of great significance to investigate the effects of these variables on cultural heritage sites.
Several studies have related cultural heritage sites to tourism development due to the substantial appeal of these sites as tourist destinations. In these studies, among other factors such as income per capita, population, origin country, travel cost, and accommodation, the effect of the World Heritage Site (WHS) on visitors was examined. Yang et al. (2010) and Patuelli et al. (2013) examined the effect of being a WHS on visitor numbers. Along with that, Abuamoud et al. (2014) investigated the demand by tourists for visiting heritage places in Jordan. These studies emphasized the positive effect of the WHS on both domestic and international tourist numbers. Furthermore, in the study of Carey et al. (2012), the positive effects of the city museum on tourist visits were expressed. In these studies above, the factors affecting visitor numbers are as follows: education level, age, the income of visitors, crime rates, health infrastructure, the population of destination region, other attractive points such as national park and beach, accommodation and service infrastructure, transportation, and travel costs. However, to our knowledge, the number of previous studies fall short to investigate the factors affecting tourist numbers of the archaeological sites in Turkey by employing statistical models. Given the fundamental role of archaeological sites in Turkey’s tourism industry, it is essential to examine various factors that influence tourist visits empirically. While being included in the WHL represents a significant aspect, it should be noted that it is not the sole determinant. Therefore, the present study aims to determine the impact of other influential site-specific factors alongside the WHL by implementing a coherent and comprehensive approach. In detail, the current study aims to extend the literature in specific directions. (i) although existing studies have attempted to analyse underlying determinants of visits to cultural/archaeological heritage sites for different countries, the evidence needs to be more apparent, and there needs to be a clear cut in the literature; (ii) to the best of our knowledge, no existing studies investigate these factors in the case of Turkey; (iii) methodologically, the classical linear regression models are primarily applied in the literature, whereas the incorporation of spatial dependence has largely been ignored. However, in local/regional studies, it is widely known that ignoring spatial interaction across units may lead to misleading results (Anselin, 1988a, 1988b; Anselin et al., 1996; Anselin and Florax, 1995).
Hence, this work aims to examine the factors influencing visitor numbers to archaeological sites in Turkey by pursuing the innovations mentioned above. The study is limited to only archaeological site visits rather than other cultural heritage sites, without separating domestic or international tourist numbers. In this study, 81 provinces of Turkey were analysed as for the year 2019. The dataset includes a wide range of economic and geographical variables for 117 sites which were organised as archaeological sites established as a controlled area; therefore, the number of visitors could be recorded and provided by the Ministry of Culture and Tourism, Republic of Turkey. In the methodology section, several regression techniques are employed, such as ordinary least squares (OLS), spatial autoregressive model (SAR), and spatial error models (SEM). In the remaining sections, Part 2 explains the literature on implementing statistical methods in tourism studies, especially those investigating the determinants of visitor numbers. Part 3 describes the data collection, applied methods, and variables. Part 4 presents the empirical findings and their interpretation of this study. Concluding remarks and future research suggestions are summarised in the final part.
Several studies have introduced statistical methods in visitor studies on heritage sites. These studies analyse the influence of heritage sites on the number of domestic or international tourists. Moreover, some have investigated economic, demographic, and geographical determinants of visitors and destinations. Yang et al. (2010) investigate the influence of WHS on tourist numbers in China. Panel analysis for 2000−2009 was adopted. Based on 31 provinces, a gravity model is established. The model includes the determinants such as income level, origin country’s population, distance to the origin country, travel coast, crime rate, transportation, health utilities, natural spots, and tourism service infrastructure. As a result of the study, WHS status is found critical for tourist arrivals. Also, cultural sites attract tourists more than natural ones because of China’s deep-rooted history and culture.
Similar to the study by Yang et al. (2010), Patuelli et al. (2013) analysed the impacts of WHS on domestic tourism in Italy’s different regions with different methods. Annual panel data between 1998−2009 are used in domestic tourism flows to understand the determinants of regional arrivals to accommodation units. In addition, the impact of contiguity for every twenty regions is investigated in the spatial sensitivity analysis. The variables are the number of WHS, regional GDP, tourism service, leisure activities, population, price index, crime index, transportation, polluted coasts, distance, off-seasonal stays, and cultural demand index. It is concluded that inscriptions to the WHL positively affect domestic tourism flow. Furthermore, the contiguity relationship has a negative influence on regional tourist numbers.
As in the study of Patuelli et al. (2013), Huang et al. (2012) analysed the influence of WHS on tourist numbers in the Macau region of China. Panel data between the years 1999−2009 was used. The impact of Macau’s (WHL) inscription was measured for the international tourist coming from 19 countries. The variables were GDP and population of origin country, distance, transportation cost, currency rates, overnight stays, crime index, and the number of casinos. The results showed that income per capita, population, distance, and currency rates were crucial. In addition, features of the cultural site, hotels and casinos, and crime index played an important role in tourism.
Another study on the impacts of WHS on visitor numbers was done by Su and Lin (2014). Panel dataset covering 66 countries and the 2006−2009 period was used. The income per capita, population, exchange rate, railway lines, the index of political rights, health expenditure, and education expenditures were determined as independent variables. Differently from other studies, cultural and natural sites were analysed separately, while mixed sites were not included. The study showed that the effect of natural sites was more significant than cultural sites. Furthermore, the increasing number of WHS increased tourist arrivals, as they were already tourist attractions.
Cuccia et al. (2016) examined the effect of WHS on tourism development in Italian regions by using data envelopment analysis for the 1995−2010 period. Independent variables included accommodation capacity, overnight stays, visits to the museum or historic buildings, natural park area, beach size, motorways, and crime index. The results showed a negative relation between WHS and tourism destinations. At the same time, it was positively correlated with cultural and natural attractions because the management and infrastructure of WHS had a crucial role in tourism demand.
Abuamoud et al. (2014) presented the marginal impacts of factors influencing the visitor numbers to Jordan’s cultural heritage sites. The study was limited to 9 registered sites in Jordan’s Northern Badia area. 32 questions consisted of primary personal data of the participants, characteristics of the places, and tourism activities of the participants are asked 300 participants. The study results showed that the participants’ main reasons for visiting those sites were business, wildlife observation, and religion. The most significant factor was the income of the participants rather than their age, gender, education status, study area, or nationality.
Naudé and Saayman (2005) investigated the factors that affected visits to 43 African countries. In the study, cross-section data and panel data were used for the 1996−2000 period. Independent variables were the number of internet users, political stability index, number of hotel rooms, death rate, income per capita, the distance between countries, urbanisation rate, the prevalence of malaria (health conditions), number of telephone lines, and number of frost days. According to the results, the origin country’s income level, travel cost, and prizes were ineffective.
Apart from the studies mentioned above, Carey et al. (2012) analysed the relationship between the tourist flow to the capital city of Wellington and the opening of Te Papa Tongarewa Museum (New Zealand). The economic regression model was developed to assess museum visits and the tourism growth of the accommodation sector of the city by using time series data for the 1999−2009 periods. It was obtained that the museum’s opening had a positive effect in terms of tourist arrivals and their stays.
The studies above have tried to find the determinants behind visits to cultural or archaeological heritage sites from different countries. In the majority of reviewed studies, significant attention was directed towards assessing the impact of the WHL inscription, especially within State Parties boasting a substantial number of WHS, such as Italy and China (UNESCO, 2023a, 2023b). While these studies have established a positive linear correlation between WHS designation and tourist visitation, it is noteworthy that one study identified a negative impact associated with WHS inscription (Cuccia et al., 2016). In summary, other than the WHL, income, population, distance, currency rates, crime index, hotels, features of the cultural site, and museums significantly affect the visitor numbers. The contiguity relationship has been found to exert a negative influence, while factors such as visitors’ age, gender, education level, nationality, travel cost, origin country, prices, transportation, and health utilities were found ineffective.
The 117 archaeological sites evaluated in this study are illustrated using a map in Fig. 1. The examined archaeological sites encompass the entirety of those sites for which visitor number data was recorded and shared by the Ministry of Culture and Tourism, Republic of Turkey for 2019, ensuring that all were included in the study (DÖSİMM, 2019). The enumeration of the archaeological sites presented on the map was done in alphabetical order. The names and index numbers of each site with the visitor numbers are provided in Appendix A. According to Fig. 1, most archaeological sites are grouped near the Aegean and Mediterranean Coastlines. Another major grouping of sites is around Göreme National Park and the Rock Sites of Cappadocia in Central Anatolia.
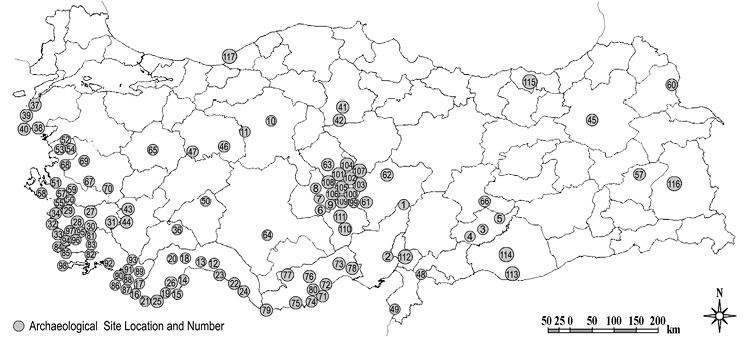
Fig. 1. Archaeological Sites in Turkey
Source: own work. Locations were marked using Google Earth and Photoshop.
It is presumed that the WHL inscription of an archaeological site may significantly affect visitor numbers (Huang et al., 2012; Patuelli et al., 2013; Su and Lin, 2014; Yang et al., 2010). Since some archaeological sites are on the seacoast or in a coastal city, they can be attractive to people who want to take sea vacations. In addition, the presence of archaeological sites within a national park may also attract visitors (Cuccia et al., 2016; Mejjad et al., 2022; Su and Lin, 2014). Having an on-site archaeological museum may provide a variety of activities during sightseeing (Carey et al., 2012). Transportation facilities to the site and the region’s temperature may also affect the visit numbers (Ridderstaat et al., 2014). Moreover, the economic development level of the cities can be determined by income per capita (Abuamoud et al., 2014; Huang et al., 2012; Karabulut et al., 2020; Nepal et al., 2019), population, and distance (Huang et al., 2012; Liang and Zhang, 2022) may influence visits to the site. Hence, the variables selected for the study encompassed several factors that included the presence of an on-site archaeological museum, location within a natural park, inclusion in the WHL or TL, being a coastal site or situated within a coastal city, distance from the city centre, temperature, population size of the corresponding city, and income per capita.
Due to its simplicity and applicability, the OLS technique was initially chosen to explore the factors affecting archaeological site visitor numbers. The following equation represents the regression model that is proposed in the study:
| Visitori = α + β1museumi + β2natparki + β3whli + β4coastsitei + β5coastcityi + β6distancei + β7temperaturei + β8populationi + β9icpi + ∈i | (1) |
i = archaeological sites, 1, …, 117
The Visitor dependent variable refers to the visitor numbers to the archaeological sites recorded in 2019. ∈ represents the error terms, which are observed to have heteroskedasticity, and non-normal distribution. In order to overcome this problem, Newey-West HAC Heteroskedasticity and Autocorrelation Consistent was adopted in the study (Newey and West, 1987; White, 1980).
As indicators of the characteristics of the archaeological sites, Museum, NatPark, WHL, and CoastSite are included as discrete variables in the equation. Museum indicates if an archaeological site has an on-site archaeological museum, while NatPark refers to the specialty of whether a site is in a natural park. As a prominent index of novelty, the variable WHL denotes the archaeological site is inscribed to UNESCO’s WHL, the country’s TL, or not. Following similar studies that focus on the prominence of WHS in the literature, this variable is expected to be significant in the visitor numbers (Cellini, 2011; Huang et al., 2012; Yang and Lin, 2011; Yang et al., 2010). As the last characteristic of the site, CoastSite is the variable that shows if a site is near the sea within a 25 km threshold. It is another variable anticipated to be positively influential on the visitor numbers since being on the sea site may combine the summer activities. Consequently, the archaeological site can be more attractive to visitors.
The remaining factors represent economic and geographical variables, including CoastCity, Distance, Temperature, ICP, and Population. CoastCity is a discrete variable that indicates whether a city that has an archaeological site is located on a sea coast. In contrast, the Distance variable denotes a site’s distance to the city centre in kilometres. Temperature, population, and income per capita of the provinces were also included in the study to see their influence on visitor numbers, as they were employed in other studies in the literature. The definition of all the variables is summarised in Table 1. Also, the correlation matrix of the variables is given in Appendix B.
| Variable Name | Definition | Units | Data Sources | Year |
|---|---|---|---|---|
| Visitor | Visitor number of the archaeological sites | People | Republic of Turkey, Ministry of Culture and Tourism (DÖSİMM, 2019) | 2019 |
| Museum | Whether or not the archaeological site has an on-site archaeological museum (1 yes or 0 no) | Discrete Variable | Central Directorate of Rotary Capital Management/ Republic of Turkey Ministry of Culture and Tourism-Museums (MCT, n.d.) | 2019 |
| Natpark | Whether or not the archaeological site is in a national park (1 yes or 0 no) | Discrete Variable | General Directorate of Nature Conservation and National Parks (Republic of Turkey Ministry of Agriculture and Forestry, n.d.) | 2019 |
| WHL | Whether or not the archaeological site is in UNESCO’s World Heritage List or the Tentative List (2 WHL, 1 TL, or 0 no) | Discrete Variable | UNESCO / Republic of Turkey Ministry of Culture and Tourism (UNESCO, 2023c, 2023d) | 2019 (not included 2023 Lists) |
| CoastSite | Whether or not the archaeological site near the coast (25 km threshold) (1 yes or 0 no) | Discrete Variable | Google Maps (Google Maps, n.d.) | – |
| CoastCity | Whether or not the archaeological site in a coastal city (1 yes or 0 no) | Discrete Variable | Google Maps (Google Maps, n.d.) | – |
| Distance | Distances of the archaeological sites to the city centre | Kilometres | Google Maps (Google Maps, n.d.) | – |
| Temperature | Average temperature of the provinces that archaeological sites are located | Degrees of Celsius | Turkish State Meteorological Service (Turkish State Meteorological Service, n.d.) | 1929–2019 |
| Population | Population of the provinces that archaeological sites are located | People | Turkish Statistical Institute (TUİK, 2019) | 2019 |
| ICP | Income per capita of the provinces that archaeological sites are located (in Turkish Lira) | Turkish Liras | Turkish Statistical Institute (TUİK, 2019) | 2019 |
Two variables were not included in the study: ‘entrance fees’ to archaeological sites and ‘tourist numbers’ of the cities in which the archaeological sites are placed. However, both variables already cannot answer the study’s research question. Entrance fees increase in relation to an increase in visitor numbers because management raise the prices of popular sites. As for tourist numbers, they are highly correlated with the visitor numbers since archaeological sites are significant tourist attractions. Consequently, these two variables were excluded from the study.
In addition to the OLS technique, the presence of spatial dependence of each variable was also sought in the study. It is essential that failing to include such a component is problematic and may cause biased estimations (Anselin, 1988a, 1988b, 2001; Anselin et al., 1996; Anselin and Moreno, 2003; Anselin and Rey, 1991; Anselin and Florax, 1995; LeSage and Pace, 2010; Rey, 2001). In order to examine the spatial dependence of the variables, Moran I’s test was applied, which was first introduced by Moran (1950) and is employed in empirical literature (Rey and Montouri, 1999). The test details can be found in Rey, (2001), and Rey and Montiouri (1999).
The present work employs a spatial weighting matrix as a raw standardised inverse distance matrix (Herrera Gomez et al., 2012; Anselin, 1988a, 1988b). So, the closest neighbours obtain a higher weight. A positive and significant value of Moran’s I would point to a positive spatial correlation, meaning the archaeological sites with closer values are located nearby. As nearby archaeological sites possibly have similar geographical and economic characteristics, their tourist visits are likely to be similar. It may even be the case that an increase in the tourist number in an archaeological site may trigger an increase in the neighbouring site since touristic tours may divert tourists to the nearby sites as daily excursions.
The presence of spatial autocorrelation can be examined by Lagrange Multiplier Tests, such as LMerr, LMLag, RLMerr, and RLMLag (Anselin, 1988a, 1988b, 2001; Anselin et al., 1996; Anselin and Moreno, 2003; Anselin and Rey, 1991; Anselin and Florax, 1995; LeSage and Pace, 2010; Rey, 2001; Rey and Montouri, 1999; Elhorst, 2014; Duran and Gajewski, 2023). LMerr tests assume spatial dependence in error terms, whereas LMLag tests assume spatiality in the dependent variable. The rule offered by Anselin and Florax (1995) is employed to decide on models. According to that rule, if the LMlag test statistics are observed to be higher and more significant than LMLag, SEM is more appropriate (Anselin and Florax, 1995). In contrast, if the reversecondition is valid, then the SAR is more appropriate (Anselin, 1988a, 1988b, 2001; Anselin et al., 1996; Anselin and Moreno, 2003; Anselin and Rey, 1991; Anselin and Florax, 1995; LeSage and Pace, 2010; Rey, 2001; Rey and Montouri, 1999; Elhorst, 2014).
Finally, to empirically consider the effect of the spatiality, two more models have been established, which are SAR and SEM (Anselin, 1988a, 1988b, 2001; Anselin et al., 1996; Anselin and Moreno, 2003; Anselin and Rey, 1991; Anselin and Florax, 1995; LeSage and Pace, 2010; Rey, 2001; Rey and Montouri, 1999; Elhorst, 2014). The former incorporates the spatial interaction among neighbour’s dependent variables, while the latter regards the spatial connectivity in residuals. The most general form is as follows:
| Visitori = α + β1museumi + β2natparki + β3whli + β4coastsitei + β5coastcityi + β6distancei + β7temperaturei + β8populationi + β9icpi + ρωVisitori ∈i ∈i = λωεj | (2) |
i = archaeological sites, 1, ….,117
When λ=0, it refers to the SAR model. ρ symbolises the effect of the neighbour sites’ visitor number on i’s visitor number, ω is the spatial weight matrix. When ρ=0, the model becomes SEM. λ is the spatial dependence among the error terms of the neighbour sites i and j (Anselin, 1988a, 1988b, 2001; Anselin et al., 1996; Anselin and Moreno, 2003; Anselin and Rey, 1991; Anselin and Florax, 1995; LeSage and Pace, 2010; Rey, 2001; Rey and Montouri, 1999; Elhorst, 2014). All of the OLS, SAR, and SEM models are estimated in the study. The empirical analyses are implemented with the help of R-4.1 software with SP, SPLM, and SPDEP packages (Bivand et al., 2013; Millo and Piras, 2012; Millo et. al., 2018; Pebesma and Bivand, 2005).
The initial step in the study is to describe the visitor numbers to the archaeological sites in Turkey and the variables that may affect it. Table 2 provides the descriptive statistics of each variable. Specifically, it provides the mean, standard deviation, and maximum and minimum values. The visitor numbers to the archaeological sites varied between 2,557,868 and 638 people in 2019. The highest number of visitors was recorded in Hierapolis-Pamukkale in Denizli (no. 43), while the lowest was observed in Niğde Andaval Archaeological Site (no. 111). The mean of the visitors to all archaeological sites in Turkey was observed to be 128,058.5, with a standard deviation of 327,421.8.
| Variables | Mean | SD | Max | Min |
|---|---|---|---|---|
| Visitor | 128058.5 | 327421.8 | 2557868 | 638 |
| Museum | 0.09 | 0.29 | 1 | 0 |
| Natpark | 0.04 | 0.20 | 1 | 0 |
| WHL | 0.68 | 0.78 | 2 | 0 |
| CoastSite | 0.38 | 0.49 | 1 | 0 |
| CoastCity | 0.59 | 0.49 | 1 | 0 |
| Distance | 71.94 | 52.91 | 236 | 1 |
| Temperature | 15.3 | 3.36 | 19.1 | 4.7 |
| Population | 1520309 | 1234182 | 5639076 | 242938 |
| Income per Capita | 38957.03 | 9664.20 | 60249 | 16068 |
According to Moran I’s test applied to the variables of the present study, all the variables are spatially correlated, except the dependent variable Visitor Numbers and Natpark (Table 3). Hence, to understand the reasons for visitor numbers to the archaeological sites in Turkey, basic OLS without spatial indicators may lead to deficiencies.
| Variables | Moran I Test Statistics | P-Values |
|---|---|---|
| Visitor | -0.0156 | 0.6034 |
| Museum | -0.0119 | 0.5427 |
| Natpark | *0.0315 | 0.0825 |
| WHL | ***0.2112 | 2.16E-12 |
| CoastSite | ***0.3088 | 2.20E-16 |
| CoastCity | ***0.4146 | 2.20E-16 |
| Distance | ***0.2964 | 2.20E-16 |
| Temperature | ***0.3652 | 2.20E-16 |
| Population of the City | ***0.3463 | 2.20E-16 |
| Income per Capita | ***0.3886 | 2.20E-16 |
After determining the variables’ spatial dependence, spatial autocorrelation was examined using LMerr, LMLag, RLMerr, and R LMLag tests. The results are presented in Table 4. In all tests, positive autocorrelation is evident. Therefore, it is proven that spatiality is a crucial issue in the present model.
| Test Name | Test Statistics | P-Value |
|---|---|---|
| LMerr | ***13.72 | 0.0002 |
| LMlag | ***7.42 | 0.0064 |
| RLMerr | ***10.5 | 0.0011 |
| RLMlag | **4.2 | 0.0404 |
The study results are given in Table 4, considering all the regression models. The first column denotes the regular OLS results, while the other columns present the SAR and SEM spatial model results (Table 5).
| OLS (Newey-West HAC) | SAR | SEM | ||||
|---|---|---|---|---|---|---|
| Estimated Coefficients | P-Value | Estimated Coefficients | P-Value | Estimated Coefficients | P-Value | |
| Alpha | -284,919.7 | 0.2590 | -248,370 | 0.247413 | -299,930 | 0.10293 |
| Museum | 180,482.2 | 0.3298 | *159,380 | 0.083659 | 141,060 | 0.10852 |
| Natpark | -201,560.2 | 0.1111 | *-228,370 | 0.084145 | **-244,000 | 0.04289 |
| WHL | ***176,514.4 | 0.0009 | ***197,360 | 3.214E-08 | ***196,880 | 6.1E-12 |
| CoastSite | *106,766.7 | 0.0598 | *126,040 | 0.077847 | ***168,590 | 0.00412 |
| CostCity | -140,903.3 | 0.1504 | *-163,310 | 0.079081 | **-173,660 | 0.02751 |
| Distance | ***-1,464.407 | 0.0085 | ***-1,724.2 | 0.003347 | ***-1,940 | 6E-05 |
| Temperature | 16,200.33 | 0.2476 | 16,644 | 0.165438 | 16,732 | 0.10798 |
| Population | -0.044775 | 0.2660 | -0.042403 | 0.189904 | -0,038181 | 0.15914 |
| IPC | 6.456475 | 0.1336 | *7.4013 | 0.075068 | **7.0604 | 0.0409 |
| N | 117 | Rho: **-0.458 | 0.0199 | Lambda: ***-0.839 | 0.0003 | |
| R-Squared | 0.25 | |||||
| F-Statistics | ***3.98 | 0.0002 | ||||
| White Heteroskedasticity Test (OBSxR-Squared) |
**26.56 | 0.0220 | ||||
Quite different results were observed from OLS compared to the Spatial models, indicating the relevance of spatial regressions. The ρ and λ parameters are negative and significant. It means that an increase in the tourist of one site leads to a decrease in the surrounding ones. It may happen for several reasons. A plausible explanation is that popular sites compete very well with the neighbours, so the surrounding sites cannot attract too many tourists.
First, the WHL variable has a positive and significant coefficient regardless of the model type in all regressions. So, it is evident that the archaeological sites in WHL are visited more than the others. The sites that are rated in WHL or the TL have welcomed more visitors than the ones which are not on the Lists. It can be concluded that being in UNESCO’s WHL increases the reputation of the sites, thus drawing visitors’ attention.
Second, Distance has a negatively significant coefficient in all three models. It means the closer the archaeological site is to the city centre, the more visitors it hosts. When the site is near a city centre, it is more accessible to the people. Therefore, people will tend to visit archaeological sites more.
Third, CoastSite is another significant variable in all three models. When the archaeological site is near the sea coast, it influences the visit numbers positively. Being a coastal site is expected to create an opportunity for summer activities for the people and the archaeological site visit.
Finally, although not in all estimated regressions, Natpark and CoastCity variables have a negative and significant coefficient, while IPC has a positive and significant coefficient depending on the spatial models. It is expected that income per capita to have significance on visitor numbers since it is an index of the vividness of the economy. However, being in a natural park and a coastal city did not perform as positively significance as it is presumed. These variables do not arouse incentives to visit the archaeological sites.
Archaeological sites in Turkey are very significant cultural attractions for all tourists. The visits to the archaeological sites depend on various reasons such as location, climate, other cultural and recreational activities, and being a UNESCO WHS. Despite the importance of archaeological sites in Turkey and the country’s intentions to promote its cultural heritage through them, a noticeable research gap exists regarding the motivations underlying tourists’ visits to these sites. In this paper, the factors that affect visitor numbers of 117 archaeological sites in Turkey are analysed. So, empirical applications are carried out for 2019 data of the determined variables as the on-site archaeological museum, national park, WHL/TL, coastal site, coastal city, distance to the city centre, temperature, income per capita, and population of the city by using OLS, SAR, and SEM models. The findings indicate that three of the determinants are significant in the visitor numbers.
According to the results, UNESCO’s WHL and the TL inscription significantly increased the archaeological sites’ novelty. UNESCO WHL inscription supports the development of heritage management plans and infrastructure upgrades, which are vital in enhancing the appeal and accessibility of archaeological sites (Winter, 2015). Therefore, being in WHL or TL is a variable representing the value of the places and leads the visitors to see the archaeological sites. Consistently, the inclusion of Ephesus, Hierapolis, and Göreme archaeological sites in UNESCO’s WHL has resulted in them emerging as the top three most visited sites in Turkey. The result of the WHL inscription’s positive effect on visitor numbers are parallel with the studies of Su and Lin (2014), Tan et al. (2023), and Yang and Lin (2011). However, contrasting perspectives have been presented by Cellini (2011) and Huang et al. (2012), suggesting that the impact of being included in WHL on tourist numbers may not be deemed crucial.
The results showed that people visit sites located closer to the city centre. When the site is easy to access from the city centres, it creates more incentives for visitors, as indicated by Huang et al. (2012). Since archaeological sites are usually outside the city centres, distance from the city centre and transportation to that place is effective. For instance, Hierapolis and Göreme archaeological sites, situated close to city centres, serve as prime examples of this phenomenon, attracting a high number of visitors due to their convenient accessibility. Another significant determinant indicated by the study is coastal proximity. The findings revealed that an archaeological site near the sea tends to generate higher visitor interest than other sites, as in the study of Cuccia and Rizzo (2011). Some exceptional places such as Phaselis, Olympos, and Patara archaeological sites allow swimming and visiting the archaeological sites simultaneously.
The study also highlighted the significant negative effect of spatial dependence on visitor numbers of archaeological sites near each other. The negative effect of spatial dependence was also supported by Patuelli’s finding on the contiguity relationship (Patuelli et al., 2013). Although archaeological sites are concentrated in four regions (Eastern Antalya, Western Antalya, Western Anatolia, and Inner Anatolia/ Cappadocia), the findings of the spatial dependence tests suggested that increased tourist activity at one site leads to a decrease in visitor numbers at neighbouring sites. This phenomenon underscores the severity of incorporating the spatial dependence; however, contrary to the notion of proximity to other tourist attractions promote visitor numbers, which were suggested in previous studies (Magablih and Al-Shorman, 2003; Oh et al., 2019). Having an on-site archaeological museum was found to not have a significant effect on visits in the study. This result contradicts the conclusion of Carey et al. (2012) suggested in their study that the existence of the museum increases the number of tourists. It is presumed that visitors do not visit the site to see the museum, but after visiting the site, they also visit the museum as they have already come there. The reason why the archaeological sites inside the national parks also do not affect the number of visitors is probably due to the tight restrictions in these areas to protect archaeological remains and wildlife. In addition to having an on-site archaeological museum, the monthly temperatures, income per capita, and population were also found to be not significant on the number of visitors, contrary to studies that claim the opposite (Abuamoud et al., 2014; Huang et al., 2012; Ridderstaat et al., 2014).
This study contributes to the literature regarding employing economic, demographic factors, and spatial relations between the sites. In this manner, to provide a holistic understanding, the study focuses on all of the archaeological site visits in 2019 rather than focusing on a single area. Moreover, while the effect of being on the WHL is mainly discussed in the literature, in this study, besides the effect of being on the WHL, other factors were also examined. The statistical results present novel findings and suggestions to the discussions on the factors affecting tourist visits to the archaeological sites. In future research, it will be essential to examine the impact of advertisement, novelty, and recognition on visitor numbers of archaeological sites. Understanding the relationship between these factors and visitor engagement can provide valuable knowledge for site management and promotional strategies. Additionally, evaluating the sociocultural significance of the region and the effectiveness of environmental design projects in enhancing the visitor experience at the heritage sites are also suggested for further investigation. Moreover, in order to understand whether being a WHS increases the number of visitors, the data of WHS before and after inscribing in the List can be compared with panel data. The error terms in this study indicate that there are also other non-quantifiable factors affecting the number of visitors. Therefore, statistical and qualitative methods should be developed to understand a site’s features that attract tourists.
ABUAMOUD, I. N., LIBBIN, J., GREEN, J. and ALROUSAN, R. (2014), ‘Factors affecting the willingness of tourists to visit cultural heritage sites in Jordan’, Journal of Heritage Tourism, 9 (2), pp. 148–165. https://doi.org/10.1080/1743873X.2013.874429
AHUNBAY, Z. (2010), ‘Conservation Problems at Archaeological Sites an Assessment from theoretical and Legal Standpoint’, Turkish Academy of Sciences Journal of Cultural Inventory, 8, pp. 103–118, https://dergipark.org.tr/tr/pub/tubaked/issue/57432/814185 [accessed on: 21.06.2023].
ALLKJA, L. and DHRAMI, K. (2021), ‘Territorial governance of cultural heritage through spatial planning in Albania and Kosovo’, European Spatial Research and Policy, 28 (2), pp. 43–62. https://doi.org/10.18778/1231-1952.28.2.03
ANSELIN, L. (1988a), ‘Lagrange multiplier test diagnostics for spatial dependence and spatial heterogeneity’, Geographical Analysis, 20 (1), pp. 1–17. https://doi.org/10.1111/j.1538-4632.1988.tb00159.x
ANSELIN, L. (1988b), Spatial econometrics: methods and models, Springer Science & Business Media. https://doi.org/10.1007/978-94-015-7799-1
ANSELIN, L. (2001), ‘Rao’s score test in spatial econometrics’, Journal of Statistical Planning and Inference, 97 (1), pp. 113–139. https://doi.org/10.1016/S0378-3758(00)00349-9
ANSELIN, L., BERA, A. K., FLORAX, R. and YOON, M. J. (1996), ‘Simple diagnostic tests for spatial dependence’, Regional Science and Urban Economics, 26 (1), pp. 77–104. https://doi.org/10.1016/0166-0462(95)02111-6
ANSELIN, L. and FLORAX, R. J. G. M. (1995), ‘Small sample properties of tests for spatial dependence in regression models: Some further results’, [in:] New directions in spatial econometrics, pp. 21–74, Springer. https://doi.org/10.1007/978-3-642-79877-1_2
ANSELIN, L. and MORENO, R. (2003), ‘Properties of tests for spatial error components’, Regional Science and Urban Economics, 33 (5), pp. 595–618. https://doi.org/10.1016/S0166-0462(03)00008-5
ANSELIN, L. and REY, S. (1991), ‘Properties of tests for spatial dependence in linear regression models’, Geographical Analysis, 23 (2), pp. 112–131. https://doi.org/10.1111/j.1538-4632.1991.tb00228.x
ASSUMMA, V., BOTTERO, M., CASSATELLA, C. and COTELLA, G. (2022), ‘Planning sustainable tourism in UNESCO wine regions: The case of the Langhe-Roero and Monferrato area’, European Spatial Research and Policy, 29 (2). https://doi.org/10.18778/1231-1952.29.2.06
BIVAND, R., BERNAT, A., CARVALHO, M. et al. (2013), ‘The spdep package’, Comprehensive R Archive Network, Version, pp. 5–83, https://www.yumpu.com/en/document/view/9283478/package-spdep-the-comprehensive-r-archive-network [accessed on: 21.06.2023].
BURRIDGE, P. and FINGLETON, B. (2010), ‚Bootstrap Inference in Spatial Econometrics: the J-test’, Spatial Economic Analysis, 5 (1), pp. 93−119. https://doi.org/10.1080/17421770903511346
CAREY, S., DAVIDSON, L. and SAHLI, M. (2012), ‘Capital city museums and tourism flows: An empirical study of the museum of New Zealand Te Papa Tongarewa’, International Journal of Tourism Research, 15 (6), pp. 554–569. https://doi.org/10.1002/jtr.1874
CELLINI, R. (2011), ‘Is UNESCO recognition effective in fostering tourism? A comment on Yang, Lin and Han’, Tourism Management, 32 (2), pp. 452–454. https://doi.org/10.1016/j.tourman.2010.01.018
ÇOKİŞLER, N. (2022), ‘The Relationship between Cultural Heritage and Tourism in Turkey: A Historical Perspective (1923-2000)’, Journal of Gastronomy, Hospitality and Travel (Online), 5 (3), pp. 1179–1188. https://doi.org/10.33083/joghat.2022.193
CUCCIA, T., GUCCIO, C. and RIZZO, I. (2016), ‘The effects of UNESCO World Heritage List inscription on tourism destinations performance in Italian regions’, Economic Modelling, 53, pp. 494–508. https://doi.org/10.1016/j.econmod.2015.10.049
CUCCIA, T. and RIZZO, I. (2011), ‘Tourism seasonality in cultural destinations: Empirical evidence from Sicily’, Tourism Management, 32 (3), pp. 589–595. https://doi.org/https://doi.org/10.1016/j.tourman.2010.05.008
DÖSİMM (2019), Republic of Türkiye Ministry of Culture and Tourism, Döner Sermaye İşletmesi Merkez Müdürlüğü Müze ve Örenyeri 2019 Yılı Toplam Istatistikleri [Museum and Archaeological Sites 2019 Total Statistics], [Online], https://dosim.ktb.gov.tr/; http://www.dosim.gov.tr/muze-istatistikleri [accessed on: 29.06.2020].
DURAN, H. E. and GAJEWSKI, P. (2023), ‘State-level Taylor rule and monetary policy stress’, Equilibrium. Quarterly Journal of Economics and Economic Policy, 18 (1), pp. 89–120. https://doi.org/10.24136/eq.2023.003
ELHORST, J. P. (2014), Spatial Econometrics. From Cross-sectional Data to Spatial Panels, Berlin and Heidelberg: Springer. https://doi.org/10.1007/978-3-642-40340-8
ERES, Z. and ÖZDOĞAN, M. (2018), ‘Archaeological Heritage in the Context of Cultural Tourism: An Assessment of Arcahaeological Sites in Turkey’, [in:] K. PIESKER, B. AKAN, D. GÖÇMEN and S. TEZER ALTAY (eds.), Miras 4 – Heritage in Context, 2, pp. 7–47, Ege Publishing.
GOOGLE MAPS (n.d.) Costsite, CoastCity, and Distance Data of Turkish Cities, https://www.google.com/maps/ [accessed on: 29.06.2020].
GOOGLE MAPS (2023), Location of the Archaeological Sites in Turkey, https://goo.gl/maps/KDdkUNZTvd8mqXga8 [accessed on: 19.06.2023].
HERRERA GOMEZ, M., MUR LACAMBRA, J. and RUIZ MARIN, M. (2012), ‘Selecting the Most Adequate Spatial Weighting Matrix:A Study on Criteria’, MPRA Working Paper, https://mpra.ub.uni-muenchen.de/73700/1/MPRA_paper_73700.pdf [accessed on: 21.06.2023].
HUANG, C.-H., TSAUR, J.-R. and YANG, C.-H. (2012), ‘Does world heritage list really induce more tourists? Evidence from Macau’, Tourism Management, 33 (6), pp. 1450–1457. https://doi.org/10.1016/j.tourman.2012.01.014
KARABULUT, G., BILGIN, M. H., DEMIR, E., and DOKER, A. C. (2020), ‘How pandemics affect tourism: International evidence’, Annals of Tourism Research, 84, 102991. https://doi.org/10.1016/j.annals.2020.102991
LESAGE, J. P. and PACE, R. K. (2010), ‘Spatial econometric models’, [in:] Handbook of applied spatial analysis, pp. 355–376, Springer. https://doi.org/10.1007/978-3-642-03647-7_18
LIANG, H. and ZHANG, Q. (2022), ‘Do social media data indicate visits to tourist attractions? A case study of Shanghai, China’, Open House International, 47 (1), pp. 17–35. https://doi.org/10.1108/OHI-05-2021-0110
MAGABLIH, K. and Al-SHORMAN, A. (2003), ‘Management and Development of Tourist Sites in Jordan Using Geographic Information System’, Information Technology & Tourism, 6 (4), pp. 287–295. https://doi.org/10.3727/1098305032781166
MCT (n.d.), Republic of Türkiye Ministry of Culture and Tourism. Museums in Turkiye, https://muze.gov.tr/muzeler [accessed on: 29.06.2020].
MCT (2018), Republic of Turkiye Ministry of Culture and Tourism. The Year of Troya, https://canakkale.ktb.gov.tr/TR-200711/2018-troia-yili.html#:~:text=2018 [accessed on: 21.06.2023].
MCT (2019), Republic of Turkiye Ministry of Culture and Tourism. The Year of Göbeklitepe, https://www.kulturportali.gov.tr/portal/2019-gobeklitepe-yili [accessed on: 21.06.2023].
MCT (2020), Republic of Türkiye Ministry of Culture and Tourism. The Year of Patara, https://basin.ktb.gov.tr/TR-255214/2020-patara-yili-ilan-edildi.html#:~:text=2020%2C [accessed on: 21.06.2023].
MCT (2023a), Republic of Türkiye Ministry of Culture and Tourism. Statistics of registered areas in Türkiye, https://kvmgm.ktb.gov.tr/TR-44973/turkiye-geneli-sit-alanlari-istatistikleri.html [accessed on: 21.06.2023].
MCT (2023b), Republic of Türkiye The Ministry of Culture and Tourism. Our activities, https://kvmgm.ktb.gov.tr/TR-43251/faaliyetler.html [accessed on: 21.06.2023].
MEJJAD, N., ROSSI, A. and PAVEL, A. B. (2022), ‘The coastal tourism industry in the Mediterranean: A critical review of the socio-economic and environmental pressures & impacts’, Tourism Management Perspectives, 44, 101007. http://doi.org/10.1016/j.tmp.2022.101007
MESKELL, L. (2018), A future in ruins: UNESCO, world heritage, and the dream of peace, Oxford University Press.
MILLO, G. and PIRAS, G. (2012), ‘splm: Spatial Panel Data Models in R.’, Journal of Statistical Software, 47 (1), pp. 1–38. https://doi.org/10.18637/jss.v047.i01
MILLO, G., PIRAS, G. and BIVAND, R. (2018), ‘Package ‘splm’’, CRAN, pp. 1–27. https://cran.r-project.org/web/packages/splm/splm.pdf [accessed on: 21.06.2023].
MORAN, P. A. P. (1950), ‘A test for the serial independence of residuals’, Biometrika, 37 (1/2), pp. 178–181. https://doi.org/10.1093/biomet/37.1-2.178
NAUDÉ, W. A. and SAAYMAN, A. (2005), ‘Determinants of tourist arrivals in Africa: a panel data regression analysis’, Tourism Economics, 11 (3), pp. 365–391. https://doi.org/10.5367/000000005774352962
NEPAL, R., INDRA Al IRSYAD, M. and NEPAL, S. K. (2019), ‘Tourist arrivals, energy consumption and pollutant emissions in a developing economy–implications for sustainable tourism’, Tourism Management, 72, pp. 145–154. https://doi.org/10.1016/j.tourman.2018.08.025
NEWEY, W. K. and WEST, K. D. (1987), ‘A Simple, Positive Semi-Definite, Heteroskedasticity and Autocorrelation Consistent Covariance Matrix’, Econometrica, 55 (3), pp. 703–708. https://doi.org/10.2307/1913610
OH, M., KIM, S., CHOI, Y. and PRATT, S. (2019), ‘Examination of benefits sought by hiking tourists: a comparison of impact-range performance analysis and impact asymmetry analysis’, Asia Pacific Journal of Tourism Research, 24 (8), pp. 850–864. https://doi.org/10.1080/10941665.2019.1635501
PATUELLI, R., MUSSONI, M. and CANDELA, G. (2013), ‘The effects of World Heritage Sites on domestic tourism: a spatial interaction model for Italy’, Journal of Geographical Systems, 15 (3), pp. 369–402. https://doi.org/10.1007/s10109-013-0184-5
PEBESMA, E. and BIVAND, R. S. (2005), ‘S classes and methods for spatial data: the sp package’, R News, 5 (2), pp. 9–13, https://cran.r-project.org/web/packages/sp/vignettes/intro_sp.pdf [accessed on: 21.06.2023].
REPUBLIC of TÜRKİYE MINISTRY of AGRICULTURE and FORESTRY (n.d.), List of National Parks in Turkey, https://www.tarimorman.gov.tr/DKMP/Menu/27/Milli-Parklar; https://www.tarimorman.gov.tr/ [accessed on: 29.06.2020]
REY, S. J. (2001), ‘Spatial empirics for economic growth and convergence’, Geographical Analysis, 33 (3), pp. 195–214. https://doi.org/10.1111/j.1538-4632.2001.tb00444.x
REY, S. J. and MONTOURI, B. D. (1999), ‘US Regional Income Convergence: A Spatial Econometric Perspective’, Regional Studies, 33 (2), pp. 143−156. https://doi.org/10.1080/00343409950122945
RIDDERSTAAT, J., ODUBER, M., CROES, R., NIJKAMP, P. and MARTENS, P. (2014), ‘Impacts of seasonal patterns of climate on recurrent fluctuations in tourism demand: Evidence from Aruba’, Tourism Management, 41, pp. 245–256. https://doi.org/10.1016/j.tourman.2013.09.005
SELCUK, O., KARAKAS, H., CIZEL, B. and IPEKCI CETIN, E. (2023), ‘How does tourism affect protected areas?: A multi-criteria decision making application in UNESCO natural heritage sites’, Natural Hazards, 117 (2), pp. 1923–1944. https://doi.org/10.1007/s11069-023-05934-x
SU, Y.-W. and LIN, H.-L. (2014), ‘Analysis of international tourist arrivals worldwide: The role of world heritage sites’, Tourism Management, 40, pp. 46–58. https://doi.org/10.1016/j.tourman.2013.04.005
TAN, N., ANWAR, S. and JIANG, W. (2023), ‘Intangible cultural heritage listing and tourism growth in China’, Journal of Tourism and Cultural Change, 21 (2), pp. 188–206. https://doi.org/10.1080/14766825.2022.2068373
TUİK (2019), Population and Income per Capita Statistics of Turkey, https://biruni.tuik.gov.tr/bolgeselistatistik/sorguSayfa.do?target=degisken; www.tuik.gov.tr [accessed on: 29.06.2020].
TURKISH STATE METEOROLOGICAL SERVICE (n.d.), 2019 Air Temperature Data of the Provinces in Turkey, https://www.mgm.gov.tr/veridegerlendirme/il-ve-ilceler-istatistik.aspx?k=undefined&m=ISTANBUL; https://www.mgm.gov.tr/ [accessed on: 29.06.2020].
TÜRKOĞLU, İ. (2020), ‘The Importance of Cultural Heritage in Sustainable Development’, Journal, 10 (20), pp. 117–143. https://doi.org/10.33207/trkede.692194
ULUSAN, E. (2023), ‘Conceptual Framework for Cultural Heritage Management Planning and the Analysis of Related Graduate Thesis Studies’, Planlama, 33 (1), pp. 40–57. https://doi.org/10.14744/planlama.2022.93276
ULUSAN, E. and ERSOY, M. (2019), ‘FINANCING THE PRESERVATION OF HISTORICAL BUILDINGS IN TURKEY’, METU Journal of the Faculty of Architecture, 35 (2), pp. 251–267. https://doi.org/10.4305/METU.JFA.2018.1.4
ULUSAN, E. and YILDIRIM, E. (2016), ‘For a «Balanced, Representative and Credible List»: an Evaluatıon of Turkey’s World Herıtage Candidates’, Idealkent: Journal of Urban Studies, 7 (19), pp. 444–473, https://dergipark.org.tr/en/pub/idealkent/issue/36795/419445 [accessed on: 21.06.2023].
UNESCO (1972), ‘Convention Concerning the Protection of the World Cultural and Natural Heritage’, UNESCO, https://whc.unesco.org/archive/convention-en.pdf [accessed on: 21.06.2023].
UNESCO (2021), The World Heritage Convention, https://whc.unesco.org/en/convention/ [accessed on: 29.06.2021].
UNESCO (2023a), State parties: China, https://whc.unesco.org/en/statesparties/cn; https://www.unesco.org/en [accessed on: 21.06.2023].
UNESCO (2023b), State parties: Italy, https://whc.unesco.org/en/statesparties/it; https://www.unesco.org/en [accessed on: 21.06.2023].
UNESCO (2023c), State parties: Turkey, https://whc.unesco.org/en/statesparties/tr; https://www.unesco.org/en [accessed on: 21.06.2023].
UNESCO (2023d), Tentative List, https://whc.unesco.org/en/tentativelists/?action=listtentative&state=tr&order=states; https://www.unesco.org/en [accessed on: 21.06.2023].
WHITE, H. (1980), ‘A heteroskedasticity-consistent covariance matrix estimator and a direct test for heteroskedasticity’, Econometrica: Journal of the Econometric Society, 48 (4), pp. 817–838. https://doi.org/10.2307/1912934
WINTER, T. (2015), ‘Heritage diplomacy’, International Journal of Heritage Studies, 21 (10), pp. 997–1015. https://doi.org/10.1080/13527258.2015.1041412
YANG, C.-H. and LIN, H.-L. (2011), ‘Is UNESCO recognition effective in fostering tourism? A comment on Yang, Lin and Han: Reply’, Tourism Management, 32 (2), pp. 455–456. https://doi.org/10.1016/j.tourman.2010.03.011
YANG, C.-H., LIN, H.-L. and HAN, C.-C. (2010), ‘Analysis of international tourist arrivals in China: The role of World Heritage Sites’, Tourism Management, 31 (6), pp. 827–837. https://doi.org/10.1016/j.tourman.2009.08.008
| Province | Nr | Archaeological Site | Visitor Number |
| ADANA | 1 | ŞAR KOMANA ARCHAEOLOGICAL SITE | 650 |
| 2 | ANAVARZA ARCHAEOLOGICAL SITE | 15,329 | |
| ADIYAMAN | 3 | PIRIN (PERRE) ARCHAEOLOGICAL SITE | 21,939 |
| 4 | SOFRAZ TOMB | 1,637 | |
| 5 | NEMRUT ARCHAEOLOGICAL SITE | 46,206 | |
| AKSARAY | 6 | IHLARA VALLEY ARCHAEOLOGICAL SITE | 566,917 |
| 7 | SARATLI KIRKGÖZ UNDERGROUND CITY | 56,923 | |
| 8 | ST. MERCURIUS UNDERGROUND CITY | 35,144 | |
| 9 | MANASTIR VALLEY ARCHAEOLOGICAL SITE | 15,321 | |
| ANKARA | 10 | ROMAN BATH ARCHAEOLOGICAL SITE | 10,103 |
| 11 | GORDION MUSEUM AND TUMULUS ARCHAEOLOGICAL SITE | 36,011 | |
| ANTALYA | 12 | ASPENDOS ARCHAEOLOGICAL SITE | 320,856 |
| 13 | PERGE ARCHAEOLOGICAL SITE | 116,426 | |
| 14 | PHASELIS ARCHAEOLOGICAL SITE | 237,962 | |
| 15 | OLYMPOS ARCHAEOLOGICAL SITE | 251,085 | |
| 16 | PATARA ARCHAEOLOGICAL SITE | 193,214 | |
| 17 | XANTHOS ARCHAEOLOGICAL SITE | 35,573 | |
| 18 | KARAIN CAVE | 28,105 | |
| 19 | MYRA ARCHAEOLOGICAL SITE | 274,605 | |
| 20 | TERMESSOS ARCHAEOLOGICAL SITE | 43,750 | |
| 21 | SIMENA ARCHAEOLOGICAL SITE | 47,957 | |
| 22 | ALANYA CASTLE | 223,209 | |
| 23 | SIDE THEATRE | 231,553 | |
| 24 | ALANYA SYEDRA ARCHAEOLOGICAL SITE | 9,464 | |
| 25 | ANDRIAKE ARCHAEOLOGICAL SITE AND LYCIAN CIVILIZATIONS MUSEUM | 19,424 | |
| 26 | LYMRA ARCHAEOLOGICAL SITE | 13,413 | |
| AYDIN | 27 | NYSA (SULTANHİSAR) ARCHAEOLOGICAL SITE | 8,672 |
| 28 | ALINDA ARCHAEOLOGICAL SITE | 3,310 | |
| 29 | MAGNESİA ARCHAEOLOGICAL SITE | 5,719 | |
| 30 | ALABANDA ARCHAEOLOGICAL SITE | 2,796 | |
| 31 | AFRODISIAS MUSEUM AND ARCHAEOLOGICAL SITE | 92,400 | |
| 32 | MILET MUSEUM AND ARCHAEOLOGICAL SITE | 48,645 | |
| 33 | DIDYMA ARCHAEOLOGICAL SITE | 82,414 | |
| 34 | PRIENE ARCHAEOLOGICAL SITE | 29,181 | |
| BİTLİS | 35 | SELÇUKLU CEMETERY ARCHAEOLOGICAL SITE | 68,161 |
| BURDUR | 36 | SAGALASSOS ARCHAEOLOGICAL SITE | 77,645 |
| ÇANAKKALE | 37 | TROIA ARCHAEOLOGICAL SITE | 583,491 |
| 38 | ASSOS ARCHAEOLOGICAL SITE | 142,109 | |
| 39 | ALEXANDRIA TROIAS ARCHAEOLOGICAL SITE | 11,721 | |
| 40 | APOLLON SMINTHEION ARCHAEOLOGICAL SITE | 10,460 | |
| ÇORUM | 41 | ALACAHÖYÜK MUSEUM AND ARCHAEOLOGICAL SITE | 40,955 |
| 42 | BOĞAZKÖY ARCHAEOLOGICAL SITE | 40,832 | |
| DENİZLİ | 43 | HIERAPOLIS (PAMUKKALE) ARCHAEOLOGICAL SITE | 2,557,868 |
| 44 | LAODIKEIA ARCHAEOLOGICAL SITE | 86,064 | |
| ERZURUM | 45 | ERZURUM CASTLE | 75,178 |
| ESKİŞEHİR | 46 | PESSINUS ARCHAEOLOGICAL SITE | 5,789 |
| 47 | MIDAS (YAZILIKAYA) ARCHAEOLOGICAL SITE | 8,139 | |
| GAZİANTEP | 48 | YESEMEK ARCHAEOLOGICAL SITE | 13,661 |
| HATAY | 49 | ÇEVLİK ARCHAEOLOGICAL SITE | 53,804 |
| ISPARTA | 50 | ANTIOCHEIA ARCHAEOLOGICAL SITE | 21,312 |
| İZMİR | 51 | AGORA ARCHAEOLOGICAL SITE | 67,179 |
| 52 | BERGAMA ACROPOLIS ARCHAEOLOGICAL SITE | 203,984 | |
| 53 | BERGAMA ASCLEPEION ARCHAEOLOGICAL SITE | 119,434 | |
| 54 | BERGAMA RED BASILICA ARCHAEOLOGICAL SITE | 42,814 | |
| 55 | EPHESUS ARCHAEOLOGICAL SITE | 1,855,694 | |
| 56 | EPHESUS TERRACE HOUSES | 79,334 | |
| 57 | ST. JEAN ARCHAEOLOGICAL SITE | 165,151 | |
| 58 | TEOS ARCHAEOLOGICAL SITE | 29,950 | |
| 59 | METROPOLIS ARCHAEOLOGICAL SITE | 11,557 | |
| KARS | 60 | ANI ARCHAEOLOGICAL SITE | 175,968 |
| KAYSERİ | 61 | YEŞİLHİSAR SOĞANLI ARCHAEOLOGICAL SITE | 16,148 |
| 62 | KÜLTEPE ARCHAEOLOGICAL SITE | 39,212 | |
| KIRŞEHİR | 63 | MUCUR UNDERGROUND CITY | 7,469 |
| KONYA | 64 | ÇATALHÖYÜK ARCHAEOLOGICAL SITE | 30,964 |
| KÜTAHYA | 65 | AİZONAİ ARCHAEOLOGICAL SITE | 30,087 |
| MALATYA | 66 | ASLANTEPE ARCHAEOLOGICAL SITE | 30,162 |
| MANİSA | 67 | SARDES ARCHAEOLOGICAL SITE AND ARTEMIS TEMPLE | 87,968 |
| 68 | AIGAI ARCHAEOLOGICAL SITE | 6,791 | |
| 69 | AKHİSAR MUSEUM AND AKHİSAR TEPE TOMB | 18,084 | |
| 70 | ALAŞEHİR ARCHAEOLOGICAL SITE | 23,283 | |
| MERSİN | 71 | KIZ CASTLE | 47,829 |
| 72 | KANLI DİVANE ARCHAEOLOGICAL SITE | 37,112 | |
| 73 | GÖZNE CASTLE | 9,510 | |
| 74 | SİLİFKE CENNET CEHENNEM ARCHAEOLOGICAL SITE | 87,636 | |
| 75 | SİLİFKE AYATEKLA ARCHAEOLOGICAL SITE | 5,065 | |
| 76 | SİLİFKE UZUNCABURÇ ARCHAEOLOGICAL SITE | 13,255 | |
| 77 | SİLİFKE ALAHAN MONASTERY | 10,312 | |
| 78 | TARSUS ST. PAUL WELL | 29,536 | |
| 79 | ANAMORIUM ARCHAEOLOGICAL SITE | 26,216 | |
| 80 | SİLİFKE ASTIM CAVE | 170,722 | |
| MUĞLA | 81 | LAGINA ARCHAEOLOGICAL SITE | 6,644 |
| 82 | SEDİR ISLAND (KEDRAI) ARCHAEOLOGICAL SITE | 189,093 | |
| 83 | STRATONIKEIA ARCHAEOLOGICAL SITE | 24,518 | |
| 84 | BODRUM MAUSOLEUM | 29,986 | |
| 85 | BODRUM ANCIENT THEATRE | 13,673 | |
| 86 | FETHİYE GEMİLE ISLAND | 26,958 | |
| 87 | FETHİYE LETOON ARCHAEOLOGICAL SITE | 14,883 | |
| 88 | FETHİYE PINARA ARCHAEOLOGICAL SITE | 3,807 | |
| 89 | FETHİYE TLOS ARCHAEOLOGICAL SITE | 33,309 | |
| 90 | FETHİYE AMINTAS ROCK TOMB | 38,656 | |
| 91 | FETHİYE KAYAKÖY ARCHAEOLOGICAL SITE | 93,405 | |
| 92 | FETHİYE KAUNOS ARCHAEOLOGICAL SITE AND ROCK TOMBS | 54,235 | |
| 93 | FETHİYE KADYANDA ARCHAEOLOGICAL SITE | 6,313 | |
| 94 | MİLAS IASSOS ARCHAEOLOGICAL SITE | 2,210 | |
| 95 | MİLAS LABRANDA ARCHAEOLOGICAL SITE | 2,599 | |
| 96 | MİLAS BEÇİN CASTLE AND ARCHAEOLOGICAL SITE | 5,395 | |
| 97 | MİLAS EUROMOS ARCHAEOLOGICAL SITE | 4,839 | |
| 98 | MARMARİS KNIDOS ARCHAEOLOGICAL SITE | 56,746 | |
| NEVŞEHİR | 99 | DERİNKUYU UNDERGROUND CITY | 456,369 |
| 100 | KAYMAKLI UNDERGROUND CITY | 632,970 | |
| 101 | ZELVE-PAŞABAĞLAR ARCHAEOLOGICAL SITE | 279,296 | |
| 102 | GÖREME ARCHAEOLOGICAL SITE | 1,403,444 | |
| 103 | KARANLIK CHURCH | 121,978 | |
| 104 | ÖZKONAK UNDERGROUND CITY | 209,319 | |
| NEVŞEHİR cont. |
105 | TATLARİN UNDERGROUND CITY | 6,294 |
| 106 | GÜLŞEHİR ST. JEAN CHURCH | 8,905 | |
| 107 | EL NAZAR CHURCH | 9,898 | |
| 108 | GÜLŞEHİR AÇIK SARAY ARCHAEOLOGICAL SITE | 10,299 | |
| 109 | MAZI UNDERGROUND CITY | 11,830 | |
| NİĞDE | 110 | GÜMÜŞLER ARCHAEOLOGICAL SITE | 24,606 |
| 111 | ANDAVAL ARCHAEOLOGICAL SITE | 638 | |
| OSMANİYE | 112 | KARATEPE ASLANTAŞ MUSEUM AND ARCHAEOLOGICAL SITE | 22,150 |
| ŞANLIURFA | 113 | HARRAN ARCHAEOLOGICAL SITE | 78,906 |
| 114 | GÖBEKLİTEPE ARCHAEOLOGICAL SITE | 400,195 | |
| TRABZON | 115 | SÜMELA MONASTERY | 201,474 |
| VAN | 116 | VAN CASTLE | 60,581 |
| ZONGULDAK | 117 | CEHENNEMAĞZI CAVES | 34,898 |
| 1 | 2 | 3 | 5 | 6 | 7 | 8 | 9 | 10 | ||
| Cost-City | Distance | Cost-Site | IPC | Museum | Population | NatPark | Temperature | WHL | ||
| 1 | CostCity | 1.00 | 0.19 | 0.66 | 0.53 | 0.03 | 0.38 | -0.08 | 0.49 | -0.09 |
| 2 | Distance | 0.19 | 1.00 | 0.21 | 0.09 | 0.18 | 0.10 | -0.01 | 0.03 | 0.08 |
| 3 | CostSite | 0.66 | 0.21 | 1.00 | 0.41 | 0.11 | 0.22 | 0.01 | 0.26 | -0.08 |
| 5 | IPC | 0.53 | 0.09 | 0.41 | 1.00 | 0.13 | 0.66 | -0.06 | 0.25 | 0.06 |
| 6 | Museum | 0.03 | 0.18 | 0.11 | 0.13 | 1.00 | 0.04 | 0.22 | 0.05 | 0.06 |
| 7 | Population | 0.38 | 0.10 | 0.22 | 0.66 | 0.04 | 1.00 | -0.10 | 0.49 | 0.19 |
| 8 | NatPark | -0.08 | -0.01 | 0.01 | -0.06 | 0.22 | -0.10 | 1.00 | -0.11 | 0.14 |
| 9 | Temperature | 0.49 | 0.03 | 0.26 | 0.25 | 0.05 | 0.49 | -0.11 | 1.00 | 0.02 |
| 10 | WHL | -0.09 | 0.08 | -0.08 | 0.06 | 0.06 | 0.19 | 0.14 | 0.02 | 1.00 |