

Abstract. Urban parks are significant elements that improve the quality of life in built-up areas. This research aims to identify the most attractive park in Lodz, Poland, using aset of assessment indicators. In our opinion, the decision-making process in assessing the attractiveness of urban parks may be assisted by Multiple Criteria Decision Analysis (MCDA). Two methods were chosen from the MCDA group, namely the Analytic Hierarchy Process (AHP) and the Technique for Order Preference by Similarity to Ideal Solution (TOPSIS). The research shows that the proposed methods reveal which park needs support and calls for investment.
Key words: urban parks; park attractiveness; urban amenities; the AHP and TOPSIS methods.
The structure of acity is composed of architectural and urbanistic elements such as buildings, streets, and squares, accompanied by anetwork of appropriately designed and properly developed greenery. This green infrastructure is crucial for landscape aesthetics and for living standards. Green areas in cities contribute to the market value of real estate. The more attractive green spaces there are, the more investors are willing to locate their projects nearby. The specific and unique recreational and landscape value of parks and the increasing awareness of the advantages of green areas affect the prices of flats and business premises in the neighbourhood (Oleksiejuk and Jankowska, 2007; Czembrowski and Kronenberg, 2016).
Parks are natural components of cities, and they offer visitors contact with relatively wild nature without travel expenditure. Organised green spaces attract residents and visitors, offering them aprofessionally managed and diversified selection of plants, walking and cycling paths, natural routes, and elements of small architecture. Therefore, parks are the amenities of acity. Park equipment determines its attractiveness, since the attractiveness of apark depends on the facilities available and accessible to park visitors. As aresult, its value depends on the sum or the subjective result of amenities both inside and outside it (Fig. 1).
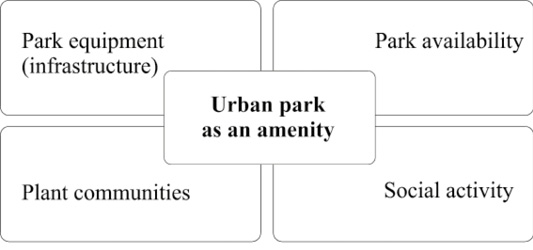
Fig. 1. Urban park as an amenity
Source: own work based on the conducted research.
The main purpose of the research is to assess the attractiveness of urban parks in the city of Lodz using two research methods: AHP – the Analytic Hierarchy Process (Saaty, 1980; Saaty, 2007; Saaty, 2008; Saaty and Vargas, 2012) and TOPSIS – the Technique for Order Preference by Similarity to Ideal Solution (Hwang and Yoon, 1981).
The expected results are as follows: firstly, assessments make it possible to identify the attractiveness of city parks. Secondly, both research methods may be used to assess other urban amenities (not only parks), and the key determinants of city attractiveness are specified. Thirdly, the research should be astimulus for local authorities to develop the attractiveness of city parks and to present the main directions of the desired changes.
In addition to the application dimension, the paper analyses the differences between the two Multiple Criteria Decision Analysis (MCDA) methods. Nine parks were chosen, and a group of experts was asked to give their opinions on the amenities. To assess the attractiveness of the selected city parks it was necessary to examine them and find the same data set in all the considered parks. This procedure made it possible to identify the amenities which were crucial for increasing the attractiveness of city parks. In our opinion, the elements of the city parks’ space that were recognised by the expert group as being the most appropriate and necessary should help local authorities manage green infrastructure.
Economics identifies a number of elements that may be decisive for the attractiveness of an urban space. Urban amenities are features or functions that increase the attractiveness and value of residential premises in urban areas. From the economic point of view, urban amenities are goods that have a specific location in space and that make human life easier, more pleasant, or more comfortable. Consequently, attractiveness may be defined as a set of advantages and better conditions for investment than in other locations. In other words, attractiveness is the ability to find investors for a given place. Hence, investment attractiveness is closely related to the competitiveness of a neighbourhood, i.e., the ability to achieve success in the economic competition. A practical metric of a location’s attractiveness is the average price per square metre of an apartment by location, or “location rent” – after adjusting the price to other variables, such as the area, level, building type and condition, additional equipment, etc. (Czembrowski et al., 2016; Xiao et al., 2016; Pietrzyk-Kaszyńska et al., 2017). To sum up, urban amenities have a significant impact on family decisions regarding the location of apartments and on the assessment of the attractiveness of various parts of cities (Sokołowicz, 2017). According to the discourse in the subject-matter literature, amenities include (Glaeser et al., 2001, 2003; Markusen, 2006):
The above criteria identify crucial urban amenities, i.e., green spaces or organised open spaces needed to develop leisure, recreational, and recovery functions. Thus, in spatial planning practice, urban parks should be perceived as necessary amenities and an attractive offer of the city.
Urban parks are organised and designed open green spaces covered with plants that are intentionally established, developed, maintained, and protected. They are necessary for the environmental and economic potential of cities, increasing their attractiveness and creating their image. The role of parks in cities is especially relevant in the context of ecosystem services, understood as a chain of relationships between an ecosystem and human wellbeing, where a service is seen as a “bridge” (de Groot et al., 2010). Urban parks are flagships or symbols of cities and sources of identity. Well-known examples of iconic urban green spaces are the High Line in New York, Central Park in New York, Hyde Park in London, Park Guell in Barcelona, Park Rio in Madrid, Szczytnicki Park with Centennial Hall in Wroclaw, Oliwa Park in Gdansk, Royal Łazienki Park in Warsaw, and Saski Garden in Warsaw.
In social and economic terms, parks are public realm, understood as “a common good that is used collectively and is purposefully shaped by humans in accordance with social principles and values intended to meet the needs of local communities (…). Its public character is derived from it being used collectively” (Public Space Charter, 2009). Parks are the crucial elements of the entire urban greenery system since their main goal is to ensure the availability of nature for people in the most accessible and suitable way. Moreover, they provide a platform for interpersonal relationships and social interactions offering entertainment, sport, outdoor activities, and many other activities undertaken to ensure personal development. A resident in a city can relax in a park, away from the dense urban life, in a place that is best for leisure. Therefore, proper park development is an important task (Tołwiński, 1963; Wróblewski and Kroc, 2022).
According to Zachariasz (2006), urban parks “are intended for a large group of diverse audiences, as well as visitors to the city. Parks should protect unique historical, cultural, and natural areas in cities. These areas of active and passive recreation use local environmental advantages to the fullest, in particular, all kinds of water-related elements. They should offer an attractive landscape and diverse specialist equipment for different social groups (using various criteria, such as age, interests, or being fit). They also host elements and places of interest that create their identity, e.g., squares and entrance gates, fountains, gazebos, and specialist flower gardens, e.g., rosaria or flowerbeds. Parks are usually equipped with playgrounds for children, picnic grounds, meeting points, space for events or fairs (usually big lawns, sometimes with a stage or plaza where such a stage can be built), toilets, and parking lots”.
The first group of factors related to a location’s attractiveness is park accessibility, i.e. how one can reach or enter the park. Parks can be reached on foot, by bicycle, or by public transport systems. The first group of visitors, i.e., pedestrians, is difficult to evaluate due to parks having several entrances and walking paths which enable smooth and uncontrolled flow throughout the park. New data collection opportunities are available for bicycles since cities provide shared bicycle programs with installed GPS. New technologies help us find the number and routes of cyclists visiting a park. Elements of bicycle infrastructure may also be classified as amenities, just as public transport stops (Yamu and Frankhauser, 2015; Donahue et al., 2018; Guo et al., 2019; Podgórniak-Krzykacz and Trippner-Hrabi, 2021; Podgórniak-Krzykacz et al., 2022).
The next factor group focuses on park equipment and how things are organised, which might attract elderly people, parents with children, or other specific groups of residents, to stay and spend time inside the park. The equipment tailored for each group includes not only park furniture but also the so-called small architecture enriching the landscape, or buildings hosting services that boost the attractiveness of the park, e.g., museums, galleries, or restaurants. Also, the immediate vicinity of the park matters and may be assessed in terms of the presence of heritage sites like the amenities (Chen and Wang, 2013; Biernacka and Kronenberg, 2018; Guo et al., 2019).
The natural richness of a park is also a fundamental factor for its attractiveness. The environmental and social values of parks depend on biodiversity, the presence of trees, flowerbeds, and bushes, as well as unique and unusual plant species and protected natural areas. Natural monuments are positively perceived heritage elements, and they are important to park amenities and for the development of educational functions.
The social involvement in the park’s development and activities is a derivative of attractiveness. Citizens are often inspired, motivated, and supported by participatory budgeting that democratically identifies the needs of residents. The financial value and the number of projects proposed and implemented in green spaces can be a source of data for the development or improvement of the attractiveness of city parks.
Urban amenities are key factors that improve quality of life and make neighbourhoods and whole cities more attractive. An increase in housing construction closely correlates with the demand for flats or houses. Personalised housing preferences are an important impulse to provide the necessary amenities to answer to the demand of inhabitants. City parks are one of the main factors that determine the value of real estate. Even small changes in the quality of green areas can have a huge impact on the urban environment and the social perception of a location (Baycan-Levent et al., 2009; Yamu and Frankhauser, 2015; Czembrowski and Kronenberg, 2016; McNeur, 2016; Menke, 2016; Xiao et al., 2016; Feltynowski, 2023).
To identify the most attractive urban park, two research methods were applied: the Analytic Hierarchy Process (AHP), proposed by Thomas L. Saaty (1980; 2008), and the Technique for Order Preference by Similarity to Ideal Solution (TOPSIS) (Hwang and Yoon, 1981). Both approaches belong to the group of Multiple Criteria Decision Analysis (MCDA) of the sub-discipline of operational research, and they can help choose an option through the appropriate composition and evaluation of decision-making criteria. These methods are used in decision-making in different spheres of life. In this paper, both were applied to identify the most attractive park based on the indicators used to make the assessment.
For the AHP, the selected indicators were assessed by a group of experts who made pairwise comparisons and then they ranked the indicators in descending order based on their impact on a phenomenon. The second method is the TOPSIS, which identifies objects that are the closest to the ideal and the most distant from the anti-ideal (Ozturk and Batuk, 2011).
We applied a procedure to both methods that complies with the assumptions defined in the subject-matter literature (Hwang and Yoon, 1981; Saaty, 2007; Saaty, 2008; Saaty and Vargas, 2012). From the theoretical assumptions we knew the weights for each constituent of the decision-making process for the TOPSIS method, in consequence we were able to use estimated weights from the AHP method. This solution is commonly found in the literature in relation to the AHP and TOPSIS methods used in research (Önüt and Soner, 2008; Ozturk and Batuk, 2011; Yue, 2011; Onder and Dag, 2013; Kobryń, 2014; Prakash and Barua, 2015; Hanine et al., 2016). Such a solution helps compare results obtained from the two methods using the same weight. It estimates and identifies the park that is the most attractive to the users of a given urban space based on selected measures specific for the parks.
The AHP method is based on four analytical steps:
Step 1: Indicate the purpose of the study and assessment criteria;
Step 2: Perform pairwise comparisons using the indicators in Table 1;
Step 3: Determine the relative importance of the factors;
Step 4: Verify the consistency of judgments across the Consistency Index (CI) and the Consistency Ratio (CR) (equation 1).
 | (1) |
where:
CR – consistency ratio;
CI – consistency index
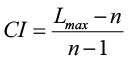 | (2) |
where:
Lmax – the maximum eigenvalue of the comparison matrix;
n – the size of the comparison matrix;
RI – random consistency index value (Table 1).
| Size of matrix | 1 | 2 | 3 | 4 | 5 | 6 | 7 | 8 | 9 |
|---|---|---|---|---|---|---|---|---|---|
| RI value | 0 | 0 | 0.58 | 0.9 | 1.12 | 1.24 | 1.32 | 1.41 | 1.45 |
The AHP method compares individual criteria as well as options that consider all criteria. Firstly, the evaluation is based on expert assessments. In this study, the experts were researchers and practitioners connected with the subject, i.e., with urban planning and spatial development. Regarding the evaluation of options for different criteria, the estimates depend on the value of the indicators. To operationalise the approach, the 20th, 40th, 60th and 80th percentile measure of location was used. Based on the calculated measures, we can pair indicators with values from the AHP fundamental scale while omitting indirect assessments. That is possible because, using the percentiles, we can divide the set into five intervals (see Table 2). To calculate individual weights, we need to identify the consistency index (CI) used to calculate the final measure, i.e., the consistency ratio (CR). The maximum CR value is 10%. Human perception allows one to deal with a certain amount of information, precisely with approximately seven pieces of information, ± 2 (Miller, 1994). Consequently, no level of the model in the AHP decision procedure should exceed nine elements (Saaty and Kearns, 1985).
| Intensity of Importance | Definition | Explanation | Percentile range |
|---|---|---|---|
| 1 | Equal importance | Two activities contribute equally to the objective | [0; 20th Percentile] |
| 2 | Weak or slight | - | - |
| 3 | Moderate importance | Experience and judgement slightly favour one activity over another | (20th Percentile; 40th Percentile] |
| 4 | Moderate plus | - | - |
| 5 | Strong importance | Experience and judgement strongly favour one activity over another | (40th Percentile; 60th Percentile] |
| 6 | Strong plus | - | - |
| 7 | Very strong or demonstrated importance | An activity is favoured very strongly over another; its dominance demonstrated in practice | (60th Percentile; 80th Percentile] |
| 8 | Very, very strong | - | - |
| 9 | Extreme importance | The evidence favouring one activity over another is of the highest possible order of affirmation | Value higher than 80th Percentile |
In the case of the TOPSIS method, the analytical procedure was based on 7 steps (Kobryń, 2014; Hanine et al., 2016):
Step 1: Indicate the purpose of the study and assessment criteria;
Step 2: Data normalisation[1];
Step 3: Determine the weights of each criterion in accordance with the research assumptions; the weights calculated for the AHP method were used;
Step 4: Identify the positive ideal solution and negative ideal solution based on the data in the research;
Step 5: Determine the Euclidean distance of each alternative from the positive and negative ideal solutions;
Step 6: Calculate the Relative Closeness (Ci) to the positive ideal solution using equation (3).
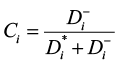 | (3) |
where:
Di* – distance of the i th alternative to the positive ideal solution;
Di- – distance of the i th alternative to the negative ideal solution.
Step 7: Formulate ranking based on decreasing index Ci values.
Parks were selected for the analysis based on data from the study conducted by the Sendzimir Foundation entitled “Count on Green” (in Polish: Licz na zieleń), in which the users of urban spaces identified the green spaces they visited most often. The study used the SoftGIS method, i.e., a specific approach to public participatory geographical information system (PPGIS) (Czembrowski et al., 2016), which involves identifying formal and non-formal green areas in an urban space using a geo-questionnaire (Pietrzyk-Kaszyńska et al., 2017). The study extends and deepens previous research of the Lodz urban park values (Czembrowski et al., 2016; Pietrzyk-Kaszyńska et al., 2017). In the first stage, we identified green areas that were available to residents free of charge and were classified in land survey documentation as urban parks. Green walkways were disregarded as they are mostly open green spaces in streets or links between streets. The analysis did not cover parks which are not seen as places where people spend their leisure time surrounded by greenery, because they are not very attractive to potential users. As a result, we constructed the index of indications per hectare and calculated the 80th percentile to identify the 20% of parks which had an index value highest. We used the measure suggested by the “Count of Green” study presenting a green space visited most often by respondents. We used the original indicators of the attractiveness of parks which could be obtained from the city authorities.
To assess the attractiveness of parks, we used indicators that help assess the density of walking paths per hectare of a park (K1), the number of natural monuments per 10 hectares of a park (K2), the percentage of resources earmarked in the participatory budgeting exercise compared to the value of projects proposed for urban parks (K3), bus/tram stops situated 400 m from the park per hectare of a park (K4), and historical monuments within the buffer belt of 200 m from a park per 10 hectares of park area (K5). In the case of two indicators, the constituents of final synthetic indicators were weighted. As for the accessibility of cycling infrastructure in parks (K6), the AHP entropy weights were calculated (Kobryń, 2014). Meanwhile, to assess the pieces of equipment in parks (see Table 3), we applied a method consistent with the AHP, i.e., a pairwise comparison of constituents conducted by a team of 5 experts. The expert assessments were used to identify the weights of elements which are fundamental for a park’s attractiveness. These elements include park structures (e.g., caves, gazebos, etc.), buildings that provide additional attractions in parks (e.g., a palm house, museums, restaurants, etc.), sandboxes and playgrounds for children, outdoor gyms and playing fields, fountains, and, finally, sculptures and monuments found in the parks. The expert assessments and the field studies in the parks provided the basis to calculate a synthetic indicator of park attractiveness based on the proposed elements of equipment; it was labelled K7 in the AHP analysis. The indicators and their descriptions can be found in Table 3.
| Indicator symbol |
Description | Components |
|---|---|---|
| K1 | Walking paths per 1 ha of park area | |
| K2 | Number of natural monuments per 10 ha of park area | |
| K3 | Percentage of resources to be spent under participatory budgeting | |
| K4 | Bus/tram stops located 400 m from a park per 1 ha of park area | |
| K5 | Historical objects within the 200 m buffer from a park per 10 ha of park area | |
| K6 | Availability of cycling infrastructure within 400 m from a park | K6.1 Bicycle routes per 1 ha of park area; K6.2 Public bike-share scheme stations per 10 ha of park area; K6.3 Bicycle racks per 1ha of park; K6.4 Public bicycle rides in parks in km per 1 ha of park. |
| K7 | Elements of park equipment | K7.1 Park structures (e.g., caves, gazebos, etc.) [number per hectare]; K7.2 Additional premises in parks (e.g., a palm house, museums, restaurants, etc.) [number per hectare]; K7.3 Sandboxes for children, outdoor gyms and fields [number per hectare]; K7.4 Fountains [number per hectare]; K7.5 Sculptures and monuments in parks [number per hectare]. |
The selected indicators were developed based on the data made available by the Lodz Geodesy Centre, which runs the Land Information System for the city. Only for component K6, which deals with public bicycle rides, data obtained from Lodz Road and Transportation Board (in Polish: Zarząd Dróg i Transportu) was used. They collect and manage data from the GPS system installed on the bicycle sharing public scheme operated in Lodz. The K7 indicator was constructed based on field studies conducted in the parks selected for the final analysis. The use of buffer belts around parks influenced the value of indicators K4, K5 and K6. For K5, we applied a 200 metre buffer, which helps identify historical sites in the immediate vicinity of parks that can still be seen by people in the park. For indicators K4 and K6, wider buffers of 400 m, which on average translate to a 5-minute walk, were applied.
Since indicators K6 and K7 are composed of indexes, we decided to weight individual elements. The weights for the K6 indexes were calculated using the entropy method (Deng et al., 2000; Huang, 2008). All components of K6 were regarded as stimulants which help normalise the value of indicators using the following equation 4:
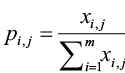 | (4) |
where:
xi,j – is the value of alternative Ai under criterion Cj and i ∈ [1 .. m] where i is the alternative number; j ∈ [1 .. n] where j is the criterion number.
The estimates enabled the calculation of entropy using equation (5) and the calculation of weights of individual criteria in accordance with equation (6).
 | (5) |
where i ∈ [1 .. m] where i is the alternative number; j ∈ [1 .. n] where j is the criterion number.
 | (6) |
where j ∈ [1 .. n] where j is the criterion number and dj = 1 - ej
In the case of K6, after the weights were calculated using the entropy method, we had to calculate the indicators used in further stages of the study in the AHP and TOPSIS methods. Since the constituents of the indicators are expressed in different units of measurement, we had to deploy normalised data in accordance with equation 4. It allowed us to use weights and specify the values of the indicators for the parks which were analysed later.
Because of the values achieved by the other indicators, for K7 we could not rely on entropy, and we had to estimate the weights for its components based on estimates from pairwise comparisons. We used expert assessments from the pairwise comparisons following the methodology applied for the AHP.
It is an increasingly common practice in research to use weights, determined by the AHP method, to conduct multi-criteria analyses using the TOPSIS method – cf. literature related to the research methods (Önüt and Soner, 2008; Prakash and Barua, 2015; Rokhsari and Sadeghi-Niaraki, 2015; Hanine et al., 2016; Berdie et al., 2017; Azimifard et al., 2018).
Lodz is situated in the centre of Poland at the crossroads of two main motorways, the A1 and the A2. Nowadays, the city is inhabited by shy of 665,000 residents (data at the end of 2021) and is the fourth largest city in Poland by population. It covers an area of 293.25 sq. km and ranks fourth among cities in Poland in terms of territory. At present, the development of Lodz is taking place in two units connected with the history of the city, i.e., the metropolitan zone and the contemporary development core. The former has been delineated according to the presence of historical buildings, which determine the city’s identity. Its most important feature is its layout, with tenements and adjacent factory complexes usually linked with parks. The contemporary part of the metropolitan development, often referred to as the Lodz Urban Zone, is situated within the borders of the railway loop line. The Historic Urban Core is home to 13 parks, but when we extend the area to include the metropolitan zone, there are 29 urban parks. According to data provided by the Lodz Geodesy Centre, in total there are 48 parks in Lodz, four green walkways, and three city squares which are green spaces (Fig. 2). Most parks in Lodz are the remains of the former Lodz Forest, the source of building material for the development of the industrial city back in the 19th century.
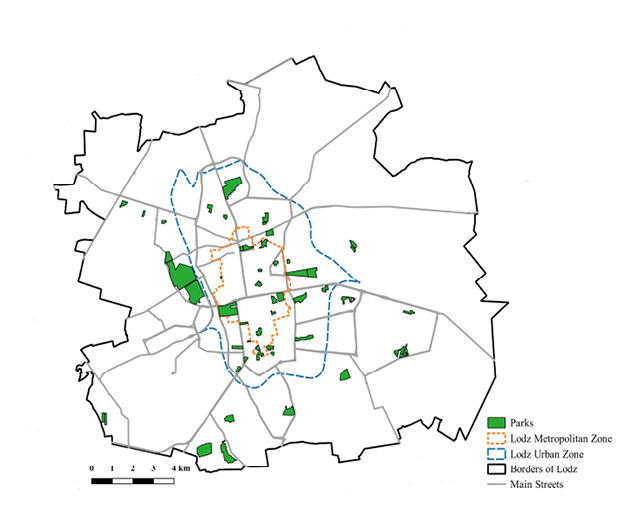
Fig. 2. Parks in Lodz and the location of the Lodz Metropolitan Zone and Lodz Urban Zone
Source: own work based on data from the Lodz Geodesy Centre and the Head Office of Geodesy and Cartography.
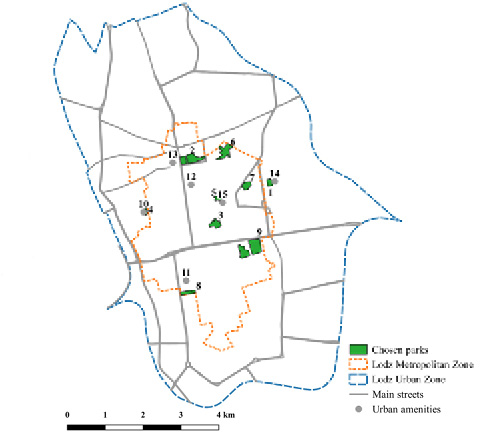
All parks selected in accordance with the methodology are located in the Lodz Urban Zone, within the borders of the so-called railway loop line (Fig. 3). For all the tested parks, the value of user indications per hectare was higher than 4.89/ha, which resulted from the calculations of the 80th percentile for this dataset.
|
|
Fig. 3. Parks in Lodz selected for the analysis with urban amenities
Source: own work based on data from the Lodz Geodesy Centre and the Head Office of Geodesy and Cartography and Open Street Map.
Seven of the nine examined parks (Haller’s Square and Old Town are the exceptions) are objects of historical and industrial origin, and they were built almost at the same time, i.e., in the 19th century. They were an important element in the landscape of the industrial city, although some of them were private. They were founded in relatively natural areas, and despite the planned arrangement, native species of the old forest still stand. Currently, all parks are public. The composition of their green species and, above all, the equipment contained within the parks, have changed significantly over the years. Also, the surroundings of these parks, the spatial structure of the city, and the objects located in it have changed significantly.
By selecting nine parks, we were able to calculate indicators connected with their respective locations. When it comes to indicators K6 and K7, the calculations were more complex. K6 was combined with weights whose estimates are given in Table 4. Looking at these weights, we can see that they are remarkably close for indices K6.1, K6.2 and K6.4, while K6.3, the index concerning the availability of bicycle racks in parks, is much less significant.
| Index | Weight |
|---|---|
| K6.1 Bicycle routes per 1 ha of park | 0.289 |
| K6.2 Public bike-share scheme stations per 10 ha of park | 0.292 |
| K6.3 Bicycle racks per 1 ha of park | 0.143 |
| K6.4 Public bicycle rides in parks per 1ha of park | 0.276 |
We also estimated the weights for indicator K7 using the pairwise comparison method. The weights demonstrate that the presence of recreational equipment and infrastructure was the most important element for the experts, since the highest weights were allocated to structures and elements that offered physical training and entertainment opportunities for children and youngsters. Amongst the components of K7, places which enrich the offer proposed by parks, i.e., museums, winter gardens or restaurants, played an important role. Similarly, a higher weight was assigned to structures in the park that were open to visitors and were available in selected green spaces across the city. The weights for fountains, sculptures, and monuments were much lower compared to the other components of K7. The weights of these indexes are presented in Table 5.
The estimated weights made it possible to generate a set of indicators that describe individual parks covered by the analysis. Data was also used to calculate the 20th, 40th, 60th and 80th percentiles, which is necessary to make calculations for the AHP method (see Table 6).
| Index | Weight |
|---|---|
| K7.1 Park structures (e.g., caves, gazebos, etc.) | 0.202 |
| K7.2 Premises in parks (e.g., palm house, museums, restaurants, etc.) | 0.256 |
| K7.3 Sandboxes for children, outdoor gyms, and playing fields | 0.435 |
| K7.4 Fountains | 0.074 |
| K7.5 Sculptures and monuments in the park | 0.033 |
| K1 | K2 | K3 | K4 | K5 | K6 | K7 | |
|---|---|---|---|---|---|---|---|
| V1 | 618.6 | 0.0 | 2.7 | 7.1 | 7.1 | 0.08 | 0.8 |
| V2 | 434.0 | 0.0 | 3.6 | 4.7 | 9.6 | 0.14 | 1.8 |
| V3 | 553.8 | 43.0 | 25.3 | 4.9 | 24.1 | 0.07 | 1.2 |
| V4 | 976.0 | 0.0 | 0.0 | 12.8 | 8.1 | 0.23 | 0.4 |
| V5 | 594.8 | 0.0 | 50.1 | 22.7 | 38.7 | 0.16 | 0.3 |
| V6 | 423.9 | 3.7 | 1.5 | 3.2 | 2.6 | 0.08 | 2.6 |
| V7 | 461.6 | 15.9 | 100.0 | 9.0 | 11.1 | 0.06 | 0.9 |
| V8 | 465.5 | 52.9 | 0.0 | 7.5 | 8.7 | 0.13 | 1.0 |
| V9 | 437.0 | 1.8 | 0.0 | 2.1 | 65.7 | 0.05 | 3.1 |
| Percentile | |||||||
| 20th | 435.79 | 0.00 | 0.00 | 4.07 | 7.72 | 0.07 | 0.63 |
| 40th | 462.42 | 0.36 | 1.73 | 5.38 | 8.90 | 0.08 | 0.92 |
| 60th | 536.11 | 3.30 | 3.42 | 7.39 | 10.81 | 0.12 | 1.18 |
| 80th | 604.32 | 26.72 | 35.24 | 10.51 | 29.93 | 0.15 | 2.11 |
>Pairwise comparisons for all indicators and for individual options that consider individual criteria informed us which measures exerted the strongest impact upon the investigated phenomenon. As a result, we were able to rank the parks for their attractiveness to potential users.
In all calculations conducted for the AHP method, the Consistency Ratios (CR) were satisfactory. Thus, we were able to continue the analysis leaving the pairwise comparisons matrix unchanged (see Table 7).
| Type of matrix | Matrix size – n | Consistency ratio – CR [%] |
|---|---|---|
| Criteria matrix | 7 | 7.8 |
| Matrix of options based on K1 | 9 | 3.7 |
| Matrix of options based on K2 | 9 | 2.8 |
| Matrix of options based on K3 | 9 | 3.5 |
| Matrix of options based on K4 | 9 | 3.7 |
| Matrix of options based on K5 | 9 | 3.7 |
| Matrix of options based on K6 | 9 | 3.7 |
| Matrix of options based on K7 | 9 | 3.7 |
An analysis of the data using the AHP method helped us conclude that, as shown by the experts’ assessments, criterion K6, whose weight was 34.7%, was the most important. The second most important criterion was K7, i.e., the availability of leisure equipment and infrastructure in parks. In this case, the weight was 21.2%. According to the experts, the accessibility of a park by public transport also mattered, which could be seen in the weight of 17.1% for criterion K4. Other criteria proved less important, and their weights were lower than 10%. K1, the density of walking paths, scored 9.5%; historical sites located in the vicinity of the park (K5) scored 7.6%, and projects financed under the participatory budgeting exercise (K3) achieved 5.9%. The lowest weight was reported for natural heritage in parks expressed in the number of natural monuments per 1 ha (K2). For the experts, the relevance of this criterion for the analysis of park attractiveness was only 4% (see Table 8).
The weights of individual components used in the analysis made it possible to suggest which of the parks included in the study were the most attractive elements of green infrastructure in the Lodz Urban Zone. Moniuszko’s Park, with the total weight exceeding 19.5%, ranked first among all the analysed locations. Haller’s Square ranked second, with a weight of over 17.5% calculated from the data and the experts’ assessments. Klepacz’s Park was third in this ranking of attractiveness with a weight of over 10.8%. At the other extreme there were parks whose attractiveness was poor. Staszic’s Park, whose weight was 7.329%, and Matejko’s Park, with the weight slightly above 7.74%, scored the lowest. The assessment of Helenów Park’s attractiveness based on the presented criteria was also unsatisfactory, as the park scored slightly more than 8.4%.
| Options | Criteria with weights | Weights for options [%] |
||||||
|---|---|---|---|---|---|---|---|---|
| K1 | K2 | K3 | K4 | K5 | K6 | K7 | ||
| 9.5% | 4.0% | 5.9% | 17.1% | 7.6% | 34.7% | 21.2% | ||
| V1 | 0.272 | 0.022 | 0.074 | 0.072 | 0.019 | 0.072 | 0.036 | 7.7458 |
| V2 | 0.019 | 0.022 | 0.139 | 0.036 | 0.072 | 0.137 | 0.137 | 9.9097 |
| V3 | 0.137 | 0.276 | 0.139 | 0.036 | 0.137 | 0.036 | 0.137 | 9.036 |
| V4 | 0.272 | 0.022 | 0.02 | 0.272 | 0.036 | 0.272 | 0.019 | 17.556 |
| V5 | 0.137 | 0.022 | 0.274 | 0.272 | 0.272 | 0.272 | 0.019 | 19.5657 |
| V6 | 0.019 | 0.141 | 0.04 | 0.019 | 0.019 | 0.036 | 0.272 | 8.4654 |
| V7 | 0.036 | 0.141 | 0.274 | 0.137 | 0.137 | 0.019 | 0.036 | 7.329 |
| V8 | 0.072 | 0.276 | 0.02 | 0.137 | 0.036 | 0.137 | 0.072 | 10.8026 |
| V9 | 0.036 | 0.078 | 0.02 | 0.019 | 0.272 | 0.019 | 0.272 | 9.5898 |
|
Sum: |
100 | |||||||
The practical application of the TOPSIS method with weights estimated for the AHP allowed us to rank the parks. As demonstrated by the results, Haller’s Square was the most attractive park (V4) scoring 0.541. The assessment for Moniuszko’s Park was also high, at 0.531. All other parks included in the exercise scored below 0.400, which shows how much the leaders in attractiveness ranking were ahead of the rest of the sample. The full list is shown in Table 9.
| Park | Option | Rating |
|---|---|---|
| Matejko’s Park | V1 | 0.191 |
| Old Town Park | V2 | 0.396 |
| Sienkiewicz’s Park | V3 | 0.224 |
| Haller’s Square | V4 | 0.541 |
| Moniuszko’s Park | V5 | 0.531 |
| Helenów Park | V6 | 0.340 |
| Staszic’s Park | V7 | 0.257 |
| Klepacz’s Park | V8 | 0.360 |
| Źródliska Park | V9 | 0.389 |
By analysing the results, we identified parks whose attractiveness measured using the TOPSIS method was low. This group included Matejko’s Park assessed at 0.191. Low assessments were also given to Sienkiewicz’s Park and Staszic’s Park, which scored 0.224 and 0.257, respectively.
By integrating elements of the AHP method with the TOPSIS method, we were able to obtain two rankings and decide which park should be considered the most attractive against a given set of indicators (criteria). The rankings based on these methods differ, although the estimates that were produced allowed us to believe that the differences were not bigger than two ranking positions. The results show that attractiveness assessments based on the AHP and TOPSIS methods correlate at the level of 0.85, which indicates a strong correlation in accordance with the Guilford scale (1942). The final rankings are shown in Table 10.
| Park | Option | AHP ranking | TOPSIS ranking |
|---|---|---|---|
| Moniuszko’s Park | V5 | 1 | 2 |
| Haller’s Square | V4 | 2 | 1 |
| Klepacz’s Park | V8 | 3 | 5 |
| Old Town Park | V2 | 4 | 3 |
| Źródliska Park | V9 | 5 | 4 |
| Sienkiewicz’s Park | V3 | 6 | 8 |
| Helenów Park | V6 | 7 | 6 |
| Matejko’s Park | V1 | 8 | 9 |
| Staszic’s Park | V7 | 9 | 7 |
An important conclusion is that the two most attractive parks simply switched their ranking positions in the methods. For the rest of the rankings, the results revealed much greater differentiations. We also need to stress that Haller’s Square, the smallest park by area, was perceived as highly attractive by its users based on the measures (criteria) used in this assessment exercise. The same could be said about Moniuszko’s Park, which is also one of the smallest parks in Lodz.
Information and data about parks in cities come predominantly from local authorities, and they provide the basis for the assessment of amenities found in parks across a city. Additionally, information and knowledge come from data included in inventories for these areas made for scientific purposes. We need to bear in mind that data collected in local authorities’ files is often not utilised properly. That is why there is a gap in the knowledge regarding the mathematical methods that help identify areas of high potential from the point of view of city dwellers assisting the decision-making process. Open Data, as a form of democracy and an element of building smart cities, could help researchers and NGOs collaborate when performing an independent analysis of various aspects of city functioning (Kitchin, 2014; Gray and Lämmerhirt, 2017).
The parks in Lodz which were covered by the study are located in very different areas, and this impacts their perception as amenities in the city. It also translates into how attractive these spaces are, which itself depends on the criteria against which attractiveness is measured. For our study, what mattered for the assessment of parks within the Lodz Urban Zone were the attributes that facilitate recreational, cultural or transportation functions. In the eyes of the experts, the ability to access parks using municipal transport was especially important.
The parks included in our study also helped us reveal differences among them, such as the area, plant species, and internal organisation. The differences also translate into how the parks are perceived by residents who cast their votes annually for projects proposed within the framework of participatory budgeting.
The issue of accessibility clearly comes to the fore, since it is determined by the existing transport system and the park’s location in a neighbourhood full of urban amenities. For instance, Moniuszko’s Park is located in the city centre close to the railway station, which is a public transport hub. Thus, apart from preserving heritage, the park performs the function of a pedestrian route. This function dominates the recreational function. Haller’s Square, located in front of a hospital, functions as a green ‘entrance hall’ to the facility. Klepacz’s Park is the front garden to the Campus of the Lodz University of Technology (with nearly 20,000 students). The Old Town Park links the historical city centre and the main street (Piotrkowska) with a huge, post-industrial complex adapted for retail, leisure and cultural purposes (the City of Lodz Museum, the Museum of Contemporary Art – MS2, and the Manufaktura shopping mall), therefore, the flow of people is dominant. The low position in the ranking is surprising. Matejko’s Park, developed in the French style, looks extremely elegant and has natural values but it is located opposite the University Library without any chance of becoming a shortcut.
Our analysis has led us to believe that the facilities available in parks impact their attractiveness. As suggested by the experts – and in line with the weights for different criteria obtained from the AHP method – we may conclude that the accessibility of parks to cyclists is emerging as a crucial factor of their attractiveness. Other important criteria include the presence of small structures and park furniture. Based on the results, we may also say that our multiple-criteria analysis reflects the preferences of different groups of users, including experts.
In light of the above, we might suggest that the city should improve the accessibility of parks for cyclists and users of the city bike-share scheme, and install more sports facilities and playgrounds for children in parks. Concerning parks listed in the register of historical monuments, all design activities shall be agreed upon by the conservationist of historical monuments. We should not forget about attracting parents with children to enjoy peace and quiet in a nice green setting without having to leave the city. The city authorities need to consider such investment projects in their plans for developing green spaces because they satisfy the needs of different social groups living in the city.
The approach adopted for the paper has enabled us to conclude that multi-criteria methods do not have to be used exclusively to assess park attractiveness; by using partial results of the decision-making process, they may provide the basis for research-based decision-making at the level of local authorities.
Parks in cities are used to assess components of green infrastructure in urban areas. By applying two research methods, AHP and TOPSIS, we were able to establish how priorities concerning the attractiveness of parks, and building their image, change depending on the method. Our results have shown two alternative methods which produced two different rankings of attractiveness for the same set of parks. We need to stress that the results increase the likelihood of finding optimal solutions (Nilsson et al., 2016). When assessing the results from the two methods shows that, looking at the correlation of the two rankings, the results are strongly correlated despite having noticeable differences. The specification of user preferences in light of these methods lets us explain how selected MCDA methods assist decision-makers in Lodz to make decisions that are intended to improve the attractiveness of the parks in the city. Consequently, they also help identify strategies for improving the quality of green spaces in cities.
Importantly, the analysis, which was conducted in accordance with two MCDA methods, facilitated the understanding of the decision-making process by local actors. Scientific analysis, as well as its practical application in everyday administrative practices, provides justification of the results at different stages of the procedure. It helps explain to local communities how decisions are made based on the specific indicators used in the process. We need to stress that extending the proposed model may be counterproductive as it may become impossible to understand due to the complexity of the relationships within it. Such a problem has indeed been observed in the subject-matter literature (Cheng and Mattor, 2006; Nordström et al., 2010), especially for the AHP. It also explains why expert pairwise assessments are used in the analysis and the weights of criteria estimated in the AHP are used in the TOPSIS method.
Regarding the indicators that made it possible to apply both methods, we need to bear in mind that they change depending on the size of the city or its infrastructure. We adopted a comprehensive approach; however, the attractiveness of urban parks changes over time and is determined by season.
Additionally, while for the AHP method we must expect limitations resulting from the number of levels in the decision-making structure – which should not be greater than nine elements at each step – this limitation does not yet apply to TOPSIS. Yet when it comes to TOPSIS, we should remember to choose a procedure to calculate the weights of individual components or to make a subjective choice that allows that method to be used.
To apply the methods that we analysed here, we need data that can be used to assess the attractiveness of urban parks based on the facilities available within them and in their vicinity. The availability of data in a dynamic approach facilitates additional analysis designed to evaluate changes.
In accordance with our results, we need to stress that no matter where a park or a city is located, these research methods can also be used to assess the attractiveness of parks against different sets of criteria. In addition to what we can learn about a city from individual indicators describing parks, we can also gain knowledge about the city in the rankings of attractiveness prepared according to these methods. This is how local authorities may discover which parks need additional investments, as well as which factors are the most decisive for attractiveness. Such knowledge provides the foundations for planning the development of green infrastructure in the city (Meerow and Newell, 2017), which impacts the quality of life of its residents (Degórska and Degórski, 2017).
The pre-selection of parks based on earlier research has shown that small parks in the urban centre zone are more attractive than large parks on the outskirts. This phenomenon seems to be a result of higher urban density and hence a higher number of interactions per hectare. The choice of 9 parks is the highest possible number due to the limitations of the method. We have assumed that a park is an urban amenity, and its attractiveness is the result of the amenities inside and outside. The indicators are derived as quantitative parameters from earlier recognised location attractiveness factors. To sum up, the applied methods (AHP and TOPSIS) have made it possible to assign weights of value indicators to obtain an intersubjective result of attractiveness. In addition, TOPSIS has provided a ranking which is significantly correlated with the gradation of AHP results. Nevertheless, TOPSIS reorders position in the ranking groups at the top (1−2), in the middle (3−5), and at the bottom (6−9) of the table. The top 4 parks are, in fact, green walkways – a front garden, an “entrance hall,” or a link to civic buildings and complexes. The heavy traffic and flow of people become pre-dominant because the assumed criteria promote various transport accessibility and a neighbourhood of high urban density. Consequently, aesthetic, compositional, and natural values are of secondary importance.
The presented methods seem ready to be used for city management purposes. They may allow municipal administration to efficiently aggregate citizens’ needs since the public sector is the data collector and owner. In the deliberative model of city management, the use of these methods by NGOs or other independent researchers is possible, provided that open data is available. In the decision-making process concerning urban amenities, the criteria and indicators can be adjusted and adapted to the specificity of a city and its inhabitants. The indictor weights can be an intersubjective result of the opinions of experts who function as a link with the community, or they can be a broad aggregation based on a public survey. In conclusion, we recommend using these methods to make the right planning and economic decisions in a constantly evolving city.
AZIMIFARD, A., MOOSAVIRAD, S. H. and ARIAFAR, S. (2018), ‘Selecting sustainable supplier countries for Iran’s steel industry at three levels by using AHP and TOPSIS methods’, Resources Policy, 57, pp. 30−44. https://doi.org/10.1016/j.resourpol.2018.01.002
BAYCAN-LEVENT, T., VREEKER, R. and NIJKAMP, P. (2009), ‘A Multi-Criteria Evaluation of Green Spaces in European Cities’, European Urban and Regional Studies, 16 (2), pp. 193−213.
BERDIE, A. D., OSACI, M., MUSCALAGIU, I. and BARZ, C. (2017), ‘A combined approach of AHP and TOPSIS methods applied in the field of integrated software systems’, IOP Conference Series: Materials Science and Engineering, 200. https://10.1088/1757-899X/200/1/012041
BIERNACKA, M. and KRONENBERG, J. (2018), ‘Classification of institutional barriers affecting the availability, accessibility and attractiveness of urban green spaces’, Urban Forestry and Urban Greening, 36, pp. 22−33. https://10.1016/j.ufug.2018.09.007
CHEN, W. Y. and WANG, D. T. (2013), ‘Economic development and natural amenity: An econometric analysis of urban green spaces in China’, Urban Forestry & Urban Greening, 12, pp. 435−442. https://doi.org/10.1016/j.ufug.2013.08.004
CHENG, A. S. and MATTOR, K. M. (2006), ‘Why won’t they come? Stakeholder perspectives on collaborative national forest planning by participation level’, Environmental Management, 38, pp. 545−561.
CZEMBROWSKI, P. and KRONENBERG, J. (2016), ‘Hedonic pricing and different urban green space types and sizes: Insights into the discussion on valuing ecosystem services’, Landscape and Urban Planning, 146, pp. 11−19. https://doi.org/10.1016/j.landurbplan.2015.10.005
CZEMBROWSKI, P., KRONENBERG, J. and CZEPKIEWICZ, M. (2016), ‘Integrating non-monetary and monetary valuation methods – SoftGIS and hedonic pricing’, Ecological Economics, 130, pp. 166−175. https://doi.org/10.1016/j.ecolecon.2016.07.004
de GROOT, R. S., WILSON, M. A. and BOUMANS, R. M. J. (2002), ‘A typology for the classification, description and valuation of ecosystem functions, goods and services’, Ecological Economics, 41, pp. 393−408.
DEGÓRSKA, B. and DEGÓRSKI, M. (2017), ‘Green Infrastructure as a Very Important Quality Factor in Urban Areas - Warsaw Case Study’, Europa XXI, 32, pp. 51−70.
DENG, H., YEH, Ch. H. and WILLIS, R. J. (2000), ‘Inter-company comparison using modified TOPSIS with objective weights’, Computers & Operations Research, 27 (10), pp. 963−973. https://doi.org/10.1016/S0305-0548(99)00069-6
DONAHUE, M. L., KEELER, B. L., WOOD, S. A., FISHER, D. M., HAMPSTEAD, Z. A. and MCPHERSON, T. (2018), ‘Using social media to understand drivers of urban park visitation in the Twin Cities, MN’, Landscape and Urban Planning, 175, pp. 1−10. https://doi.org/10.1016/j.landurbplan.2018.02.006
FELTYNOWSKI, M. (2023), ‘Urban green spaces in land-use policy – types of data, sources of data and staff – the case of Poland’, Land Use Policy, 127, 106570. https://doi.org/10.1016/j.landusepol.2023.106570
GLAESER, E. L., KOLKO, J. and SAIZ, A. (2001), ‘Consumer city’, Journal of Economic Geography, 1 (1), pp. 27−50. https://doi.org/10.1093/jeg/1.1.27
GLAESER, E. L., KOLKO, J. and SAIZ, A. (2003), ‘Consumers and Cities’, Research in Urban Policy, 9, pp. 177−183. https://doi.org/10.1016/S1479-3520(03)09005-6
GRAY, J. and LÄMMERHIRT, D. (2017), Data And The City: New report on how public data is fostering civic engagement in urban regions, Cambridge: St John’s Innovation Centre.
GUILFORD, J. P. (1942), Fundamental Statistics in Psychology and Education, New York: McGraw-Hill Book Company.
GUO, S., YANG, G., PEI, T., MA, T., SONG, C., SHU, H., DU, Y. and ZHOU, Ch. (2019), ‘Analysis of factors affecting urban park service area in Beijing: Perspectives from multi-source geographic data’, Landscape and Urban Planning, 181, pp. 103−117. https://doi.org/10.1016/j.landurbplan.2018.09.016
HANINE, M., BOUTKHOUM, O., TIKNIOUINE, A. and AGOUTI, T. (2016), ‘Application of an integrated multicriteria decision making AHPTOPSIS methodology for ETL software selection’, Springer Plus, 5, p. 263. https://10.1186/s40064-016-1888-z
HUANG, J. (2008), ‘Combining entropy weight and TOPSIS method for information system selection’, 2008 IEEE Conference on Cybernetics and Intelligent Systems. https://doi.org/10.1109/ICCIS.2008.4670971
HWANG, Ch. L. and YOON, K. (1981), Multiple Attribute Decision Making Methods and Applications. A State of the Art Survey, New York: Springer-Verlag.
KITCHIN, R. (2014), The Data Revolution: Big Data, Open Data, Data Infrastructures and Their Consequences, London: SAGE Publications.
KOBRYŃ, A. (2014), Wielokryterialne wspomaganie decyzji w gospodarowaniu przestrzenią, Warszawa: Difin.
MARKUSEN, A. (2006), ‘Urban Development and the Politics of a Creative Class: Evidence from a Study of Artists’, Environment and Planning A, 38 (10), pp. 1921−1940. https://doi.org/10.1068/a38179
MCNEUR, C. (2016), ‘Parks, People, and Property Values: The Changing Role of Green Spaces in Antebellum Manhattan’, Journal of Planning History, 16 (2), pp. 98−111. https://doi.org/10.1177/1538513216657563
MEEROW, S. and NEWELL, J. P. (2017), ‘Spatial planning for multifunctional green infrastructure: Growing resilience in Detroit’, Landscape and Urban Planning, 159, pp. 62−75. https://doi.org/10.1016/j.landurbplan.2016.10.005
MENKE, P. (2016), ‘Grüne Infrastruktur – Konzepte und Strategien zur Förderung eines Bewusstseins für den Wert von Stadtgrün’, Standort, 40 (2), pp. 117–122. https://doi.org/10.1007/s00548-016-0424-2
MILLER, G. A. (1994), ‘The Magical Number Seven, Plus or Minus Two. Some Limits on Our Capacity for Processing Information’, Psychological Review, 101 (2), pp. 343–352.
NILSSON, H., NORDSTRÖM, E. M. and ÖHMAN, K. (2016), ‘Decision Support for Participatory Forest Planning Using AHP and TOPSIS’, Forests, 7 (5), 100. https://doi.org/10.3390/f7050100
NORDSTRÖM, E. M., ERIKSSON, L. O. and ÖHMAN, K. (2010), ‘Integrating multiple criteria decision analysis in participatory forest planning: Experience from a case study in northern Sweden’, Forest Policy and Economics, 12, pp. 562−574. https://doi.org/10.1016/j.forpol.2010.07.006
OLEKSIEJUK, E. and JANKOWSKA, A. (2007), Zieleń miejska – naturalne bogactwo miasta. Lasy w miastach Unii Europejskiej – zasady gospodarowania i ochrona, Toruń: Polskie Zrzeszenie Inżynierów i Techników Sanitarnych Oddział Toruń.
ONDER, E. and DAG, S. (2013), ‘Combining Analytical Hierarchy Process and TOPSIS Approaches for Supplier Selection in a Cable Company’, Journal of Business, Economics & Finance, 2 (2), pp. 56−74.
ÖNÜT, S. and SONER, S. (2008), ‘Transshipment site selection using the AHP and TOPSIS approaches under fuzzy environment’, Waste Management 28 (9), pp. 1552−1559. https://doi.org/10.1016/j.wasman.2007.05.019
OZTURK, D. and BATUK, F. (2011), ‘Technique for Order Preference by Similarity to Ideal Solution (TOPSIS) for Spatial Decision Problems’, International Society for Photogrammetry and Remote Sensing, http://www.isprs.org/proceedings/2011/Gi4DM/PDF/PP12.pdf [accessed on: 27.02.2022].
PIETRZYK-KASZYŃSKA, A., CZEPKIEWICZ, M. and KRONENBERG, J. (2017), ‘Eliciting non-monetary values of formal and informal urban green spaces using public participation GIS’, Landscape and Urban Planning, 160, pp. 85−95. https://doi.org/10.1016/j.landurbplan.2016.12.012
PODGÓRNIAK-KRZYKACZ, A., PRZYWOJSKA, J. and TRIPPNER-HRABI, J. (2022), ‘A Public Value-Based, Multilevel Evaluation Framework to Examine Public Bike-Sharing Systems. Implications for Cities’ Sustainable Transport Policies’, Transport and Telecommunication Journal, 23 (2), pp. 180−194. https://doi.org/10.2478/ttj-2022-0016
PODGÓRNIAK-KRZYKACZ, A. and TRIPPNER-HRABI, J. (2021), ‘Motives and factors that determine city residents’ use of public bicycles. The case of Lodz, Poland’, Case Studies on Transport Policy, 9 (2), pp. 651−662. https://doi.org/10.1016/j.cstp.2021.03.003.
PRAKASH, Ch. and BARUA, M. K. (2015), ‘Integration of AHP-TOPSIS method for prioritizing the solutions of reverse logistics adoption to overcome its barriers under fuzzy environment’, Journal of Manufacturing Systems, 37, pp. 599–615. https://doi.org/10.1016/j.jmsy.2015.03.001
Public Space Charter (in Polish: Karta Przestrzeni Publicznej) (2009). http://www.tup.org.pl/download/KartaPrzestrzeniPublicznej.pdf [accessed on: 10.01.2022].
ROKHSARI, S. and SADEGHI-NIARAKI, A. (2015), ‘Urban Network Risk Assessment Based on Data Fusion Concept using Fuzzy-AHP, TOPSIS and VIKOR in GIS Environment’, Iranian Journal of Operations Research, 6 (2), pp. 73−86.
SAATY, T. L. and VARGAS, L. G. (2012), Models, Methods, Concepts & Applications of the Analytic Hierarchy Process, New York: Springer.
SAATY, T. L. (1980), The Analytic Hierarchy Process, New York: McGraw Hill.
SAATY, T. L. (2007), ‘Multi-decisions decision-making: In addition to wheeling and dealing, our national political bodies need a formal approach for prioritization’, Mathematical and Computer Modelling, 46, pp. 1001−1016. https://doi.org/10.1016/j.mcm.2007.03.023
SAATY, T. L. (2008), ‘Decision making with the analytic hierarchy process’, International Journal Services Sciences, 1 (1), pp. 83−98.
SAATY, T. L. and KEARNS, K. P. (1985), Analytical Planning. The Organization of System, Oxford, UK: Pergamon Press.
SENDZIMIR FOUNDATION, A Report From the Project ‘Count on Green’. https://uslugiekosystemow.pl/wp-content/uploads/2017/08/report_count_on_green.pdf [accessed on: 20.01.2022].
SOKOŁOWICZ, M. (2017), ‘Udogodnienia miejskie – element publicznego wymiaru zasobów mieszkaniowych’, Folia Oeconomica Acta Universitatis Lodziensis, 6 (332), pp. 125−142. http://dx.doi.org/10.18778/0208-6018.332.09
TOŁWIŃSKI, T. (1963), Urbanistyka. Tom III Zieleń w urbanistyce, Warszawa: Państwowe Wydawnictwo Naukowe.
WRÓBLEWSKI, W. and KROC, T. (2022), ‘Współczesne podejście do terenów zieleni w mieście a ich utrzymanie i rozwój w Łodzi’, Builder, 294 (1), pp. 9−11. https://doi.org/10.5604/01.3001.0015.5802
XIAO, Y., LI, Z. and WEBSTER, Ch. (2016), ‘Estimating the mediating effect of privately-supplied green space on the relationship between urban public green space and property value: Evidence from Shanghai, China’, Land Use Policy, 54, pp. 439−447. https://10.1016/j.landusepol.2016.03.001
YAMU, C. and FRANKHAUSER, P. (2015), ‘Spatial accessibility to amenities, natural areas and urban green spaces: using a multiscale, multifractal simulation model for managing urban sprawl’, Environment & Planning B: Planning & Design, 42 (6), pp. 1054−1078. https://10.1068/b130171p
YUE, Z. (2011), ‘A method for group decision-making based on determining weights of decision makers using TOPSIS’, Applied Mathematical Modelling, 35 (4), pp. 1926−1936.
ZACHARIASZ, A. (2006), Zieleń jako współczesny czynnik miastotwórczy ze szczególnym uwzględnieniem roli parków publicznych, Kraków: Wydawnictwo Politechniki Krakowskiej.
 |