

Abstract. In the present study the authors examined the spatial disparities of the Visegrad four countries to see whether the lasting cooperation of the four countries resulted in harmonious economic development or increasing gaps between the years 2000 and 2018. Based on the research results it can be concluded that regional disparities between core and periphery regions of V4 countries still have not been eliminated to a significant extent. Despite the fact that the Visegrad Group has been in the EU for 18 years, the catching-up of its regions occurred with various speed, and no harmonised development can be observed within the Group.
Key words: regional inequality, national-level inequality, Visegrad Group, Theil index.
Regional economic divergence has become a threat to economic progress, social cohesion, and political stability in Europe. Market processes and policies that are supposed to spread prosperity and opportunity are no longer sufficiently effective. Both mainstream and heterodox theories have gaps in their ability to explain the existence of these different regional trajectories and the weakness of the convergence processes among them (Iammarino et al., 2019). It has been also stated that many efforts have already been made and several ideas have been promoted to solve the problems in the development of socially and economically underprivileged, peripheral areas. The process of European integration has influenced the growth potential of all regions across Europe. However, there have been very diverse development trajectories in different groups of countries. After their accession to the EU, Central and Eastern EU countries have followed a relatively common development path.
Our research focuses on the analysis of regional inequalities within the Visegrad Group (also referred to as V4 including Czechia, Slovakia, Poland, and Hungary). The Visegrad Four (the focus area of our research) has had a long history, having strong cooperation in the field of economics, society, culture, trade, as well as political cooperation.
In this study, based on the data for the period from 2000 to 2018, we intended to see the economic tendencies of the regions within the Visegrad countries to see the recent economic processes and the possible effects of the EU development funds used by the countries, as well as to provide a basis for future strategies. One has to mention the fact that our research was intended to be a continuation of a previous research in which also regional disparities of Visegrad countries were examined for the period 1995–2014 (Neszmélyi et al., 2016), although with different methodology, but we reflect on it at certain parts of our study.
From geographical point of view, the countries in question are located in the heart of Europe. Hungary and Czechia are landlocked, thus road, railroad and inland water (river) transportation networks play an important role in their economies. The geographical basis is really predominant for any kind of further economic, social, and developmental analyses as this is the physical space where people live, companies must operate, and the characteristics of the geographical endowments influence the overall performance (Kozák et al., 2019) and merely the development potentials of a certain region. In the case of the Visegrad countries, the “inherited” characteristics have to be indicated, which also might enlighten the reasons for the regional inequalities and large discrepancies one can observe in the regional competitiveness of the four countries. Ženka et al. (2012) have argued that some of the competitiveness factors can be the fact that population density in Central European regions is lower than in Western European ones. The basis of their economies, the size of their domestic markets, and the intensity of spatial economic activity are also significantly smaller. If we look back in history, in the Visegrad Group there has always been a spectacular difference in economic performance between the Western and Eastern regions, having more developed regions close to Western European borders. In parallel, in Central Europe, it is also a common phenomenon to have significant economic and social inequalities between urban and rural areas, while the non-metropolitan regions are rather homogenous (Ženka et al., 2012).
In V4 countries, capital cities traditionally play a dominant role in the economy. Capitals absorb an overwhelming part of the FDI inflow, financial, business, and academic activities are concentrated there, and their GDP per capita is much higher than the national averages are (Rechnitzer et al., 2019).
In the transition process of all the four countries significant regional disparities could be seen, as in all former socialist countries in terms of production decline, unemployment, and foreign direct investment (FDI) indicators (Bod et al., 2021).
Psycharis et al. (2020), Tello et al. (2019), and Burger and Šlampiaková (2021) have also highlighted the role of metropolitan areas in increasing regional inequalities in Central-Eastern Europe saying that nowadays cutting-edge technologies are more knowledge-intensive than the traditional ones and they are based on highly skilled workers and aim at the exploitation of R&D networks.
Excluding Slovakia, the three-layer regional competitiveness formation was characteristic to the other V4 members. The first layer means the capital city regions that reach the level of the developed regions of the EU. The second layer comprises the regions of Czechia, Western Slovakia, North-West Hungary, and Polish metropolitan regions. The third layer comprises the rest, mostly the Eastern regions of Poland, Slovakia, and Hungary. The first layer is attributed by knowledge based sectors, the second layer is by export industries and commercial services, while in the third layer competitiveness is missing in general (Korec, 2014).
Analysts of PMR Consulting have used a model to estimate the influence of individual location factors, while also considering other variables, such as the changes of the level of industrialisation of the region, which was connected to the collapse of unprofitable industrial plants. This model also helped to assess whether the respective factors were statistically significant or not (Burda, 2013).
It was also specified that the dispersion indicator of regional GDP/inhabitant (at NUTS 2 level) decreased in the entire EU27 from 2001 to 2007 and this showed a process of convergence. Regional disparities increased in the newest EU Member States, including the Visegrad countries (Kutscherauer et al., 2010).
Additionally, Enyedi (2009) has found that regions in Hungary have reached three different stages of economic development: Budapest Metropolitan Region (BMR) is a foremost growth pole of the country. It is a real knowledge-based and innovation-generating economic region. North-Western Hungary is in the stage of investment-driven development having a knowledge-user economy without generating it locally. Northern and Eastern Hungary is in a neo-Fordist stage of economic development, where economic restructuring has just started; under-employment and a rural crisis are widespread, with an exception of some larger cities.
Other authors have claimed that during the 2000s there was a regional divergence in the income distribution in Polish regions. This was confirmed by an analysis based on two traditional concepts of measuring differences in regional development, i.e. sigma and beta divergence (Gurgul and Łach, 2011).
Ratazjac (2011) in his study has indicated that the regions of Eastern Poland metaphorically referred to as “The Eastern Wall” (consisting five voivodeships, which correspond to NUTS 2 units, like Lubelskie, Podkarpackie, Podlaskie, Świętokrzyskie, and Warmia-Mazuria) are among the poorest in Poland and also in the European Union. Its markedly lower level of socio-economic development is a consequence of both exogenous and endogenous factors. Even in the pre-accession period domestic steps were taken to stop its advancing pauperisation, but the region received a new powerful growth stimulus only after Poland had joined the EU.
In the case of Slovakia it was statistically proven that regional disparities significantly increased between 2002 and 2010 – which was the very period when Slovakia was about to introduce the Euro and went through a rapid economic growth process, although the growth was experienced mainly due to the development of Bratislava agglomeration, while rural regions were lagging (Habanik et al., 2013).
Káposzta and Nagy (2015) analysed the progress of the four countries with a special focus on meeting the EUROPE 2020 targets set by the EU. They stated that by 2015 a certain extent of cohesion among the Visegrad countries could be observed but country-specific challenges (e.g. poverty in Poland and Hungary; high percentage of early school leavers in Hungary; low employment rate in Hungary; poor R&D sector in Slovakia) needed to get more emphasis in future strategies. They also stated that economic cooperation needed to be strengthened, national development priorities and directions should be harmonised, and cross-border cooperation had to be encouraged and developed.
Kertész (2004) has also underlined that if an underdeveloped economy starts converging to international averages, in the national economy either the inter-regional differences will grow or the process of their closing up to each other would slow down. In V4 countries, as a result of the economic growth, regional disparities, in terms of economic development, have grown considerably, yet this trend seems to have halted and reversed after reaching a certain level of development.
Therefore, one can see that various aspects have been considered in several studies, from time to time, to reflect the economic processes and the level of convergence in the Visegrad Four. Since the objectives of the four countries are to maintain a strong relation and to maintain harmonised development, it is inevitable to examine what the common and the different tendencies of their economies are.
The economic development of a region can be measured in part by the regional GDP per capita. It is one of the most commonly used indicators in the European Union when measuring economic development and eligibility for development funds. In their research, Neszmélyi et al. (2016) applied the Williamson-hypothesis (Williamson, 1965) and used weighted logarithmic standard deviations (WLSD) in order to measure the territorial differences of the V4 region. A correlation was found between regional differentiation and development, corresponding to the Williamson curve: in regions with a higher GDP per capita, the inner disparities were smaller than in regions with a lower GDP per capita. The idea of regional competitiveness was also stressed by Enyedi (2009) who described the concept in terms of three related economic parameters: (a) GDP per capita; (b) labour productivity; and (c) employment rate. According to Korec (2014), per capita regional GDP is the most often used method of measuring regional economic prosperity. The European Union, for instance, has used this indicator in its assessment of regional disparities and subsequently in the establishment of regional aid convergence rules.
A complex approach was used in this study to examine the internal disparities among the Visegrad-Group Member countries (the Czech Republic, Slovakia, Poland, and Hungary) and the relationship between the centre and the periphery, as well as the dynamics of economic growth and development, as well as the prospects for integration. The following main hypotheses have guided the preparation of the examination of the territorial differences at NUTS2 level territorial units of the V4 countries:
There are three common measures of inequality: the Gini coefficient, the coefficient of variation, and the Theil index (Theil, 1967). In this study, for reasons of the allotted space for the article, the Theil index has been chosen to measure territorial inequalities. This index belongs to the so-called general entropy (GE) class of inequality measures. We chose the relative index because the maximum value of the non-relative Theil index is equal to ln(n). Thus, as the number of regions differs from one Visegrad 4 country to another, the maximum value of the index would not have been the same, which would have made the comparison difficult. The relative Theil index (Bellù and Liberati, 2006) is not defined in the value of the indicator equals zero, and has 1 as upper limit.
Agreeing with Glushenko’s (2017) findings, the population-weighted indices were used to measure inequality on the national level, to assess the regional inequalities, we applied the unweighted measures. The unweighted relative Theil index (Bellù and Liberati, 2006) can be written as:
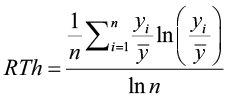 (1)
(1)
where:
i = the i-th region, i = 1, 2, …, n;
yi = the value of the examined indicator in the i-th region; and
y = the arithmetic average of regional values of the examined indicators.
The population-weighted counterpart of the relative Theil inequality index (based on Glushenko, 2017) takes the form:
 (2)
(2)
where:
fi = population of the i-th region;

= total population of the country or total population of the Visegrad group;
yw = the weighted average of regional values of the examined indicators for the country or for the Visegrad Group.
The Eurostat’s Regional Database provides research data on about 37 regions of the Visegrad group countries. Some data sets for certain years were not available, especially for Poland.
The following indicators were included in the study:
Traditionally, GDP per capita is used to assess regional inequalities (Barrios and Strobl, 2009; Kallioras, 2010; Muštra and Škrabić, 2014; Psycharis et al., 2020) but GDP is only a limited metric for measuring economic development and is useless for measuring quality of life. In this study, we selected indicators to reflect the input (motorway density, and GERD) and output (GDP per capita, unemployment rate, and disposable income) levels, as well as the outcomes (life expectancy).
Per capita Purchasing Power Standard (PPS) is the monetary value of all final goods and services produced by an economy within a given period (EUROSTAT 2022). According to Purchasing Power Standards (PPS), GDP per inhabitant is expressed in relation to the European Union (EU28) with an average of 100.
The source for the regional labour market data needed for calculating unemployment rates down to NUTS level 2 is the EU Labour Force Survey (EU-LFS). Surveys of households are conducted quarterly in all EU Member States, the United Kingdom, EFTA countries, and candidate countries. In actuality, life expectancy at birth describes the average number of years a new-born will live as long as mortality trends remain the same as when the baby was born. Private households’ disposable income consists of the difference between primary income (operating surplus or mixed income plus employee compensation minus property income paid) and redistribution of income in cash. In terms of R&D spending, the share of R&D (Gross domestic expenditure on R&D) financed by industry, government, higher education, and private non-profits is the intramural R&D expenditure (GERD). To measure the level of transport infrastructure, we chose the motorway density, which is expressed in kilometres per square kilometre.
The examined period varies depending on the available data: 2000–2018 for the GDP (PPS) data, 2000–2019 for the unemployment rate, 2014–2018 for life expectancy at birth, 2010–2017 for disposable income of private households, and the 2017 and 2018 data for intramural R&D expenditure. The transport infrastructure (motorway density) was examined based on the latest 2018 data. ArcGIS Pro application was used to create maps to reflect regional inequalities regarding the examined indicators. Population-weighted indices measure inequality at the national (or Visegrad group) level, and unweighted indices can be used to measure inequality among regions. The Theil index volatility was measured using the relative standard deviation (RSD) calculated for the examined period.
Having examined the lowest and the highest regional values, moreover the development of national averages, it can be seen that the regional disparities have not diminished in Visegrad countries (Fig. 1). It is typical for all the Visegrad countries that the national average is closer to the lowest value of regional development while the highest value of regional development is more distant from the national average. It means that in all the Visegrad countries there are outstandingly developed regions located, namely the capital regions. In all of the V4 countries the gap between the capital regions and the least developed region widened during the examined period. Most of the Visegrad countries are historically one-centered countries (except Poland), meaning that the capitals have always played significant role in the lives of the countries and this is reflected by the results of our analysis as well.
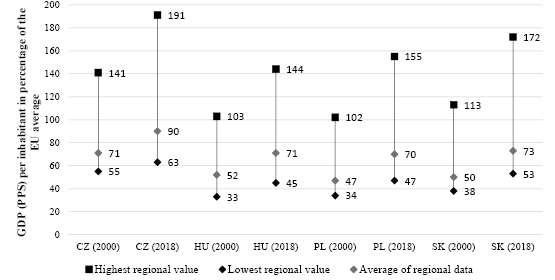
Fig. 1. Regional differences in the values of the GDP (PPS) per inhabitant in the percentage of the EU average in the Visegrad Countries in 2000 and 2018
Source: own work based on data from Eurostat (2000), data code: nama_10r_2gdp.
Fig. 2 shows that in the course of the examined 18 years, four regions in Poland and additional three regions in Hungary were unable to close the gap to the other regions. In the abovementioned regions, the per capita GDP did not even exceed 50% of the EU average in 2018. While in 2000, the gap in terms of the level of development between the capital and rural regions was robust, by 2018 – even though the economic supremacy of the capital regions still sustained – a number of rural regions managed to reduce their backwardness behind state capitals.
Within the Visegrad group it was Czechia where the highest number of regions could exceed 70% of the EU 28 average. It was also typical that the process of closing the gap of the Eastern regions of the V4 was slower. In terms of per capita GDP, the biggest regional disparities could be observed in Slovakia. However, the largest disparity at the national level was observed in Hungary between 2004–2014, as well as in 2018. Measuring at both regional and national levels, the most moderate disparities in terms of GDP were measured in Poland (Table 1). Theil indices are presented here and below for the first and last years of the period studied. When measuring regional inequalities, the highest volatility is observed in the Slovak (%RSD = 9.25) and Hungarian (%RSD = 12.42) data. Time-wise volatility in the national level inequality is higher as well for Slovakia (%RSD = 11.92) and Hungary (%RSD = 11.36). In the case of the Hungarian data, however, volatility measured at the national level is lower compared to the values measuring inequality among regions. At both regional and national levels, the variability of Theil index values for the period 2000–2018 is low in Visegrad countries.
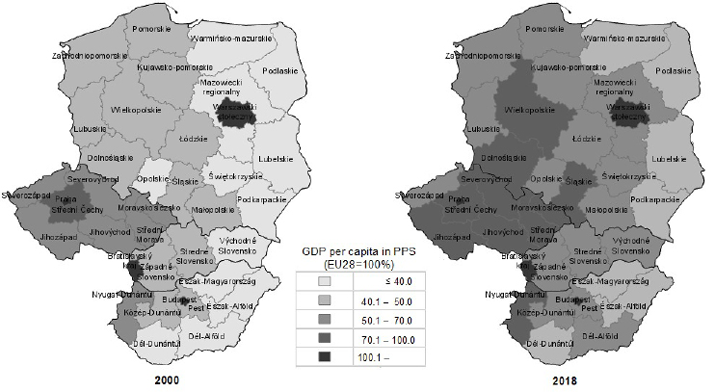
Fig. 2. Comparing the regions of the Visegrad countries based on the values of the GDP (PPS) per inhabitant in the percentage of the EU average in 2000 and 2018
Source: own work based on data from Eurostat (2000), data code: nama_10r_2gdp.
| Index | Country | 2000 | 2018 | RSD% (2000–2018) |
|---|---|---|---|---|
| relative Theil index (unweighted) | CZ | 0.026 | 0.035 | 7.81 |
| HU | 0.038 | 0.041 | 12.42 | |
| PL | 0.016 | 0.019 | 7.13 | |
| SK | 0.088 | 0.100 | 9.25 | |
| V4 | 0.023 | 0.024 | 7.03 | |
| relative Theil index (weighted) | CZ | 0.049 | 0.070 | 7.85 |
| HU | 0.092 | 0.104 | 11.36 | |
| PL | 0.053 | 0.058 | 7.76 | |
| SK | 0.075 | 0.099 | 11.92 | |
| V4 | 0.072 | 0.075 | 5.26 |
In the paper we intended to cover the years 2000–2018, but since unemployment rate data was available for the year 2019 as well, we decided to also include that year in the analysis. Unfortunately, for the rest of the indicators, we were not able to collect the 2019 data, so we continued to focus on the period 2000–2018. According to Fig. 3, from 2000 to 2019, regional differences have merely diminished in terms of unemployment in V4. In 2019, there were only 5 regions in which unemployment rate was higher than 5%, out of which one region (Northern Great Plain) was in Hungary, while there were 2 such regions in Slovakia (Stredné Slovensko, Vychodné Slovensko) and 2 in Poland (Lubelskie, Podkarpackie). The largest territorial differences in this respect could be found in Slovakia, while in all the three examined countries a peak could be observed in terms of the inequality index in 2008. As there was insufficient data available from Poland, this examination could not be extended to Poland.
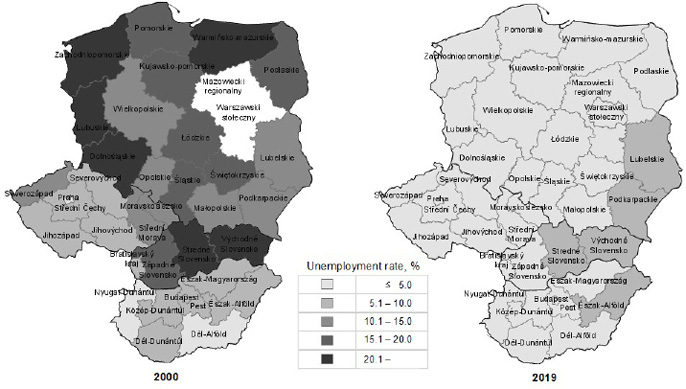
Fig. 3. Comparing the regions of the Visegrad countries based on the unemployment rates in 2000, 2019
Note: incomplete data for the Mazowiecki and Warszawski regions of Poland in 2000
Source: own work based on data from Eurostat (2020), data codes: lfst_r_lfu3rt.
In Visegrad countries, based on the unemployment rates at both the regional and national levels, the variability of the Theil index values for the 2000–2018 period was high (Table 2). On the basis of unweighted Theil index values measuring regional inequality, Poland (RSD%=46.76) and Hungary (RSD%=44.72) had the highest variability. Slovakia had the highest regional disparity in both 2000 and 2018. In 2000, the Czech Republic and in 2018, Slovakia had the highest inequality at the national level in terms of the weighted Theil index.
Regarding life expectancy, among the V4 regions, a Hungarian region had the worst indicator value (Northern Hungary) in both years, 2014 and 2018. According to data, in six other Hungarian regions (out of 8), life expectancy at birth did not exceed 77 years in 2018. Only in four regions of Poland (out of 17) the value of the indicator did not exceed 77 years. Thus, out of the 11 regions with the most unfavourable value of the indicator, 7 regions were Hungarian and 4 were Polish in 2018. The value of Theil index, calculated at both regional and national levels, increased in the case of Hungary and by 2018 reached the highest value among the V4 countries (Table 3). In Slovakia, the unweighted Theil index values measuring regional inequality were highly variable for the 2014–2018 period. In terms of measuring nation-wide disparity, Czechia had the highest variability of Theil index values.
| Index | Country | 2000 | 2018 | RSD% (2000–2018) |
|---|---|---|---|---|
| relative Theil index (unweighted) | CZ | 0.040 | 0.034 | 28.45 |
| HU | 0.024 | 0.043 | 44.72 | |
| PL | 0.005a | 0.014a | 46.76 | |
| SK | 0.054 | 0.078 | 25.87 | |
| V4 | 0.013a | 0.028a | 31.67 | |
| relative Theil index (weighted) | CZ | 0.041 | 0.039 | 30.61 |
| HU | 0.029 | 0.057 | 35.89 | |
| PL | 0.008a | 0.015a | 40.10 | |
| SK | 0.037 | 0.068 | 31.85 | |
| V4 | 0.011a | 0.026a | 34.98 |
| Index | Country | 2014 | 2018 | RSD% (2014–2018) |
|---|---|---|---|---|
| relative Theil index (unweighted) | CZ | 0.00004 | 0.00004 | 5.24 |
| HU | 0.00005 | 0.00005 | 7.43 | |
| PL | 0.00002 | 0.00002 | 6.86 | |
| SK | 0.00004 | 0.00003 | 29.55 | |
| V4 | 0.00004 | 0.00004 | 3.40 | |
| relative Theil index (weighted) | CZ | 0.00023 | 0.00016 | 67.90 |
| HU | 0.00013 | 0.00067 | 41.89 | |
| PL | 0.00007 | 0.00020 | 66.68 | |
| SK | 0.00006 | 0.00033 | 52.71 | |
| V4 | 0.00004 | 0.00003 | 3.41 |
Regarding disposable income, in 2010, four out of the five regions of the Visegrad countries with the lowest disposable income (not exceeding 8,000 euros) were located in Hungary (Fig. 4). By 2017, three of the five regions with the lowest disposable income (not exceeding 10,000 euros) still belonged to Hungary. Both regional and national inequality values, measured by Theil index, were exceptionally high in Slovakia (Fig. 5). For the other three countries studied, the inequality values did not differ significantly.

Fig. 4. Comparing the regions of the Visegrad Countries based on the disposable income of private households in 2010 and 2017
Source: own work based on data from Eurostat (2020), data codes: tgs00026.

Fig. 5. Trends in regional disparities in disposable income of private households for the Visegrad countries, 2010−2017
Source: own work based on data from Eurostat (2020), data codes: tgs00026.
According to Fig. 5, in 2011, the Hungarian value jumped, both in regional and national inequality, even if by 2017, it had the lowest inequalities in the disposable income among the V4 countries, measured at both the regional and national levels.
We examined regional differences in terms of R&D expenditures from two approaches: in terms of per capita expenditures (Fig. 6) in euros and in percentage of GDP (Fig. 7). As data in full time series was not available, we had to limit our analysis to the years 2017 and 2018. Out of the regions of the V4 countries with the lowest value of intramural R&D expenditure (not higher than 70 euros per inhabitant), one region was in Czechia and one in Slovakia, two regions in Hungary, and eight in Poland in 2018.

Fig. 6. GERD values in V4 (NUTS-2) regions (per capita EUR) in 2017 and 2018
Source: own work based on data from Eurostat (2020), data code: rd_e_gerdreg.
The value of the indicator as percentage of GDP did not exceed 0.5% in only one Czech region (Severozápad), one Slovak region (Východné Slovensko), and two Polish regions (Lubuskie and Mazowieckie). The results showed that in the case of the per capita indicator the territorial differences were larger both at national and regional levels (Table 5). The weighted and unweighted index-values did not show significant differences in the case of the per capita values which refers to the fact that differences at national and regional levels are of similar extent. Based on the result of the Wilcoxon test it could be proved only in the case of Czechia that the difference among regions exceeded the average value of differences measured at the national level, both in absolute (euro per capita, Z=2.214, p=0.027) and relative (percentage of GDP, Z=-2.207, p=0.027) values. The highest and lowest values of both in euros per capita and in percentage of GDP measured GERD were in the Czech Republic: Prague had the highest value among the V4 countries (1,110.5 euros per capita, 2.68%) and Severozápad had the lowest value (45.4 euros per capita, 0.33%).
Index |
Country |
Intramural R&D expenditure (GERD), Euro per inhabitant |
Intramural R&D expenditure (GERD), percentage of GDP | ||
|---|---|---|---|---|---|
2017 |
2018 |
2017 |
2018 | ||
relative Theil index (unweighted) |
CZ |
0.142 |
0.140 |
0.058 |
0.055 |
HU |
0.228 |
0.216 |
0.061 |
0.054 | |
PL |
0.156 |
0.137 |
0.060 |
0.049 | |
SK |
0.362 |
0.324 |
0.082 |
0.068 | |
V4 |
0.139 |
0.127 |
0.050 |
0.043 | |
relative Theil index (weighted) |
CZ |
0.130 |
0.128 |
0.009 |
0.008 |
HU |
0.232 |
0.222 |
0.034 |
0.035 | |
PL |
0.148 |
0.133 |
0.007 |
0.003 | |
SK |
0.340 |
0.296 |
0.080 |
0.073 | |
V4 |
0.129 |
0.119 |
0.049 |
0.043 | |
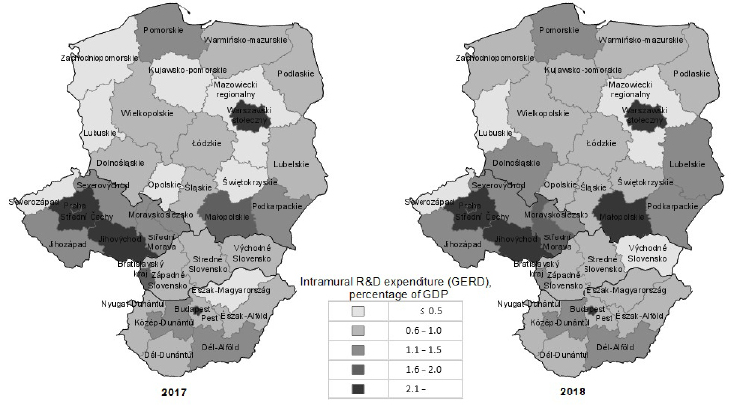
Fig. 7. GERD values in V4 (NUTS-2) regions (in percentage of GDP) in 2017 and 2018
Source: own work based on data from Eurostat (2020), data code: rd_e_gerdreg.
Regarding the transportation infrastructure, we can see that Budapest had the highest motorway density (120 kilometres per square kilometres) compared to the other NUTS2 regions (Fig. 8). Eight out of nine regions with the lowest values (not exceeding 4 kilometres per square kilometres) of the motorway density were located in Poland, making those regions less attractive for foreign direct capital and investments. It has been agreed that the motorway density has both positive and negative impacts on investments, the settlement of businesses, and the density of qualified human resource, but it is surely an important requirement.

Fig. 8. Comparing the regions of the Visegrad Countries based on the motorway density (km per 1,000 square km)
Note: data for the Mazowieckie Voivodeship macro region (PL9) of Poland was used as the regional value for Poland’s regions of Warsaw (the capital city) (PL91) and Mazowiecki (regional) (PL92)
Source: own work based on data from Eurostat (2020), data code: tran_r_net.
In terms of the extent of regional disparities, Slovakia has the largest regional disparity in the road network indicator (Fig. 9). The highest value of inequality, measured at the national level, was in Poland, which is not surprising since most of the regions with the lowest density can be found in that country. Due to the above-mentioned infrastructural disparities, only integrated complex development strategies can help to mitigate the existing accessibility challenges.
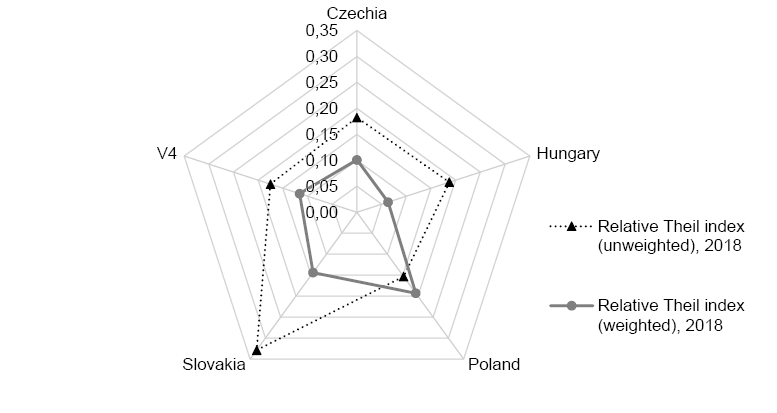
Fig. 9. Estimate of inequalities in the motorway density (km per 1000 square km) in the Visegrad countries
Source: own work based on data from Eurostat (2020), data code: tran_r_net.
In our research we examined the peculiar way of the development of the Visegrad Four and in the frames of this we analysed the state of regional disparities, and the centre vs. periphery relationship of the recent years at macro-region (NUTS 2) level. By using the applied mathematical-statistical analytical methods we succeeded to partially verify our first hypothesis (H1). It means that the disparities between the core (capital) and periphery (rural) regions are still high, especially in the case of eastern regions. However, in the case of other regions – in all four countries – there were regions which could get closer to the core regions in terms of the examined parameters. Additionally, our results seem to be confirmed by empirical information and facts as well. In terms of our other hypothesis (H2), i.e. that interregional disparities are positively related to the state of economic development of countries, we found it unproven. Poland had the lowest regional disparities for most of the indicators examined (four out of seven). Slovakia had the highest regional inequality according to five indicators. In terms of the GDP (PPS) per inhabitant as a percentage of the EU average in 2018, Slovakia was second after Czechia and Poland was fourth among the Visegrad countries. It would be interesting to examine the relationship between the state of economic development of the regions and their inner regional disparities. However, to address this issue, data at NUTS 3 or LAU 1 levels is needed.
As one of the most important conclusions, we need to state that despite the fact that the Visegrad Group has been in the European Union for 18 years, the closing of the gap in its regions happened with various speed, and no harmonised development can be observed within the Group. Moreover, in many regions the process of closing the gap cannot be even proved unequivocally.
We need to highlight the fact that our outcomes coincide with the results of other authors as it could even be seen in the bibliographic overview of our paper. Therefore, our results and conclusions are merely in harmony with them. We need to agree with others that though the role and importance of the EU’s cohesion policy and instruments cannot be questioned, they cannot replace national development policies and own development strategies of the regions that could address the mitigation of the discrepancies.
Therefore, in order to propel the lagging regions (especially in the eastern parts of the Visegrad countries) onto a speedier trajectory of development, more target-oriented development programmes are needed in harmony with the European Union’s cohesion policy priorities and instruments, like the European Regional Development Fund or the European Territorial Cooperation programmes. We can observe similar tendencies in regions across the borders within the Visegrad group, which means that the role of cross-border initiatives must get more attention in policy making. It is also recommended to elaborate an incentive system for FDI investors to deploy not only manufacturing job-creating plants but also investments that can bring about an increase in the added value and R&D activities. This may be more efficient by clustering with local suppliers and subcontractors, and also by a win-win type of integration between companies, and education and research centres. Multinational companies are able to generate sustainable growth in the regions in which they settle if they emulate the increasing rate of embeddedness in the local economy. While there are promising examples (e.g. Daimler-Benz and Neumann János University in Kecskemét, Hungary), we believe there are still too many white spots to be covered by similar initiatives to accelerate the process of closing the gaps and to diminish the regional disparities.
Despite the fact that this study has its limitations, it was intended to contribute to the group of studies that focus on the existing regional discrepancies within the Visegrad Group, as well as the need for strategies aiming at the mitigation of regional economic and social inequalities. Since the convergence of the four countries is the key to sustainable development, future studies are needed to find out more about region-specific resources and potentials.
AMOS, O. M. (1988), ‘Unbalanced regional growth and regional income inequality in the latter stage of development’, Regional Science and Urban Economics, 18 (4), pp. 549–566. https://doi.org/10.1016/0166-0462(88)90026-9
BARRIOS, S. and STROBL, E. (2009), ‘The dynamics of regional inequalities’, Regional Science and Urban Economics, 39 (5), pp. 575–591. https://doi.org/10.1016/j.regsciurbeco.2009.03.008
BELLÚ, L. G. and LIBERATI, P. (2006), ‘Describing income inequality: Theil index and entropy class indexes’, Food and Agriculture Organization of the United Nations, EASYPol, Module 051, http://www.fao.org/3/am343e/am343e.pdf [accessed on: 18.10.2020].
BITE, P., KONCZOSNÉ, SZ. M. and Vasa, L. (2020), ‘The Concept of Labour Migration from the Perspective of Central and Eastern Europe’, Economics and Sociology, 13 (1), pp. 197–216. https://doi.org/10.14254/2071-789X.2020/13-1/13
BOD, P. Á., PÓCSIK, O. and NESZMÉLYI, Gy. I. (2021), ‘Varieties of euro adoption strategies in Visegrad countries before the pandemic crisis’, Acta Oeconomica, 71 (4), pp. 519–550. https://doi.org/10.1556/032.2021.00038
BURDA, A. (2013), Why some regions of Poland develop faster than others, PMR Consulting, February 2013, p. 7, http://www.pmrconsulting.com/userfiles/file/wp/Why_some_regions_of-Pl_03.pdf [accessed on: 08.07.2016].
BURGER, P. and ŠLAMPIAKOVÁ, L. (2021), ‘The Effect of Sectoral Division on GDP per Capita in the Slovak Republic’, E&M Economics and Management, 24 (1), pp. 21–37. https://doi.org/10.15240/tul/001/2021-1-002
DAVIES, S. and HALLETT, M. (2002), Interactions between National and Regional Development, Hamburgisches Welt-Wirtschafts-Archiv (HWWA), Hamburg: Hamburg Institute of Regional Economics, p. 30. https://doi.org/10.22004/ag.econ.26187
ENYEDI, Gy. (2009), ‘Competitiveness of the Hungarian regions’, Hungarian Geographical Bulletin, 58 (1), pp. 33–48.
EUROSTAT (2020), First population estimates – EU population in 2020: almost 448 million – More deaths than births, https://ec.europa.eu/eurostat/documents/2995521/11081093/3-10072020-AP-EN.pdf/d2f799bf-4412-05cc-a357-7b49b93615f1 [accessed on: 29.03.2021].
EUROSTAT (2022), Annual national accounts (nama10): Reference Metadata in Euro SDMX Metadata Structure (ESMS), https://ec.europa.eu/eurostat/cache/metadata/en/nama10_esms.htm [accessed on: 04.05.2022].
GLUSCHENKO, K. (2018), ‘Measuring regional inequality: to weight or not to weight?’, Spatial Economic Analysis, 13 (1), pp. 36–59. https://doi.org/10.1080/17421772.2017.1343491
GURUL, H. and LACH, Ł. (2011), ‘The impact of regional disparities on economic growth’, Operations Research and Decisions, 21 (2), pp.17–43.
HABANIK, J., HOSTAK, P. and KUTIK, J. (2013), ‘Economic and Social Disparity Development Within Regional Development of the Slovak Republic’, Economics and Management, 18 (3), pp. 457–464. https://doi.org/10.5755/j01.em.18.3.4203
IAMMARINO, S., RODRIGEZ-POSE, A. and STORPER, M. (2019), ‘Regional inequality in Europe: evidence, theory and policy implications’, Journal of Economic Geography, 19 (2), pp. 273–298. https://doi.org/10.1093/jeg/lby021
KALLIORAS, D. (2010), ‘Regional Inequalities in the New European Union Member-States: Is there a ‘Population-Size’ Effect?’, European Spatial Research and Policy, 17 (2), pp. 107–116. https://doi.org/10.2478/s10105-010-0013-5
KÁPOSZTA, J. and NAGY, H. (2015), ‘Status Report about the Progess of the Visegrad Countries in Relation to Europe 2020 Targets’, European Spatial Research and Policy, 22 (1), pp. 81–99. https://doi.org/10.1515/esrp-2015-0018
KERTÉSZ, K. (2004), ‘A nemzeti és a regionális felzárkózás váltómozgása az EU országokban és Magyarországon’, Külgazdaság, 47 (2), pp. 65–76.
KOREC, P. (2014), ‘Lagging regions of Slovakia in the context of their competitiveness’, Rozwój Regionalny i Politika Regionalna, 25, pp. 113–133. https://doi.org/10.14746/rrpr.2014.25.07
KOZÁK, T., KÁRPÁTI, L. and KOVÁCS, A. (2019), ‘New Approach of Trading Area Definition’, [in:] KARLOVITZ, T. J. (ed.), New Researches from Business Studies Komárno, Slovakia: International Research Institute, pp. 24–32. http://www.irisro.org/economics2019january/12KarpatiLaszlo-etal.pdf
KOZÁR, L. (2012), ‘Rural Development Based on Market Institutes’, International Journal of Environmental, Cultural, Economic And Social Sustainability Annual Review, 7 (6), pp. 221–234. https://doi.org/10.18848/1832-2077/CGP/v07i06/55013
KUTSCHERAUER, A., FACHINELLI, H., SUCHÁČEK, J., SKOKAN, K., HUČKA, M., TULEJA, P. and TOMÁNEK, P. (2010), Regional Disparities – Disparities in country regional development – concept, theory, identification and assessment (Shortened English version), Ostrava: VŠB-Technical University of Ostrava, Faculty of Economics, p. 120, http://disparity.idealnihosting.cz/edice_cd/cd11_regdis_mono_angl/pdf/Regional%20disparities.pdf [accessed on: 8.07.2016].
MUŠTRA, V. and ŠKRABIĆ, B. (2014, March), ‘Regional inequalities in the European Union and the role of institutions’, [in:] Review of Urban & Regional Development Studies: Journal of the Applied Regional Science Conference, 26 (1), pp. 20–39. https://doi.org/10.1111/rurd.12017
NESZMÉLYI, Gy., LAMPERTNÉ AKÓCSI, I. and BRUDER, E. (2016), ‘The evolution of the regional disparities in the Visegrad group in the years 1995–2014’, Geografický Časopis [Geographical Journal], 68 (4), pp. 283–299.
NYUSZTAY, L. (2014), ‘Regional, Sub-regional initiatives in the European Political Co-operation. Case Study: The Experiences of the Visegrad-four in the First Two Decades’ (In Hungarian: Regionális, szubregionális kezdeményezések szerepe az európai politikai együttműködésben. Esettanulmány: A Visegrádi Négyek Első Két Évtizedének Tapasztalata), [in:] NYUSZTAY, L. (ed.), Tanulmányok az Európai Politikai Együttműködésről. (Studies on the European Political Co-operation), Budapest: Budapest Business School, Faculty of College of International Management and Business, pp. 317–359.
PSYCHARIS, Y., KALLIORAS, D. and PANTAZIS, P. (2020), ‘Regional Inequalities in Central and Eastern European Countries: The Role of Capital Regions and Metropolitan Areas’, [in:] ŚLIWINSKI, A., POLYCHRONIDOU, P. and KARASAVVOGLOU, A. (eds.), Economic Development and Financial Markets. Contributions to Economics, Cham: Springer. https://doi.org/10.1007/978-3-030-32426-1_1
RATAZJAC, W. (2011), Eastern Poland: a belt of poor regions XL Incontro di Studio del Ce.S.E.T. AESTIMUM, Firenze University Press, pp. 17–33, http://www.fupress.net/index.php/ceset/article/download/10694/10091 [accessed on: 08.07.2016]. https://doi.org/10.13128/Aestimum-10694
RECHNITZER, J., BERKES, J. and FILEP, B. (2019), ‘The most important city development initiatives of Hungary’, Regional Statistics, 9 (2), pp. 20–44. https://doi.org/10.15196/RS090204
SEPTIMIU, S. (2020), Transition to Industry 4.0 in the Visegrád Countries. Economic brief 052 June 2020, European Commission, p. 12, https://ec.europa.eu/info/sites/info/files/economy-finance/eb052_en.pdf [accessed on: 2.03.2021]. https://doi.org/10.2765/186295
SMETKOWSKI, M. (2014), Regional disparities and development dynamics of CEE regions in the period of prosperity and austerity, GRINCOH Working Paper Series, Paper No. 6.02.01, p. 19, http://www.grincoh.eu/media/serie_6_spaces__territories_and_regions/grincoh_wp6.02.01_smetkowski.pdf [accessed on: 08.07.2016].
SZÖRFI, B. (2006), Regional inequalities in the European Union: Testing the Williamson-curve hypothesis with different methods in presence of serial correlation, Budapest: Central European University, Economic Development.
THEIL, H. (1967), Economics and Information Theory, Amsterdam: North-Holland.
WILLIAMSON, J. G. (1965), ‘Regional Inequality and the Process of National Development: A Description of the Patterns’, Economic Development and Cultural Change, 13 (4), Part II (July 1965), Supplement, p. 84.
ŽENKA, J., NOVOTNY, J. and CSANK, P. (2012), ‘Regional Competitiveness in Central European Countries: In Search of a Useful Conceptual Framework’, European Planning Studies, pp. 1–20. https://doi.org/10.1080/09654313.2012.731042


Received: 7.02.2022. Revised: 26.03.2022. Accepted: 10.05.2022.