Jerzy Korzeniewski
Patrycja Melon
The Development of Islamic Banking in the UK – A Comparison of Islamic and Conventional Banking
Summary
The purpose of the article is to compare the development of several Islamic banks and conventional banks operating in the UK in 2014–2021. A statistical method of linear ordering of objects characterized by several variables, which is simple in interpretation, was used. The main difficulty was to take into account the time-varying quotation of the values of the considered variables. A novel method was proposed to take into account both the value of several variable and their variability over time. In this method, the emphasis can be placed on the final reslut, that is, consider only the values of the variables at the beginning and end of the period under study but the smoothness of the systematic development of the bank can be taken into account by placing emphasis on the analysis of the variable-stimulants from year to year. In the obtained ordering, Islamic banks grew more dynamically than conventional banks in all considered configurations of variables.
Keywords: banking, Islamic banking, Sharia
JEL Classification: G21, Z23
Introduction
The origins of modern Islamic banking are traced to the 1960s, when the first Islamic bank, Mit Ghamr Saving House, was established in Egypt in 1963 (Islahi 2018, pp. 418–419). The oil crisis in the 1970s was also an important phenomenon that contributed to the development of Islamic banking. During this period, large amounts of capital began to flow into oil-rich countries. Thanks to oil revenues, most of the Islamic banks operating in the Middle East were established.
The beginning of the 21st century is associated with strong economic and technological growth. During this period, an increase in interest in Islamic finance and its expansion into foreign markets was noticed. The reasons for these phenomena included the awareness of “ethical finance,” the acceleration of globalization processes in the 1990s. (Warde 2004, pp. 48–49) or the bursting of speculative banks in the mortgage market in 2008. (Kasiak, 2016, pp. 25–26) In addition, one of the most important events that sparked the development and expansion of Islamic banking into Europe was the issuance of a license for the Islamic Bank of Britain (Antoniazzi 2022).
The development of Islamic banking and finance in the world can be analyzed based on, among other things, the increasing value of the total assets of Islamic finance in the world. The value of total assets of Islamic finance has increased significantly over the past few years. In 2018, the value exceeded $2.5 trillion and in 2021 the value of Islamic banking assets, reached $3.958 trillion (The Islamic Corporation for the Development of the Private Sector, Refinitiv, Islamic Finance Development Reports 2022). According to projections by the Islamic Corporation for the Development of the Private Sector and Refinitiv, the value of Islamic finance assets could increase to $5.9 trillion in the next five years (The Islamic Corporation for the Development of the Private Sector, Refinitiv 2022). What supports the growth of Islamic banking in the global economy is the increasing number of financial institutions offering Islamic banking products. In 2019, there were 526 entities offering Islamic banking services. Islamic financial products are offered in 74 countries, and the number of financial institutions is increasing every year (ICD – Refinitiv 2020, p. 26).
The purpose of the paper is to compare the development of several Islamic banks and conventional banks operating in the UK from 2014 to 2021, as this country has seen the greatest interest in Islamic banking products and the largest number of institutions in Europe offering Islamic banking products. Development is understood as increasing values of financial variables in different configurations of these variables. Furthermore, ‘increasing’ is understood as ‘increasing from year to year’. In addition, it should be pointed out that the study took efficiency as a measure of development.
Determinants of the development of Islamic banking – a brief overview
In the past two decades, the presence of Islamic banking has become discernible not only in the Middle East and Far East, but also in Europe, Africa or the US. One of the factors determining the development of Islamic banking is the number of Muslims in the world. As I. Sobol points out, it is mainly religious Muslims who are interested in Islamic banking products, which influences the choice of a particular bank (Sobol 2019, p. 205). It should be noted that new Islamic banks are established mainly in countries where there is a large population of Muslims, including countries belonging to the Gulf Cooperation Council – the GCC, i.e. countries where Islam is the dominant religion. According to researchers I. Kurochkina and U. Us, Muslims play an active role in Europe, among others, as skilled personnel familiar with Sharia law (Kurochkina, Us 2019). This is of particular importance, as simultaneously European countries have seen a shortage of cadres familiar with knowledge of Islamic banking and conventional banking.
Another factor that should be pointed out as determining the development of Islamic banking is its ethical nature, which allows to build a positive image of Islamic financial institutions. Under Sharia law, the financial markets in which Islamic institutions operate are regulated. The basic principle of finance and Islamic banking is the prohibition of riba (Ullah, Al-Karaghouli 2017, pp. 6–7). This means that banks are not allowed to charge interest on committed capital. In economic terms, this prohibition means the inability to charge any interest on deposits and loans, as this is considered usury. Another prohibition observed by Islamic institutions is the prohibition of gharar, which mandates the avoidance of uncertainty and prohibits speculation. Speculative transactions that are overly complicated and do not present full information about the subject of the transaction are usually considered gharar (Milenković, Milenković 2016, pp. 67–69). Another important rule that is observed by Muslims is the prohibition of maysir, or gambling. In the context of banking and Islamic finance, maysir is associated with speculation, mainly on derivatives (Sobol 2019, p. 93). In considering Islamic banking, it is also important to point out the prohibition of haram, which is a basic Quranic law. It prohibits banks and other Islamic institutions from engaging in morally questionable activities. Among other things, weapons, drugs, pornography, gambling or pork are considered haram (Asif 2018, p. 94).
The development of Islamic banking in Europe is also linked to oil and gas exporters who are interested in locating their capital in European countries. In the 1970s, the Gulf countries saw a surge in capital from oil sales. The saturated markets of the Gulf countries led to an increase in capital flows to Western markets, including the UK. The increased interest of Muslim countries in the UK, has led to the development of banking services in the country. The UK is characterized by a diverse range of financial services, which translated into an increase in investment in the country (Shafaq 2014). Additionally, an important factor determining the development of Islamic banking in the UK is the support of the authorities and the introduction of appropriate regulations to obtain a banking license to operate.
It is necessary to emphasize that there are also many challenges facing Islamic banking, which Islamic banks have to deal with. In Islamic banking, as in conventional banking, there are risks, among others, bank risk or credit risk. It should be mentioned that Islamic banking also faces an additional risk – non-compliance with Sharia principles. However, the biggest problem for Islamic banks is liquidity risk, which can result from a lack of cooperation between institutions doing business in different countries (Sobol 2015, pp. 193–194). It should be pointed out here that a very important role is played by various organizations, including the Islamic Financial Services Board (IFSB 2023), which creates standards for financial products, thanks to which the procedures that institutions should follow are regulated. Islamic banks are aligned with all the requirements that apply to functioning conventional banks in the country.
Literature review
This study contributes to the existing literature comparing the efficiency of Islamic and conventional banks. Initially, many studies focused mainly on examining the efficiency of conventional banks. However, the proliferation of Islamic banking has led to the emergence of Islamic entities. Therefore, more and more researchers have attempted to compare the efficiency of Islamic banks and conventional banks.
The researchers, such as W. Ahmad and R.H. Lou examined the efficiency of Islamic banks and conventional banks operating in Germany, the UK and Turkey from 2005 to 2008. A non-parametric method called data envelopment analysis (DEA) was used to measure efficiency. Based on the results, the researchers indicated that Islamic banks were more efficient than conventional banks (Ahmad, Luo 2010, pp. 361–389).
It is also worth pointing to a study by M.A.M. Chowdhury and R. Haron, who examined the efficiency of Islamic banks in the Southeast Asian area (Chowdhury, Haron 2021). The researchers focused exclusively on examining the efficiency of 31 Islamic banks. The same was done by the researchers such as R. Rosman, N.A. Wahab and Z. Zainol, who also focused exclusively on Sharia-compliant banks. The Islamic banks from the Middle East and Asia that were surveyed were characterized as moderately efficient (Rosman, Wahab, Zainol 2014, pp. 1–15).
I. Khan, M. Khan and M. Tahir attempted to study the differences in the financial performance of Islamic and conventional banks operating in Pakistan from 2007 to 2014. Five Islamic banks and 19 conventional banks were analyzed using two types of analysis: t-test and logistic regression. Based on the study, the authors concluded that Islamic banks are relatively better in terms of efficiency than conventional banks. They attribute the reasons for this phenomenon to the increased expansion of Islamic banking services in Pakistan (Khan, Khan, Tahir 2017, pp. 419–433).
An attempt to compare the efficiency of Islamic and conventional banks was also made by M.T. Majeed and A. Zanib. They examined the efficiency of full-fledged Islamic banks, Islamic branches of conventional banks and conventional entities from Pakistan from 2007 to 2014 (Majeed, Zanib 2016, pp. 19–32). In turn, S. Ahmad and R.A. Rahman examined the efficiency of Islamic and conventional banks in Malaysia. They analyzed two Sharia-compliant entities and eight conventional banks using the data envelopment approach (DEA). Based on the study, the scholars found that conventional banks had higher efficiency than Islamic banks from 2003 to 2007 (Ahmad, Rahman 2012, pp. 241–263). Researchers like H. Musa et al. examined the economic efficiency of Islamic and conventional banks using the DEA method on the example of 1,460 selected European banks. According to the authors, Islamic banks have higher economic efficiency than conventional banks (Musa, Natorin, Musova, Durana 2020, pp. 29–58).
R.H. Slimen et al. attempted to study the efficiency of 51 conventional banks and 48 Islamic banks operating in the GCC between 2006 and 2015. The study used stochastic frontier analysis and the CIR index (Slimen, Belhaj, Hadriche, Ghroubi 2022). A. Salman H. Nawaz conducted a study to compare two areas of banking i.e., Islamic banking and conventional banking in terms of profitability, liquidity and efficiency. The authors examined whether there are differences in Islamic and conventional banking with regard to the deposits of customers of the banks analyzed. The researchers used ratio analysis and the t-test. Based on the results, A. Salman and H. Nawaz indicated that Islamic banks show better performance than conventional banks (Salman, Nawaz 2013). Also, F. Ismail, M. Shabri Abd. Maijd and R.Ab. Rahim analyzed the efficiency of Islamic and conventional banks. The purpose of the study was to examine the cost efficiency of selected Islamic and conventional banks from 2006 to 2009 in Malaysia. Using data envelopment analysis (DEA), the cost efficiency of banks was examined and then using Tobit regression, the factors that affect the efficiency of Islamic and conventional banks were determined (Ismail, Shabri Abd. Majid, Ab. Rahim 2013).
Background of the research on Islamic and conventional banks operating in the UK
The UK is the country that has seen the greatest growth in Islamic finance and banking in Europe. The British government decided to allow Islamic institutions to expand into the UK. One of the measures taken was the creation of the so-called Islamic Finance Task Force. Its goal was to implement Islamic finance in the country and establish London as the main center of Islamic finance in Europe (UK Trade & Investment 2013). It is worth pointing out that London is considered one of the leading financial centers in the world. According to the Global Financial Centers Index (GFCI), London ranked second in the world. New York took the first place, but the difference in rating was insignificant (Z/Yen Group, Yeandle M., Mainelli M. 2016). In 2022, New York, London and Hong Kong took the top ranking (Statista 2023).
The most important thing for the development of Islamic banking services in the UK was to carry out a reform regarding, among other things, taxation issues, which had been a barrier to the development of Islamic banking in the country. Different taxation rules applied for Islamic financial products than for conventional products. With the changes made, Islamic forms of finance could be treated the same as conventional financial products. An important step was the abolition of double taxation on Islamic mortgage products (UK Trade & Investment 2014). Also what had a significant impact on the development of Islamic finance in the UK were the changes in judicial rulings.
As A. Adamek points out, the UK is characterized by the most developed market for Islamic financial services in the area outside the so-called Islamic world. This is due to causal factors such as (Adamek 2021, p. 130):
- the location and importance of the United Kingdom on the map of Europe and the world;
- an increasing number of Muslims living in the United Kingdom;
- the internal political atmosphere and the regulatory and legal environment, which are conducive to the development of Islamic finance and banking;
- increasing interest in and demand for ethical financial services;
- the education system to foster greater interest in Muslim finance.
As of 2021, there are six Islamic institutions in the UK offering services to individual and corporate clients. The purpose of this study is to compare the development of several Islamic banks and conventional banks operating in the United Kingdom between 2014 and 2021. Five Islamic banks operating in the UK participated in the study and opened their branches in London. At the time, all six entities offering Islamic banking products were operating in London. However, the last institution was not included in the study due to lack of financial data.
Table 1. Characteristics of Islamic banks operating in the United Kingdom
|
Name of the bank |
The year the bank was founded in the UK |
Bank classification (GICS standard*) |
| 1 |
Al Rayan Bank |
2004 |
Commercial banking |
| 2 |
Qatar Islamic Bank Plc |
2003 |
Asset Management |
| 3 |
Gatehouse Bank |
2007 |
Investment banking, investment consulting |
| 4 |
Bank of London and the Middle East Plc |
2006 |
Banks, banking services, diversified banking, commercial banking |
| 5 |
Abu Dhabi Islamic Bank |
2012 |
Investment banking, investment consulting. |
* The classification of banks was based on the GICS – Global Industry Classification Standard.
Source: own elaboration.
Al Rayan Bank is a universal bank established in 2004. It is the first Islamic bank in the UK. The bank was originally called the Islamic Bank of Britain, a name that was changed in 2014 to Al Rayan Bank. Al Rayan Bank’s offerings are addressed mainly to individual customers living in the UK. The bank offers banking products to more than 90,000 individual, business and premium customers. In 2021, it was named the best Islamic bank in the UK (Al Rayan Bank 2023). Taking care of its customers, the Sharia Compliance Department was created with a Sharia Supervisory Committee to ensure that all banking products offered are Sharia compliant. The products offered by Al Rayan Bank include individual savings accounts, term deposits and real estate financing (Al Rayan Bank 2023).
It is worth noting that Al Rayan Bank is the first Islamic bank in the world to publicly issue Islamic bonds (Sukuk) for GBP 250 million in a non-Muslim country. This has strengthened Britain’s position as the center of Islamic finance in Europe (Al Rayan Bank 2023).
Another bank is Qatar Islamic Bank Plc, which is classified as an asset manager. However, it is designated as an Islamic bank operating in a financial center in London because it also conducts lending and deposit operations. Qatar Islamic Bank Plc provides services such as private banking among others, such as current account maintenance and investment contracts and real estate financing (QIB UK 2023). The location of the venture is no accident. London is considered one of the most prominent financial centers in the world, which could facilitate access to more customers.
The next bank is Gatehouse Bank, which is classified as an investment bank. The scope of the bank’s services is mainly investment in real estate and also its financing (Gatehouse Bank UK 2023). It should be noted that Gatehouse Bank maintains business relations, among others, with entities in Southeast Asia or Europe
Another entity presented is the Bank of London and the Middle East. The bank is characterized by a wide range of activities, its offerings include standard banking products such as deposits, as well as investment products. Therefore, Bank of London and the Middle East was characterized as an entity offering diversified banking (BLME 2023).
The last Muslim bank included in the study is Abu Dhabi Islamic Bank. The bank’s business is based on real estate, which is the core of its services. Abu Dhabi Islamic Bank’s main offering is Sharia-compliant commercial real estate financing solutions in the UK through Islamic banking products (ADIB UK 2023).
The financial institutions offering conventional products and services used in the study were selected based on the size of total assets and the availability of financial data. They included Metro Bank, Nationwide, Santander Bank Plc, Royal Bank of Scotland Plc, TSB, Cynergy, The Co-operative Bank Plc and ABC Bank. The entities’ activities focus on providing conventional banking products. Metro Bank is a commercial bank founded by American billionaire, Vernon Hill in 2010 (Metro Bank UK 2023) Santander UK Plc is a British bank owned by the Spanish Santander Group (Santander UK Plc 2023). Royal Bank of Scotland Plc is an entity of the NatWest group. Its offerings include current accounts, mortgages and savings accounts (RBS Plc 2023). TSB Bank Plc is a retail bank, established in 2013 (TSB Bank Plc 2023). Cynergy Bank, on the other hand, has been offering its services in the UK since 1955. The bank describes itself as a specialized entity catering to the financial needs of businesses and individuals (Cynergy Bank 2023). The Co-operative Bank Plc is the first bank in the UK to introduce a customer-oriented ethical policy. The entity declares that climate issues, economic development or the promotion of human rights are important to it (The Co-operative Bank Plc 2023).
Data and methodology of the study
The data described by banks is dynamic and covers eight consecutive years, from 2014 to 2021. In such a situation, the most popular method for comparing objects is to adopt one of the variables as a variable dependent on several other variables, and develop an econometric model, typically a linear one. The dependent variable is usually CTD (Cash_To_Deposits), which has a high percentage of missing data for the studied banks. Moreover, apart from missing characteristics including financial standing indicators, there is no more general data characterizing the development of banks, such as the bank’s market share, labor costs, or third-party funds. It is therefore not possible to compare the development of banks within a broader framework. Another problem is the size of banks and the idea behind the assessment of development. How should one compare big banks like e.g., ABC bank which has profits two or dozen times bigger than other banks, with smaller banks? It is much easier for a small bank to develop at a fast rate than for a big bank. Should one pay more attention to the final result i.e., the banks’ standing after the whole time period or to the steady development in shorter time periods?
In order to get a reasonable comparison of these banks in such circumstances we decided to apply the linear ordering methodology (Hellwig 1968), accompanied by graphical analysis of single attributes. One major upside of linear ordering is its simplicity with respect to both calculations and interpretation. Its disadvantage in this particular case is caused by the time dependent character of the data. The disadvantage, or difficulty, is the need to apply ordering to dynamic data. To the best of our knowledge, we have not been able to find any proposal to solve this particular problem. There are works (e.g., Kukuła, Luty 2015) in which the authors propose a solution to the problem of unifying several different arrangements of the same set of objects. The proposal consists in selecting the ordering that is most similar to all the other orderings in the sense of a similarity index. In our opinion, this proposal does not fit the rather chaotic nature of the data we have and would involve a high degree of randomness in the selection.
The outlay of our proposals is given below in more detail:
- First visually examine the flow of each variable to find possible abnormalities which could impede the idea of our approach.
- Consider the dynamic nature of the data in the following way. For each variable considered, compute the percentage of the years in which the value of the stimulant variable increased compared to the previous year. Then, find the ranking or linear ordering of all banks for all new percentage variables.
In other words, instead of the direct comparison of the values of variables at the end of the whole time span of eight years, we propose to compare how many times (actually percentage) there were rises from year to year on each of the variables chosen. Such an approach aims at assigning more weight to the character of the bank’s development over the entire period and is very resistant to missing data in some years. The first step of our proposal is necessary in view of diminishing the role of the overall change of the variables during the whole time period, as one might say that the percentage of upward changes from year to year does not make much sense if there is, e.g., only one substantial upward rise and a couple of small downward drops.
Linear ordering of objects (in its simplest form) involves calculating the distance from the pattern (an object with the maximum values of all variables) according to the formula:
$$d_{j} = \sqrt{\sum_{i=1}^n} w_{i} \cdot (y_{ij} - y_{i0})^2
$$
dj – distance from object j to the pattern; wi – weight of variable i;
yij – value of variable i for object j.
In our case, yij are percentages of rises, therefore, the distances between objects and the pattern can be computed easily as the pattern is represented by 1 on all coordinates since 1 is the greatest possible percentage of rises. Then, for each object, we compute the value of the synthetic development index (SDI) according to the formula:
$$SM_{j} = 1 - \frac {d_{j}}{d_{0}}
$$
d0 – maximum possible distance from the pattern.
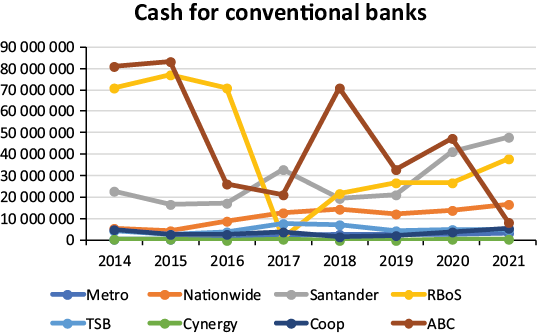
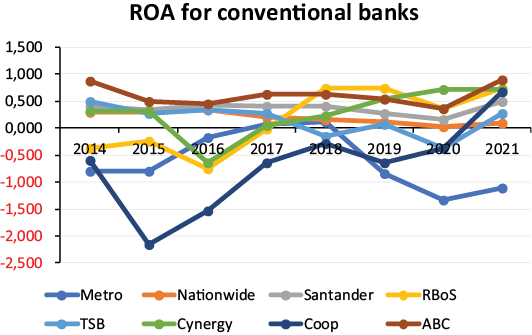
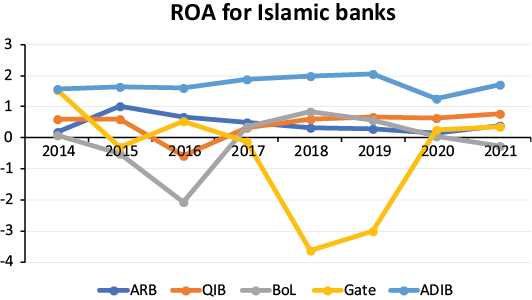
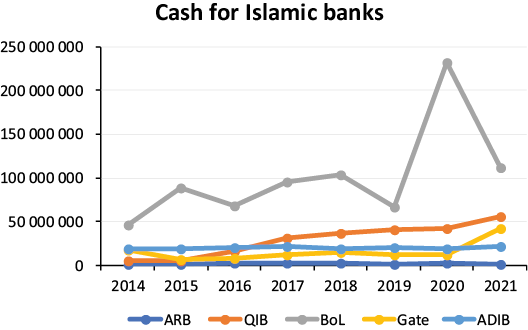
In the Appendix I the graphical illustration of basic financial variables is given. From the graphs it follows that, apart from maybe one case, possible abnormalities like abrupt fall in one year and a couple of rises in the following years, do not take place. Therefore, the analysis consisting in counting the percentages of variable rises from year to year is justified. The raw data collected on the banks surveyed is attached in Appendix II.
In Table 2 the results of three different rankings of all 13 pooled banks are presented. In our opinion the results are interesting. All three rankings suggest that the Islamic banks did better in their financial standing. It is worth noting, however, that with the role of the variable ROA growing, the standings of the Islamic banks decays. It should be interpreted in the following way: if we put more stress on relating the financial results to the bank’s size it is no longer so easy for Islamic banks to come ahead of conventional banks. An interesting observation is also the one which relates to the ranking of the ABC bank, by far the largest bank of all the banks. With the role of the variable ROA growing the ranking of this bank gets poorer. This is surprising as one might think that ROA should be rather independent of the bank’s size. However, probably the value of the banks’ cash was decisive.
Table 2. Banks rankings for different configurations of variables
|
Weights of variables |
Weights of variables |
Weights of variables |
| Annual profit/loss |
1/5 |
1/6 |
1/10 |
| Total assets |
1/5 |
1/6 |
1/10 |
| Total equity |
1/5 |
1/6 |
1/10 |
| Cash |
1/5 |
1/6 |
1/10 |
| Deposits from Customers |
1/5 |
1/6 |
1/10 |
| ROA |
0 |
1/6 |
1/2 |
| Banks rankings and the values of the SDI index |
| .950
QIB |
.937
QIB |
.911
QIB
|
|
.905
Abu Dhabi |
.908
Abu Dhabi |
.897
Abu Dhabi |
|
.889
Metro |
.892
Metro |
.880
Metro
|
|
.879
Cynergy |
.876
Cynergy |
.854
Cynergy |
|
.826
Gatehouse |
.838
Gatehouse |
.839
Co-operat |
|
.824
ABC |
.820
TSB |
.833
Gatehouse |
|
.822
Al Rayan |
.816
Co-operat |
.797
TSB |
|
.817
TSB |
.811
ABC |
.781
RoyalBScot |
|
.813
Nationwide |
.809
Al Rayan |
.764
ABC |
|
.796
Santander |
.804
Nationwide |
.764
Al Rayan |
|
.786
Co-operat |
.792
Santander |
.761
Nationwide |
|
.764
BoLondon |
.770
BoLondon |
.755
Santander |
|
.720
RoyalBScot |
.756
RoyalBScot |
.744
BoLondon |
|
Islamic average rank |
5.4
|
5.87
|
6.48
|
|
Conventional average rank
|
8.0
|
7.75 |
7.38
|
Source: own elaboration.
Conclusion
In recent years, there has been a significant development of Islamic banking in the world. There are many indications that Islamic financial services will continue to expand in the global economy. One of the biggest opportunities for the expansion of Islamic financial services is the growing Muslim population. It is mainly Muslim believers who are interested in financial products based on Sharia principles. However, it should be noted that Islamic banks also face challenges. Well-trained staff is very important, especially in European countries. Thanks to this, banking offers (services provided) are consistent with applicable rules, which also translates into greater customer trust in a given financial institution.
The aim of the article was to compare the development of several Islamic and conventional banks operating in Great Britain in 2014–2021. An innovative method was proposed that allows taking into account several variables and their variability over time. Based on the results obtained, it can be concluded that Islamic banks performed better than conventional banks in all considered variable weighting configurations.
Appendix I. The graphical illustration of basic financial variables


Appendix II. The raw data collected on the banks surveyed
| Al Rayan Bank |
| Year |
2014 |
2015 |
2016 |
2017 |
2018 |
2019 |
2020 |
2021 |
| Profit (loss) for the year |
1 215 147 |
10 272 000 |
9 501 000 |
8 620 000 |
6 430 000 |
6 111 000 |
3 838 000 |
9 003 000 |
| Profit (loss) before taxation |
502 238 |
6 204 088 |
8 185 000 |
9 450 000 |
6 116 000 |
6 487 000 |
4 198 000 |
9 627 000 |
| Total assets |
647 973 337 |
1 004 320 000 |
1 435 691 000 |
1 806 308 000 |
1 965 678 000 |
2 247 300 000 |
2 339 821 000 |
2 258 891 000 |
| Total equity |
103 111 545 |
113 457 000 |
123 284 000 |
128 762 000 |
134 966 000 |
145 821 000 |
150 056 000 |
157 311 000 |
| Cash |
803 780 |
1 807 000 |
2 412 000 |
2 692 000 |
2 327 000 |
1 225 000 |
2 638 000 |
1 867 000 |
| Deposits from customers |
509 802 583 |
730 713 039 |
1 225 244 000 |
1 596 656 000 |
1 547 456 000 |
1 840 823 000 |
1 965 001 000 |
1 959 663 000 |
| Net income from financing |
11 091 538 |
20 758 000 |
25 409 000 |
31 983 000 |
37 593 000 |
40 536 000 |
36 214 000 |
43 615 000 |
| Operating income |
502 283 |
6 204 088 |
8 185 000 |
9 450 000 |
6 116 000 |
6 487 000 |
4 198 000 |
9 600 000 |
|
2014 |
2015 |
2016 |
2017 |
2018 |
2019 |
2020 |
2021 |
| ROA (%) |
0,19 |
1,02 |
0,66 |
0,48 |
0,33 |
0,27 |
0,16 |
0,40 |
| ROE (%) |
1,18 |
9,05 |
7,71 |
6,69 |
4,76 |
4,19 |
2,56 |
5,72 |
| Operating Income to Assets (%) |
0,08 |
0,62 |
0,57 |
0,52 |
0,31 |
0,29 |
0,18 |
0,42 |
| Assets Turnover (%) |
0,08 |
0,62 |
0,57 |
0,52 |
0,31 |
0,29 |
0,18 |
0,43 |
| Cash to Assets (%) |
0,12 |
0,18 |
0,17 |
0,15 |
0,12 |
0,05 |
0,11 |
0,08 |
| Cash to Deposits (%) |
0,16 |
0,25 |
0,20 |
0,17 |
0,15 |
0,07 |
0,13 |
0,10 |
| Qatar Islamic Bank Plc |
| Year |
2014 |
2015 |
2016 |
2017 |
2018 |
2019 |
2020 |
2021 |
| Profit (loss) for the year |
1 317 432 |
2 547 829 |
–3 089 832 |
1 760 047 |
3 712 860 |
4 426 547 |
4 743 792 |
6 855 527 |
| Profit (loss) before taxation |
1 245 707 |
2 546 954 |
–2 446 612 |
2 162 316 |
4 759 102 |
5 346 693 |
5 443 147 |
7 231 087 |
| Total assets |
226 376 365 |
428 194 506 |
516 934 716 |
529 767 540 |
622 170 469 |
676 166 121 |
732 064 182 |
894 731 193 |
| Total equity |
30 505 259 |
55 634 521 |
51 889 550 |
60 100 739 |
62 793 606 |
67 216 917 |
71 933 184 |
78 826 711 |
| Cash |
5 844 014 |
6 096 742 |
16 662 446 |
30 751 631 |
37 016 753 |
40 776 701 |
41 708 029 |
56 338 957 |
| Deposits from customers |
153 139 947 |
216 017 303 |
388 377 883 |
366 604 600 |
434 542 830 |
480 142 212 |
495 173 550 |
657 768 467 |
| Net income from financing and investing activities |
5 249 598 |
9 327 829 |
7 886 250 |
10 149 176 |
10 366 395 |
11 401 806 |
11 924 818 |
15 122 899 |
| Operating income – Total operating income |
5 249 598 |
9 327 829 |
8 630 751 |
11 336 448 |
12 417 592 |
13 647 120 |
13 898 473 |
16 539 084 |
| |
2014 |
2015 |
2016 |
2017 |
2018 |
2019 |
2020 |
2021 |
| ROA (%) |
0,58 |
0,60 |
–0,60 |
0,33 |
0,60 |
0,65 |
0,65 |
0,77 |
| ROE (%) |
4,32 |
4,58 |
–5,95 |
2,93 |
5,91 |
6,59 |
6,59 |
8,70 |
| Operating Income to Assets (%) |
2,32 |
2,18 |
1,67 |
2,14 |
2,00 |
2,02 |
1,90 |
1,85 |
| Assets Turnover (%) |
0,55 |
0,59 |
–0,47 |
0,41 |
0,76 |
0,79 |
0,74 |
0,81 |
| Cash to Assets (%) |
2,58 |
1,42 |
3,22 |
5,80 |
5,95 |
6,03 |
5,70 |
6,30 |
| Cash to Deposits (%) |
3,82 |
2,82 |
4,29 |
8,39 |
8,52 |
8,49 |
8,42 |
8,57 |
| Bank of London and the Middle East Plc |
| Year | 2014 | 2015 | 2016 | 2017 | 2018 | 2019 | 2020 | 2021 |
| Profit (loss) for the year |
974 000 |
–6 850 000 |
–21 458 000 |
3 467 000 |
10 673 000 |
8 691 000 |
912 000 |
–4 336 000 |
| Profit (loss) before taxation |
989 000 |
–8 397 000 |
–19 021 000 |
3 362 000 |
7 719 000 |
9 906 000 |
530 000 |
–7 176 000 |
| Total assets |
1 381 719 000 |
1 300 270 000 |
1 028 931 000 |
1 025 888 000 |
1 272 946 000 |
1 548 599 000 |
1 743 387 000 |
1 548 850 000 |
| Total equity |
243 766 000 |
237 767 000 |
216 796 000 |
220 521 000 |
228 126 000 |
233 478 000 |
234 261 000 |
229 717 000 |
| Cash |
45 993 000 |
88 732 000 |
68 560 000 |
94 931 000 |
103 585 000 |
66 746 000 |
231 486 000 |
112 076 000 |
| Deposits from customers |
471 444 000 |
321 473 000 |
213 804 000 |
277 314 000 |
357 427 000 |
917 569 000 |
1 300 714 000 |
1 031 887 000 |
| Net income from financing and investing activities |
33 230 000 |
38 591 000 |
32 919 000 |
23 365 000 |
31 174 000 |
28 064 000 |
29 488 000 |
29 971 000 |
| Operating income – Total (net) operating income |
64 960 000 |
63 332 000 |
39 314 000 |
34 249 000 |
40 657 000 |
42 815 000 |
29 315 000 |
21 349 000 |
| |
2014 |
2015 |
2016 |
2017 |
2018 |
2019 |
2020 |
2021 |
| ROA (%) |
0,07 |
–0,53 |
–2,09 |
0,34 |
0,84 |
0,56 |
0,05 |
–0,28 |
| ROE (%) |
0,40 |
–2,88 |
–9,90 |
1,57 |
4,68 |
3,72 |
0,39 |
–1,89 |
| Operating Income to Assets (%) |
4,70 |
4,87 |
3,82 |
3,34 |
3,19 |
2,76 |
1,68 |
1,38 |
| Assets Turnover (%) |
0,07 |
–0,65 |
–1,85 |
0,33 |
0,61 |
0,64 |
0,03 |
–0,46 |
| Cash to Assets (%) |
3,33 |
6,82 |
6,66 |
9,25 |
8,14 |
4,31 |
13,28 |
7,24 |
| Cash to Deposits (%) |
9,76 |
27,60 |
32,07 |
34,23 |
28,98 |
7,27 |
17,80 |
10,86 |
| Gatehouse |
| Year | 2014 | 2015 | 2016 | 2017 | 2018 | 2019 | 2020 | 2021 |
| Profit (loss) for the year |
4 079 532 |
–844 540 |
1 572 651 |
–351 092 |
–15 854 834 |
–20 715 250 |
2 085 000 |
3 464 000 |
| Profit (loss) before taxation |
4 131 755 |
–775 111 |
1 599 760 |
–344 521 |
–15 842 285 |
–1 910 111 |
2 085 000 |
3 617 000 |
| Total assets |
263 541 340 |
281 774 624 |
299 907 609 |
280 526 225 |
437 260 828 |
684 669 633 |
824 824 316 |
1 026 358 000 |
| Total equity |
125 498 039 |
122 187 992 |
128 844 304 |
127 461 646 |
111 077 085 |
108 091 296 |
109 326 000 |
112 652 000 |
| Cash |
18 181 711 |
6 721 162 |
8 405 735 |
11 900 028 |
15 669 222 |
11 659 288 |
12 644 000 |
41 598 000 |
| Deposits from customers |
2 636 732 |
11 513 973 |
58 239 327 |
73 334 272 |
|
|
|
|
| Net income from financing and investing activities |
7 665 449 |
8 408 942 |
12 317 728 |
9 072 061 |
6 879 804 |
18 640 627 |
25 588 000 |
33 889 000 |
| Operating income – Total operating income |
15 455 058 |
11 574 771 |
12 809 672 |
10 761 655 |
–1 670 343 |
17 827 316 |
23 956 000 |
31 234 000 |
| |
2014 |
2015 |
2016 |
2017 |
2018 |
2019 |
2020 |
2021 |
| ROA (%) |
1,55 |
–0,30 |
0,52 |
–0,13 |
–3,63 |
–3,03 |
0,25 |
0,34 |
| ROE (%) |
3,25 |
–0,69 |
1,22 |
–0,28 |
–14,27 |
–19,16 |
1,91 |
3,07 |
| Operating Income to Assets (%) |
5,86 |
4,11 |
4,27 |
3,84 |
–0,38 |
2,60 |
2,90 |
3,04 |
| Assets Turnover (%) |
1,57 |
–0,28 |
0,53 |
–0,12 |
–3,62 |
–0,28 |
0,25 |
0,35 |
| Cash to Assets (%) |
6,90 |
2,39 |
2,80 |
4,24 |
3,58 |
1,70 |
1,53 |
4,05 |
| Cash to Deposits (%) |
689,55 |
58,37 |
14,43 |
16,23 |
|
|
|
|
| Abu Dhabi Islamic Bank |
|
Year | 2014 | 2015 | 2016 | 2018 | 2019 | 2020 | 2021 |
| Profit (loss) for the year |
1 750 690 |
1 934 043 |
1 953 558 |
2 300 123 |
2 500 786 |
2 601 111 |
1 603 961 |
2 330 089 |
| Profit (loss) before taxation |
2 378 975 |
1 940 358 |
1 967 679 |
2 332 784 |
2 505 608 |
2 604 064 |
1 594 053 |
2 345 117 |
| Total assets |
111 903 803 |
118 377 662 |
122 289 725 |
123 277 599 |
125 193 915 |
125 987 171 |
127 816 138 |
136 868 349 |
| Total equity |
13 686 667 |
15 075 231 |
15 458 641 |
16 573 164 |
17 736 685 |
19 103 417 |
19 161 884 |
20 599 060 |
| Cash |
18 757 580 |
18 629 361 |
19 778 339 |
21 467 205 |
18 731 208 |
19 823 409 |
19 579 524 |
21 699 249 |
| Deposits from customers |
84 776 408 |
94 927 160 |
98 813 752 |
100 003 619 |
100 403 747 |
101 404 275 |
101 276 128 |
109 611 103 |
| Operating income – Total operating income |
5 211 270 |
5 751 003 |
5 993 316 |
6 214 294 |
6 483 520 |
6 728 422 |
5 860 523 |
5 889 510 |
| |
2014 |
2015 |
2016 |
2017 |
2018 |
2019 |
2020 |
2021 |
| ROA (%) |
1,56 |
1,63 |
1,60 |
1,87 |
2,00 |
2,06 |
1,25 |
1,70 |
| ROE (%) |
12,79 |
12,83 |
12,64 |
13,88 |
14,10 |
13,62 |
8,37 |
11,31 |
| Operating Income to Assets (%) |
4,66 |
4,86 |
4,90 |
5,04 |
5,18 |
5,34 |
4,59 |
4,30 |
| Assets Turnover (%) |
2,13 |
1,64 |
1,61 |
1,89 |
2,00 |
2,07 |
1,25 |
1,71 |
| Cash to Assets (%) |
16,76 |
15,74 |
16,17 |
17,41 |
14,96 |
15,73 |
15,32 |
15,85 |
| Cash to Deposits (%) |
22,13 |
19,62 |
20,02 |
21,47 |
18,66 |
19,55 |
19,33 |
19,80 |
Jerzy Korzeniewski – dr. hab., Uniwersytet Łódzki, Wydział Ekonomiczno-Socjologiczny, Katedra Demografii, jerzy.korzeniewski@uni.lodz.pl
Patrycja Melon – mgr, Uniwersytet Łódzki, Szkoła Doktorska Nauk Społecznych, Wydział Ekonomiczno-Socjologiczny, Katedra Makroekonomii i Ekonomii Instytucjonalnej, patrycja.melon@eksoc.uni.lodz.pl
References
Adamek A. (2021), Finanse muzułmańskie na brytyjskim rynku finansowym (wybrane zagadnienia), Wydawnictwo Uniwersytetu Ekonomicznego we Wrocławiu, Wrocław. ISBN: 978-83-7695-873-6
Ahmad S., Rahman R.A. (2012), The efficiency of Islamic and conventional commercial banks in Malaysia, “International Journal of Islamic and Middle Eastern Finance and Management”, 5(3). https://doi.org/10.1108/17538391211255223
Ahmad W., Luo R.H. (2010), Comparison of banking efficiency in Europe: Islamic versus conventional banks, [in:] S.J. Kim, M.D. McKenzie, International Banking in the New Era: Post-Crisis Challenges and Opportunities, “International Finance Review”, 11, Emerald Group Publishing Limited, Bingley. https://doi.org/10.1108/S1569-3767(2010)0000011016
Antoniazzi S. (2022), Islamic Banks and the European Banking Union: An overview of Critical Issues and Perspectives, “European Journal of Islamic Finance”, 9(1).
Asif S. (2018), The Halal and Haram Aspect of Cryptocurrencies in Islam, “Journal of Islamic Banking & Finance”, 35(2). https://doi.org/10.13140/RG.2.2.29593.52326
Chowdhury M.A.M., Haron R. (2021), The Efficiency of Islamic Banks in the Southeast Asia (SEA) Region, “Future Business Journal”, 7. https://doi.org/10.1186/s43093-021-00062-z
Hellwig Z. (1968), Zastosowanie metody taksonomicznej do typologicznego podziału krajów ze względu na poziom ich rozwoju oraz zasoby i strukturę wykwalifikowanych kadr, “Przegląd Statystyczny”, 4.
ICD – Refinitiv (2020), Islamic Finance Development Report 2020. Progressing Through Adversity, ICD-Refinitiv IFDI Report 20201607502893_2100.pdf (icd-ps.org)
Islahi A.A. (2018), History of Islamic Banking and Finance, Intellectual Discourse, 26:2, IIUM Press. ISSN: 0128-4878
Ismail F., Shabri Abd. Majid M., Ab. Rahim R. (2013), Efficiency of Islamic and conventional banks in Malaysia, “Journal of Financial Reporting and Accounting”. https://doi.org/10.1108/JFRA-03-2013-0011
Kasiak M. (2016), Bankowość muzułmańska – podłoże ideologiczne oraz religijne, “Czasopismo Naukowe ACTA ERASMIANA XI”. ISBN: 978-83-65158-05-5
Khan I., Khan M., Tahir M. (2017), Performance comparison of Islamic and conventional banks: empirical evidence from Pakistan, “International Journal of Islamic and Middle Eastern Finance and Management”, 10(3). https://doi.org/10.1108/IMEFM-05-2016-0077
Kukuła K., Luty L. (2015), Propozycja procedury wspomagającej wybór metody porządkowania liniowego. Metody ilościowe w badaniach ekonomicznych, “Przegląd Statystyczny”, XVI.
Kurochkina I., Us U. (2019), The development and special aspects of Islamic Finance in Europe at the present stage, SHS Web of Conferences 67. https://www.shs-conferences.org/articles/shsconf/pdf/2019/08/shsconf_NTI-UkrSURT2019_06033.pdf
Majeed M.T., Zanib A. (2016), Efficiency analysis of Islamic banks in Pakistan, “Humanomics”, 32(1). https://doi.org/10.1108/H-07-2015-0054
Milenković I., Milenković D. (2016), Interest and Gharar in Islamic Banking, “Bankarstvo”, 45. https://doi.org/10.5937/bankarstvo1601054M
Musa H., Natorin V., Musova Z., Durana P. (2020), Comparison of the efficiency measurement of the conventional and Islamic banks, “Oeconomia Copernicana”, 11(1). https://doi.org/10.24136/oc.2020.002
Rosman R., Wahab N.A., Zainol Z. (2014), Efficiency of Islamic banks during the financial crisis: an analysis of Middle Eastern and Asian Countries, “Pacific-Basin Finance Journal”. https://doi.org/10.1016/j.pacfin.2013.11.001
Salman A., Nawaz H. (2013), Islamic financial system and conventional banking: A comparison, “Arab Economic and Business Journal”. https://doi.org/10.1016/j.aebj.2018.09.003
Shafaq A. (2014), Islamic Finance in Western World: Development, legal regulations and challenges faced by Islamic Finance in the United Kingdom, “Journal of Islamic Banking & Finance”, 31(2).
Slimen R.B., Belhaj F., Hadriche M., Ghroubi M. (2022), Banking Efficiency: A comparative study between Islamic and conventional banks in GCC Countries, “Copernican Journal of Finance & Accounting”, 11(1). https://doi.org/10.12775/CJFA.2022.005
Sobol I. (2015), Islamic Banking in the European Union Countries, “European Integration Studies”, 9. https://doi.org/10.5755/j01.eis.0.9.12806
Sobol I. (2019), Rozwój bankowości islamskiej. Uwarunkowania, problemy, perspektywy, Wydawnictwo Uniwersytetu Gdańskiego, Gdańsk.
The Islamic Corporation for the Development of the Private Sector, Refinitiv, Islamic Finance Development Reports 2022.
UK Trade & Investment (2013), UK Excellence in Islamic Finance. https://assets.publishing.service.gov.uk/government/uploads/system/uploads/attachment_data/file/248791/UK_Excellence_in_Islamic_Finance_2013.pdf
UK Trade & Investment, Institutional Investment & Infrastructure (2014), UK Excellence in Islamic Finance. https://assets.publishing.service.gov.uk/media/5a7d696aed915d269ba8a83d/UKTI_UK_Excellence_in_Islamic_Finance_Reprint_2014_Spread.pdf
Ullah K., Al-Karaghouli W. (2017), Understanding Islamic Financial Services: Theory and Practice, Kogan Page. ISBN: 9780749480516, ISBN: 9780749480523
Warde I. (2004), Global Politics, Islamic Finance and Islamic Politics Before and After 11 Semptember 2001 [in:] C.M. Henry, R. Wilson, The Politics of Islamic Finance, Edinburgh University Press Ltd. https://doi.org/10.3366/edinburgh/9780748618361.003.0002
Z/Yen Group, Yeandle M., Mainelli M. (2016), The Global Financial Centres Index 20, London, Long Finance. https://ssrn.com/abstract=3671509
Websites
Abu Dhabi Islamic Bank, https://www.adib.co.uk/en/Pages/Advisory-Services.aspx
Al Rayan Bank, https://www.alrayanbank.co.uk/ethical-banking
Al Rayan Bank, https://www.alrayanbank.co.uk/savings
Al Rayan Bank, https://www.alrayanbank.co.uk/useful-info-tools/about-us
Al Rayan Bank, https://www.alrayanbank.co.uk/values-and-heritage
Bank of London and the Middle East, https://www.blme.com
Cynergy Bank, https://www.cynergybank.co.uk/personal/
Gatehouse Bank, https://www.gatehousebank.com
Islamic Financial Services Board, https://ifsb.org
Metro Bank, https://www.metrobankonline.co.uk/
Qatar Islamic Bank UK, https://www.qib-uk.com
Santander UK Plc, http://www.santander.co.uk/
Statista, https://www.statista.com/statistics/270228/top-financial-centers-on-the-global-financial-centres-index/
The Co-operative Bank Plc, https://www.co-operativebank.co.uk/about-us/
The Royal Bank of Scotland, http://www.rbs.co.uk/
TSB Bank Plc, https://www.tsb.co.uk/personal/
Streszczenie
Rozwój bankowości islamskiej w Wielkiej Brytanii – porównanie bankowości islamskiej i konwencjonalnej
Celem artykułu jest porównanie rozwoju kilku banków islamskich oraz konwencjonalnych działających na terenie Wielkiej Brytanii w latach 2014–2021. Zastosowano prostą w interpretacji statystyczną metodę porządkowania liniowego obiektów charakteryzowanych kilkoma zmiennymi. Zasadnicza trudność polegała na uwzględnieniu zmiennego w czasie notowania wartości rozważanych zmiennych. Zaproponowano nowatorską metodę pozwalającą na uwzględnienie zarówno wartości kilku zmiennych jak i ich zmienności w czasie. W metodzie tej można położyć nacisk na efekt końcowy, to znaczy rozważać tylko wartości zmiennych na początku i na końcu badanego okresu, ale można uwzględnić płynność systematyczny rozwoju banku przez położenie nacisku na wzrost wartości zmiennych-stymulant z roku na rok. W otrzymanym porządkowaniu banki islamskie rozwijały się dynamiczniej od konwencjonalnych we wszystkich rozważanych konfiguracjach zmiennych.
Słowa kluczowe: bankowość, bankowość islamska, szariat
© by the author, licensee University of Lodz – Lodz University Press, Lodz, Poland. This article is an open access article distributed under the terms and conditions of the Creative Commons Attribution license CC-BY-NC-ND 4.0 (
https://creativecommons.org/licenses/by-nc-nd/4.0/)
