Paweł Lont
Institutional Considerations for the EU Gas Sector Competitiveness
Summary
The study explores the subject of sectoral competitiveness on the example of gas sectors in different European countries. Literature review on sectoral competitiveness suggests that the concept has evolved considerably over time and that contemporary definitions of competitiveness span beyond traditional economic factors. Studies on gas sector in this context to date, however, have largely focused on export competitiveness of upstream activities. To address the research gap, a targeted approach is suggested to study and compare competitiveness of the entire national gas sectors, spanning beyond standard productivity measures. A dedicated synthetic indicator is designed to perform a comparative analysis of contemporary gas sectors, taking account of the gas price offered to the industry, institutional performance, infrastructure readiness and job creation potential. Then, the case study is presented and it examines four countries that have liberalized their gas sectors and are reliant on gas imports to a different degree. Results confirm that the application of a synthetic indicator factoring in different aspects of sectoral competitiveness is appropriate to arrive at a holistic view of gas sector’s relative performance. The significance of the institutional setup is also confirmed from the perspective of inducing investment, enhancing market liquidity, as well as creating sustainable jobs in the gas sector.
Keywords: gas market, liberalization, sectoral competitiveness
JEL: F12, F15, F18, L41, Q01
Introduction
The Third Energy Package of 2009 spelled out the European Union’s (EU’s) intention to fully integrate the national gas markets by March 2014. Nearly a decade past that deadline, an internal market for gas remains an aspiration and the national sectors of different Member States have reached different stages of development. At the same time, the energy crisis of 2022 brought about by Russia’s invasion of Ukraine has uncovered the significance of natural gas in the energy mix and signaled that the EU would benefit greatly from better integration on the energy front.
While the use of natural gas may seem to be at odds with Europe’s aspiration to become the first climate-neutral continent by 2050, its substitution as a source of flexibility for the electricity sector or indeed as feedstock for different chemical processes does not seem possible in the foreseeable future. This conclusion has triggered the process of decarbonizing the gas sector through the introduction of technologies of producing sustainable substitutes to fossil gas. The challenge stemming from this process, just like for the electricity sector, stems from the considerable additional costs brought about by these technologies that collectively affect the costs borne by end consumers. Since the costs of decarbonization are expected to be high, the question about competitiveness of the EU economy arises. At the same time, introduction of sustainable technologies provides an opportunity for the gas sector to remain part of the energy mix and develop future-proof job spaces.
The economic concept of competitiveness is a complex subject on its own and no single definition of the phenomenon exists. Similarly, there are different methods for measuring competitiveness at macro-, meso- and microeconomic level that often need to be tailored to specific applications. This is the case particularly for contemporary gas markets, since traditional input-output indicators are only applicable to upstream activities, leaving transport, trade and supply outside the scope of study.
The aim of this study is to identify the key determinants of gas sector competitiveness, building on the experience of European countries that have opened their markets to competition, while remaining largely dependent on imports. The study begins with a summary of literature review on the subject of sectoral competitiveness, as well as on the functioning of the gas market in the European Union in order to identify the key features of contemporary gas market competitiveness. This research also confirms that most studies on gas sector competitiveness thus far focused mainly on the upstream side, building on traditional input-output indicators. Once the competitiveness determinants for the European gas sector is determined, a research sample is established out of the group of European countries to reflect distinct features of their gas sectors, such as access to different sources of gas, infrastructural development level and liquidity of the gas market. The necessary data is then collected for these countries in order to calculate the indicators that have been identified as potential components of a synthetic measure that would enable comprehensive comparative analyses of the sector’s competitive position. Finally, the synthetic indicator is calculated for the research sample for the period between 2014 and 2022, reflecting the time elapsed since the formal deadline for the adoption of the Third Energy Package in the European Union.
Study findings confirm that a synthetic measure is a useful tool for comparative analyses of gas sector competitiveness within the contemporary understanding of the phenomenon. The proposed tool allows for taking a more comprehensive look at the changes taking place in the sector, signaling that neither the price, nor other determinant of competitiveness should be analyzed in isolation when determining the relative standing of the gas sector. The results confirm that an additional premium on a gas price can be justified and/or counterbalanced by significant investment in infrastructure development or creation of new jobs. More importantly, the results point to the fact that gas sector competitiveness is nowadays primarily a function of institutional performance, as it determines the environment for trading, efficiency of investment in infrastructure and attractiveness of support schemes for sustainable gas production. Therefore, the study contributes to the existing knowledge about the gas sector through putting its performance in the context of contemporary research on sectoral competitiveness. The results confirm that traditional measures of productivity are of little relevance when studying the performance of sectors reliant on imports, such as most of national gas sectors in Europe.
Sectoral competitiveness and specificity of the gas sectors in Europe
Research on the phenomenon of competitiveness within its more contemporary understanding started in 1970s, as rivalry between entities from the United States and Japan was reaching its peak (Siudek, Zawojska 2014, p. 1). Among different definitions stemming from this research, there are several focusing on the macro-mesoeconomic level that are particularly worth mentioning from the perspective of this study.
According to Fleiterski (1984, p. 8), competitiveness is the industry’s ability to produce goods that find buyers because of their price, quality, or other features that distinguish them from alternative or substitute goods offered on the market. This definition already underlines that the phenomenon of competitiveness spans beyond pure price and cost considerations. Similarly, Chikán (2008, p. 5) states that competitiveness is the ability to meet the customer needs better than the competitors, while making profit (at micro-mesoeconomic level) and the capability to increase factor productivity and citizen’s welfare through ensuring and enabling environment for companies at national level (Chikán 2008, p. 6). It is exactly this interplay between the micro-, meso- and macroeconomic activity that makes competitiveness a complex phenomenon to study and measure.
The popular definition by Porter (1990) confirms that competitiveness is the ability to outperform others and states that its ultimate roots lie in the capability to introduce innovations. More importantly, Porter explains that the best environment to induce constant innovations is intense, market-based competition between companies that forces the actors on the market to constantly seek improvements to the way they work. Without going into details of the concept’s subsequent critique and evolution over the years, it is important to underline the link between the need to innovate and the ability to compete, as it is an aspect that ties in macro-level policies, with sector specific regulations and actions taken by individual companies. In this context, it is also useful to refer to the works by Kulikov (2000), who also specified that competitiveness can only be deemed “real”, if it is established in a free market environment, where the goods and services offered find customers without artificial subsidies or restrictive policies.
More recent and more nuanced definitions of competitiveness speak of the ability to deliver “beyond-GDP” goals for the citizens, tying contemporary understanding of competitiveness with the concepts of welfare and sustainability (Aiginger et al. 2013, p. 4). This implies that in the contemporary economy, competitiveness measures cannot rely solely on quantitative data and the traditional input/output ratios, traditionally used to analyze the performance of different sectors. In this spirit, Manyika et al. (2010) define sectoral competitiveness as the ability to sustainably increase employment and/or productivity. From the perspective of this study, as will be explained in the following section, an important definition of competitiveness comes from Schwab (2013, p. 5) that defines it as the ability of the institutions to create an environment for fair internal rivalry that enables building advantages. It can also be observed that many recent attempts to define competitiveness typically refer to the concept of sustainable development – it appears that the wider, non-economic aspects of commercial activity are increasingly becoming a potential source of competitive advantage on their own (Capobianco-Uriarte et al. 2019). With this in mind, it should be concluded that different sectors of the economy should increasingly factor in the environmental and social aspects of their activities, if they are to be considered competitive in the long term.
Studies on the subject of gas sector competitiveness to date typically built on the more traditional definitions of the phenomenon, focusing primarily on the upstream side of the gas sector and the related competitiveness of exports (see, for example, Romero-Marquez, Moreno-Brid 2015; Antipin, Zhiqiang 2023, Cardinale 2023). Different studies, however, do emphasize the role of institutions in establishing a competitive advantage by the gas sector, even if this is still done in the context of the upstream industry (Soltani et al. 2021; Mejia, Aliakbari 2022). Alternatively, the role of intra-sector competition in inducing innovation and/or exerting downward pressure on cost of gas supply is explored (Halkos 2020; Hulshof et al. 2016). Distortive effects of carbon taxes on gas sector competitiveness are also studied extensively, although largely in the macroeconomic context (see e.g., Beale et al. 2015; Naef 2024). Research gap is therefore identified in the context of developing gas sector competitiveness within its contemporary understanding, particularly in countries relying on imports and emphasizing the need to decarbonize the economy.
In view of the research gap identified, the natural gas sectors of European Union Member States become a particularly interesting subject of studies. These sectors, like many others, have been established as monopolistic structures of national companies that had full control over the entire value chain, from production to end-customer deliveries. Many targeted reforms aimed at establishing an environment enabling competition in gas sourcing, trade and supply have therefore been implemented. In addition, since natural gas is a fossil fuel, its consumption (particularly combustion) and leaks collectively constitute a major source of greenhouse gas (GHG) emissions into the atmosphere. As such, the commodity that the sector trades and delivers cannot be deemed as sustainable. Also in this case, however, many EU countries have already taken steps to develop sustainable gas production, which could support gas sector competitiveness within its contemporary understanding.
When it comes to introducing competition to the gas sector, the process has a long history in Europe. Liberalization of the gas sector implied dividing it into a segment of gas transmission, where competition could not bring any tangible results and competitive activities of gas production, trading and supply. For the two segments to coexist, the competitive side of the sector needed to have non-discriminatory, fair access to the transmission infrastructure guaranteed. Such a rule is formally referred to as the Third Party Access (TPA) principle. At the same time, a national regulatory authority (NRA) had to be established in order to ensure that the TPA principle was respected and that infrastructure use was offered at a reasonable price. The United Kingdom was a prime-mover in this respect in Europe, introducing a wide-ranging reform of its gas monopoly already in 1986 (Juris 1998).
In the European Union, the aspiration to liberalize the natural gas sectors and integrate them into a single internal market was spelled out in the Internal Energy Market (IEM) working document of the European Commission already in 1988. The document stated that the such a reform would result in a considerable drop in costs of energy, improved supply security and welfare gains stemming from intensified trade between the Member States. Despite such promising prospective outcomes, the first attempt to translate the IEM working document into a concrete action came a decade later with the adoption of the first Gas Directive (90/30/EC). The Directive was to ensure a degree of harmonization in terms of regulating the gas sector. It deserves to be added here, that this degree was very limited in scope, catering for merely high-level TPA rules that could not facilitate any intensification of competition or enable market access for new entrants. With the revised Gas Directive (2003/55/EC) five years later, formal requirement to establish NRAs has been introduced alongside a requirement for legal separation of gas transmission from commercial activities in the gas sector. The second Gas Directive was supplemented with a Gas Regulation (Regulation (EC) 1775/2005) requiring greater transparency and cost-reflectivity from the transmission system operators. It can be stated, however, that the legislative “package” was still leaving considerable discretion to national authorities that nonetheless largely did not ensure compliance with the provisions within the deadline envisaged (Thomas 2005, p. 12). True reinforcements to the overall design of the EU gas market came with the introduction of the so-called Third Energy Package in June 2009 (new Gas Directive 2009/73/EC and Regulation (EC) 715/2009), which has formalized and institutionalized cooperation in terms of harmonizing the national gas sectors.
The Third Energy Package aspired to fully liberalize and integrate the EU gas market by March 2014, which was extremely ambitious considering how much still had to be done in terms of market opening and integration. Once the international cooperation was formalized through the establishment of the Agency for Cooperation of Energy Regulators (ACER) and the European Network of Transmission System Operators for Gas (ENTSO-G), intense work started on harmonizing the market design and cross-border trade. The following fundamental principles for the gas market were defined (CEER, 2011):
- the gas networks ought to be operated as entry-exit systems, where the users would contract for network capacity at the points of gas injection and offtake they wish to use. The capacity products offered ought to be standardized to avoid mismatches between different national networks. Price of these products should be cost-reflective and known upfront;
- network users should have the incentive to self-balance the amount of gas they nominate at network entries and exits on a given day. The system operator would only intervene if the users failed to ensure the network balance and the cost of such intervention should be borne by those causing the imbalance;
- gas ownership transfers, following commercial transactions, should be taking place at a single, virtual point in the network to ensure pooling of supply and demand. These points in the network are commonly known as “gas hubs” although the term tends to be used in very diverse contexts.
While the implementation of the EU acquis remains imperfect in many countries (as will be outlined in the following section), some Member States have managed to develop liquid gas markets and the price signal from these markets is increasingly replacing oil-indexed contracts (ACER 2023). A question arises over the reasons why in some markets the sectoral model was introduced successfully and in others it failed.
With sustainability considerations taking a more prominent place in the national policies in Europe, the Third Energy Package had been targeted for a review once again. With the economic non-viability or even physical impossibility to electrify all energy end use becoming increasingly acknowledged worldwide, demand for gas is expected to exist in a considerable size even beyond 2050 (International Energy Agency 2022). This remains true even in view of the development of a hydrogen market, since gas is still needed as feedstock in certain chemical processes as a source of controllable high heat, as well as in heating and cooling (Honore 2019, pp. 40–41). Nonetheless, sustainable alternatives to natural gas exist, with biomethane, gas from anaerobic digestion of organic waste, being a readily available technology that can be applied at scale (Kabeyi, Olanrewaju 2022). Biomethane, as a product of processing organic waste, does not add to the greenhouse gases in circulation over its lifecycle, if it is produced properly. The benefits of biomethane have already been recognized in the Renewable Energy Directive (RED), yet a more comprehensive approach for the build-up of biomethane capacity is now in the making as the new “Hydrogen and Decarbonized Gas Markets” legislative package is to be agreed in the trilogue by the end of 2023 (Banet 2023).
In view of contemporary competitiveness theories, the deployment of renewable gas production technologies poses a challenge due to related additional costs, but also creates an opportunity in terms of the ability to create new jobs and distinguish the gas offered by the sector through lowering its carbon intensity. The challenge lies within developing a tool that could help evaluating changes to the overall competitiveness of the gas sector.
Measuring competitiveness of a contemporary gas sector
The starting point for considerations around gas sector competitiveness in the EU should be the recognition of the fact that this phenomenon does not and cannot refer merely to measures of productivity. Most of the commodity is imported, whereas the productivity of domestic production is difficult to compare due to, among others, differences in quality, location of the wells and the size of the reserves (Van Stiphout 2023). For the same reason, measures referring to standard input-output calculations or labor productivity do not capture the nature of the European gas sectors. Therefore, different aspects of competitiveness had to be considered when comparing the gas markets of the EU.
Considering the contemporary structure of the gas sectors in the EU, a measure of competitiveness should evaluate the efficiency of the regulatory environment that governs the unbundling of the previously vertically integrated companies, effective pooling of supply and demand at the virtual trading point and cost-reflectivity of the transmission services offered to network users. Other aspects should also be considered to reflect the flexibility that the national gas infrastructure offers to gas shippers, and also to take account of any interventions to the market that can hinder its development and/or regional integration. Finally, in view of the new technologies being developed, the ability to create high-quality, sustainable job spaces could be deemed as a good indicator of developing a competitive advantage. The potential structure of a synthetic measure of gas sector competitiveness has been presented in Graph 1 below.
Graph 1. Structure of the synthetic indicator
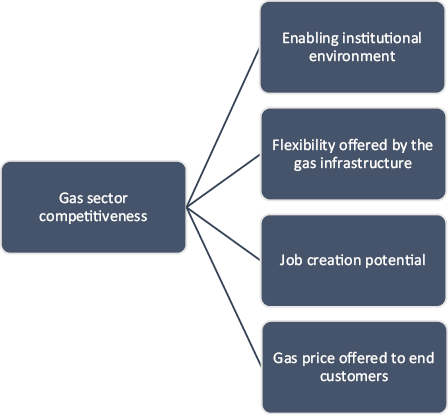
Source: own elaboration.
The components of the synthetic measure presented in Graph 1 can be defined and described as follows:
- enabling institutional environment – a qualitative component that refers back to Schwab’s definition of competitiveness as described in the previous section. Such a variable is difficult to quantify, but it can be reflected as a rank attributed to the institutional setup for the national gas sector when compared to efficiency of institutions in other countries considered. In this study, the ranks have been established on the basis of neutral periodic reports offered by pan-European or international institutions (European Commission – EC, Agency for Cooperation of Energy Regulators – ACER, International Energy Agency – IEA) and non-profit industry association (European Federation of Energy Traders – EFET). Given the differences in views expressed in these reports, three distinct ranks had to be prepared, with the final result for each country calculated as an average score. In the case of the first two rankings, they were based on the observations and opinions expressed by the IEA and EC (supplemented by ACER reports where applicable) respectively about the institutional performance of the country, relating to the attractiveness of the trading venue, transparency of the regulations, market fragmentation, intra-sector competition etc. Third rank was established on the basis of a periodic EFET study on gas market performance, the conclusions of which are offered as rankings as well;
- flexibility offered by the gas infrastructure – the component was considered following the approach presented by the World Economic Forum, quoted as the second pillar of competitiveness (Schwab 2013). In the case of EU gas sectors, the advantage brought about by the gas infrastructure can be reflected by both the cross-border capacity of the pipelines and liquefaction capacity of liquefied natural gas (LNG) terminals, enabling trade and solidarity support in the event of a crisis. In addition, the capacity offered by storage facilities, depending on their type, can help balancing the short-term and seasonal demand fluctuations (Al-Shafi et al. 2023). All the relevant information in this respect has be collected from an industry association, Gas Infrastructure Europe (GIE);
- job creation potential – referring back to Manyika’s definition of competitiveness, the ability to create sustainable employment is an important determinant. In the case of the gas sector this can be referred to the deployment of sustainable gas production facilities that can be deemed as supportive of EU’s decarbonization efforts. In 2023, the only sustainable technology applied at scale is biomethane production – according to the study by Navigant, every TWh of biomethane produced annually translates into even 1050 jobs in the economy (Navigant 2019). This value was to be used in combination with historical biomethane production statistics to reflect the gas sector’s ability to create additional jobs;
- gas price – ultimately, the cost of energy supply remains an important determinant of competitiveness regardless of the type of definition used. For the gas sector, different end-user prices can be considered, containing a different degree of subsidization or additional burdens and levies, typically depending on the annual consumption size (Kettner, Wretschitsch 2023). In practice, medium and large enterprises can provide a good reference for further comparisons, as they are typically subject to the different additional taxes and levies that subsidize the uptake of new technologies and/or supply of households. Using Eurostat data and classifications, average price paid by consumers from group I5 and I6 has been considered for the synthetic indicator.
The proposed structure of the Sectoral Competitiveness Index for Gas (SCIG) is therefore as follows:
$$ SCI_{G} = Ins + Ginfr + Jc + Gp $$
where:
Ins – institutional environment reflected by the average rank achieved by a given country in three rankings evaluating its sector’s performances on the basis of three different sources. First ranking was established on the basis of European Commission’s quarterly gas market monitoring reports. Second ranking was established based on conclusions stemming from IEA’s periodic National Energy Policy Reviews. In both cases, rankings were established on the basis of the conclusions that these reports have presented with reference to the actions and decisions that the national authorities have taken in a given year and how (in view of EC and IEA respectively) these decisions have impacted the gas sector. Third ranking was established to reflect market performance, building on the annual Gas Hub Development Study prepared by EFET;
Ginfr – infrastructure-related flexibility available to gas network users calculated as an average value of the two features of the gas network: average technical cross-border import/export capacity (including LNG import capacity) referenced against peak daily demand and gas storage capacity compared to the annual inland consumption. Reference to the demand size is set to reflect the flexibility offered to the network users vis-à-vis the country’s total domestic consumption to better reflect the size of the economy;
Jc – new job spaces creation stemming from the development of biomethane production, calculated against the reported annual biomethane output using the estimates from the Navigant study;
Gp – gas price paid by large industrial gas consumers (average price paid by I5 and I6 band consumers), as reported by Eurostat.
It needs to be recognized that other variables could also be included in the analyses going forward, particularly measuring the decarbonization effort of the given sector, which, over time, would help differentiating the commodity each sector supplies on the basis on its overall impact on the environment. Quality differentiation of this sort would be much in the spirit of Flejterski’s definition of competitiveness, as quoted in the previous section. In order to test the usefulness of a synthetic indicator constructed this way, a case study for several selected EU Member States will be presented next.
Case study for selected countries
For the purpose of this analysis, several countries were considered to reflect the different stage of gas market development and distinct characteristics, such as the availability of domestic gas production, access to diverse import routes and maturity of institutional setup that governs the ability to trade gas. Although the analysis was structured in a way that would allow to analyze any country that has pursued gas market liberalization within the requirements of the EU acquis, the decision was taken to focus on countries that have advanced in gas market development, so that comparisons are made between sectors that can be deemed sustainably competitive within the contemporary understanding of the phenomenon. This decision has narrowed down the choice to countries in Central and Western Europe that have opened their sectors to competition. Countries in other parts of Europe are reportedly lagging behind, as evidenced by the European Gas Hub Study of EFET. Since the analysis requires processing considerable amount of data, the research group was narrowed further to four countries on the grounds of their distinct characteristics:
- the United Kingdom – a pioneer in liberalizing the gas sector (Wright 2005). The country also has extensive experience in developing and deploying biomethane technologies (European Biogas Association 2015);
- France – a country with a well-interconnected gas market that for many years was fragmented (Heather 2021). France also pursues an ambitious biomethane development strategy (Law no. 2015-992 on Energy Transition for Green Growth, 2015);
- Germany – a country with the largest gas demand in Europe and at the same time the largest biogas producer globally (International Energy Agency 2021);
- Denmark – a most successful country in promoting biomethane production which already in 2022 covers over 40% of its domestic demand with sustainably-produced gas (Robb 2022). At the same time, it is one of the few countries in Europe that historically acted as a net gas exporter (International Energy Agency 2023).
Other countries could also be considered in future analyses (particularly Netherlands, Italy and Spain), yet considering the time-consuming process for establishing ranks for the qualitative variable, the decision was taken to focus on these four countries, given their distinct characteristics and experience with gas market liberalization.
For the purpose of this analysis, the period covering the implementation of the Third Energy Package was deemed appropriate for comparisons i.e. from the deadline for harmonizing the rules on the internal market for gas in 2014 onto 2022. The implementation process helped harmonizing the fundamental principles governing the gas market, which, in turn, gave grounds for credible comparative analyses. The data collected for the variables considered have been described in more detail in the following part of the article.
Table 1. Institutions scores on the basis of different sources
| EC reports |
2014 |
2015 |
2016 |
2017 |
2018 |
2019 |
2020 |
2021 |
2022 |
|
France
|
2
|
2
|
2
|
2
|
2
|
2
|
2
|
2
|
2
|
|
Germany
|
1
|
3
|
3
|
3
|
3
|
3
|
3
|
3
|
3
|
|
Denmark
|
3
|
1
|
1
|
1
|
1
|
1
|
1
|
1
|
1
|
|
UK
|
4
|
4
|
4
|
4
|
4
|
4
|
4
|
4
|
4
|
|
IEA reports
|
2014
|
2015
|
2016
|
2017
|
2018
|
2019
|
2020
|
2021
|
2022
|
|
France
|
3
|
1
|
1
|
1
|
2
|
2
|
2
|
2
|
2
|
|
Germany
|
2
|
2
|
2
|
2
|
1
|
1
|
1
|
1
|
1
|
|
Denmark
|
1
|
3
|
3
|
3
|
3
|
3
|
3
|
3
|
3
|
|
UK
|
4
|
4
|
4
|
4
|
4
|
4
|
4
|
4
|
4
|
|
EFET reports
|
2014
|
2015
|
2016
|
2017
|
2018
|
2019
|
2020
|
2021
|
2022
|
|
France
|
3
|
2
|
2
|
3
|
3
|
2
|
2
|
2
|
2
|
|
Germany
|
2
|
3
|
3
|
2
|
2
|
3
|
3
|
3
|
3
|
|
Denmark
|
1
|
1
|
1
|
1
|
1
|
1
|
1
|
1
|
1
|
|
UK
|
4
|
4
|
4
|
4
|
4
|
4
|
4
|
4
|
4
|
Source: own elaboration based on European Commission (2014–2022), International Energy Agency (2014–2022) and EFET (2014–2022).
The institutions rankings deserve more detailed explanations, as they build on qualitative data. An immediate conclusion stemming from the data presented in Table 1 is that the United Kingdom is a leader when it comes to institutional performance according to all the sources used. This is because the country operated the most liquid market out of the group considered throughout the research period and was the only one to be awarded a full score by EFET throughout the years analyzed. Although this may seem trivial, the fact that all the communication, legislation and documents relating to the gas sector’s functioning is available in English, gives the UK an outright advantage when it comes to transparency. It deserves to be noted that liquidity on that market dropped considerably after the 2016 decision to leave the European Union (Heather 2019). The IEA reports also underline that in 2017 the HHI market concentration index on a wholesale level fell below the 1000 threshold, signaling well-developed competition. The Agency has also underlined that country’s main legal document, the Gas Act, required a more holistic revision only in 2017 i.e. after 31 years, proving the country’s remarkable regulatory stability.
Scores attributed to Denmark are nearly as stable as was the case for the UK although differences in views between the evaluation by the IEA and the two other sources are quite apparent. The Agency praised Denmark for being a net gas exporter for most years, which separated out the transmission system operator from commercial activities already back in 2012. It also points to the fact that as of 2015 majority of trades were concluded at the exchange and not bilaterally, improving the quality of the price signal offered to the market. Following the introduction of market-based balancing rules in 2014, supply and demand in the Danish network could be largely balanced using standardized gas products traded on the exchange. These changes caused the Danish gas sector to rely on the market to help optimizing the use of infrastructure and arrive at optimal price for gas, justifying an improved score for the sector as of 2015. In 2016 the country’s exchange joined the joint gas trading platform called PEGAS, attracting traders from several countries, including France and Germany. In 2019 the country has finished merging its market with Sweden, which can be treated as an institutional success, as the process required a lot of coordination and mutual trust that has never happened before in the gas sector (Heather 2021a). Nonetheless, the EFET hub evaluation reports noted that the Danish market remains rather illiquid, which can be attributed to its small domestic demand. This had a spill-over effect with the market being unable to attract price reporting agencies that would improve transparency. In addition, the Gas Hub Study signals that other market indices were preferred by the market participants as a reference for bilateral transactions concluded in Denmark. This by no means implies the non-performance of the Danish sector but confirms its rank in the research group analyzed. Similarly, the EU Commission noted that first gas market-based prices for the country could only be quoted in 2014 and that, over time, this market continued to operate as a satellite to the more liquid hubs of Germany and the Netherlands. It deserves to be noted, however, that the reports analyzed here did not place much emphasis on the development of biomethane, which undoubtedly remains an important success of the Danish institutions.
For other countries, the results are more volatile, with Germany being an interesting object to study. Here, the situation is opposite to the case of Denmark, with the IEA being the most critical of Germany’s regulatory setup. The Agency noted that much effort has been made to merge the initial 20 regional market areas down to six in 2009 and two in 2013, yet concluded that these markets remained illiquid despite having the prerequisites to become the largest market of the EU (International Energy Agency 2013). This was believed to be caused by competition being limited to very few large suppliers and limited monitoring powers of the national regulatory authority at the beginning of 2014. In addition, the Agency pointed to the country having several transmission network operators, offering varying level of transparency, making the functioning of the sector unnecessarily costly and complex. IEA also noted that the 2014 revision of the support scheme to biogas has resulted in a major slowdown in investment, whereas the actual market merger between the two remaining market areas had to be imposed through an administrative decision taken in 2017 (International Energy Agency 2021). EFET scorecard conversely noted that liquidity on the two German market areas has improved considerably as of 2015, even if these markets remained far behind the UK. The association noted, however, that certain conditionality remained in place in terms of using the German gas network and that multiple new levies imposed on gas consumers over the years were a disincentive to consume or trade gas. EFET has also emphasized that in many cases consultation held by the regulatory authority was not done in English and the fact that the gas infrastructure remains fragmented does not support pooling of liquidity. Nonetheless, the score attributed to the German sector by EFET has increased from 15,5 to 17,5 out of 20 over the analyzed period, with illiquidity of the forward market being the main missing component. The EU Commission was critical of the country’s reliance on supplies from Russia that, in turn, could have negative impact on supply security of the entire region – this even resulted in an administrative restriction on the use of the Nord Stream pipeline in 2016 (more information can be found in Yafimava 2017). Nonetheless, the quarterly reports have recognized competition picking up as of 2015 to a level where no additional stimulation from the institutions would be needed, marking a major improvement in terms of sectoral performance, at least from this study’s perspective. The Commission also took note of the eventual market integration in Germany in October 2021, although it did signal that the process did not result in any major increase in market liquidity.
Finally, according to the results presented in Table 1, France was typically ranked behind the German gas market, not least because of physical internal bottlenecks that have divided the country into three market areas that were gradually merged into two in 2015 and a single market in November 2018 (Dukhanina et al. 2019). Southern France was notoriously falling behind other EU markets and paying a premium for the gas supplied, according to the 2014 evaluations from the European Commission. Gradual merger has improved the situation to an extent, although the southern part of the country was still seen as vulnerable and paying a premium versus the more liquid markets until the full French gas market merger. On the negative side, both EFET and IEA have consequently criticized the country for the legal requirement to fill gas storage facilities that crowded out commercial use of these assets. The obligation has been successfully amended in 2018 along with the introduction of improved mechanisms to govern internal congestions between the northern and southern market areas. It should also be noted that, with the exception of 2015, the average EFET score for the French hubs was closely aligned with the one calculated for the German markets, with differences being marginal and sometimes even in favor of the French gas sector. As of 2017 EFET noted that market-based competition in France increased to a point where further institutional stimulation would no longer be needed. The average value of the Ins variable calculated on the basis of the three rankings has been presented in Figure 1.
Figure 1. Institutions variable values, [scale of 0÷4]
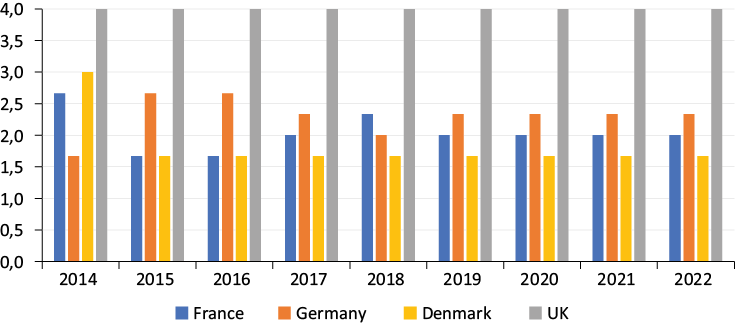
Source: own elaboration.
Table 2 below presents the interconnectivity of the national gas transmission networks, calculated through dividing the average daily interconnection capacity with the neigbouring countries and the maximu daily domestic demand recorded in a given year.
Table 2. Average interconnection capacity to maximum daily demand
|
2014 |
2015 |
2016 |
2017 |
2018 |
2019 |
2020 |
2021 |
2022 |
|
France
|
1,42
|
0,76
|
0,71
|
0,74
|
0,89
|
0,87
|
0,81
|
0,92
|
1,14
|
|
Germany
|
3,90
|
1,55
|
1,50
|
1,17
|
1,19
|
1,35
|
1,28
|
1,48
|
1,53
|
|
Denmark
|
0,40
|
0,44
|
0,70
|
0,47
|
0,65
|
0,96
|
0,48
|
5,28
|
8,50
|
|
UK
|
1,70
|
1,32
|
1,26
|
1,21
|
1,10
|
1,02
|
0,88
|
1,08
|
1,41
|
Source: own elaboration based on Eurostat (2014–2022) and GIE (2014–2022a).
Similarly, Table 3 presents the gas storage capacity in the countries analysed, compared to the annual inland consumption size.
Table 3. Gas storage capacity to annual inland gas consumption [%]
|
2014 |
2015 |
2016 |
2017 |
2018 |
2019 |
2020 |
2021 |
2022 |
|
France
|
34,74
|
32,31
|
29,56
|
29,40
|
30,70
|
30,09
|
32,30
|
30,32
|
36,40
|
|
Germany
|
38,69
|
37,63
|
34,86
|
32,55
|
33,49
|
32,74
|
33,19
|
32,15
|
37,82
|
|
Denmark
|
28,79
|
28,12
|
27,41
|
28,19
|
28,47
|
29,34
|
32,95
|
32,95
|
38,76
|
|
UK
|
5,80
|
5,68
|
5,08
|
5,21
|
5,15
|
5,47
|
5,47
|
5,69
|
6,95
|
Source: own elaboration based on Eurostat (2014–2022) and GIE (2014–2022b).
Both Tables, 2 and 3 depict the data that is set to capture the flexibility that the gas infrastructure can offer its users. In terms of interconnection capacity, fluctuations result from e.g. additional investment being made in building new, or expanding existing interconnection points, but also different administrative decisions that affect the usable interconnection capacity (such as the aforementioned restriction on the use of NordStream import capacity). One most notable change can be observed for Denmark that has invested in new transit connection pipelines taking gas from the major route of Norwegian gas exports from the North Sea to Poland. In addition, quite substantial fluctuaions stem from a highly volatile peak demand in a given year, highly reliant on the weather and also on exceptional events such as the economic lockdown following the spread of Covid-19 virus in 2020 (Honore 2020).
Similar effects can be observed for storage capacities, particularly since in this case the actual capacity of the facilities remained stable over the analysed period. This stability stems from the fact that the analysed countries have fully developed the space available for storing gas underground already before the start of the research period (United Nations Economic Commission for Europe 2013). Both the cross-border and storage capacities have been used to reflect the overall network flexibility and the results have been presented in Figure 2.
Figure 2. Gas infrastructure flexibility variable, normalized [scale of 0÷1]
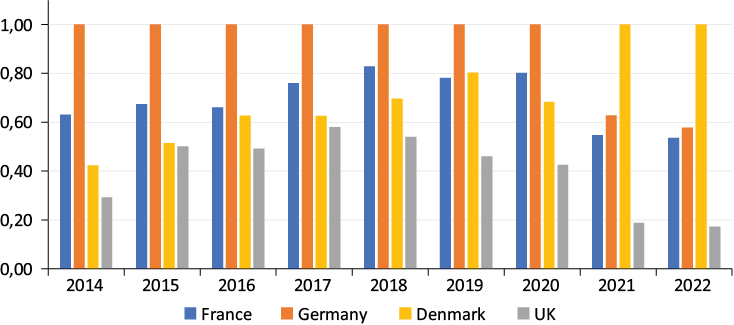
Source: own elaboration.
The results seem particularly negative for the United Kingdom, although this is largely the effect of a considerable domestic demand that, until recently, was satisfied to a significant extent by domestic production – IEA reports indicated that nearly 50% of domestic demand was covered by gas production in 2017. This, however, is no longer the case and the same reports signaled a very sharp decline in production and limited storage capacity, collectively putting the UK at a disadvantage in this category. The subsequent decline of UK’s relative score in the last two years stems from the major expansion of flexibility in Denmark.
Table 4. Calculated number of jobs created through the deployment of biomethane [full-time equivalent]
|
2014 |
2015 |
2016 |
2017 |
2018 |
2019 |
2020 |
2021 |
2022 |
|
France
|
60
|
120
|
624
|
1224
|
2088
|
2952
|
3816
|
4680
|
5544
|
|
Germany
|
3573
|
3807
|
4018
|
4093
|
4189
|
4375
|
4458
|
4556
|
4614
|
|
Denmark
|
883
|
1000
|
1367
|
1967
|
2033
|
2333
|
2500
|
2970
|
3527
|
|
UK
|
1656
|
2400
|
3192
|
3384
|
3432
|
3456
|
3456
|
3480
|
3600
|
Source: own elaboration based on Navigant (2019), BNetzA (2014–2022), Danish Energy Agency (2021), Ministere de la Transition Ecologique (2014–2022) and Department for Business, Energy and Industrial Strategy (2021).
Table 4 presents the calculated number of jobs created (full-time equivalent) in the economy through the deployment of biomethane specifically. These results indicate a relative stagnation in the UK and Germany and very robust growth in Denmark and France. The latter stems from very ambitions biomethane deployment strategies supported by attractive incentives offered to investors. Although the results may seem insignificant from a sectoral perspective, it deserves to be noted that these values do not factor in biogas plants (i.e. plants that do not upgrade gas into the quality of natural gas) which are far more widespread – this, however, results from the fact that biogas as such serves as a fuel for electricity production and does not constitute a direct substitute to natural gas, hence falls out of scope of this study. Values from Table 4 have also been depicted in Figure 3 to better reflect the sharp build-up of biomethane production capacity in France and Denmark.
Figure 3. Jobs creation variable values [full-time equivalent]
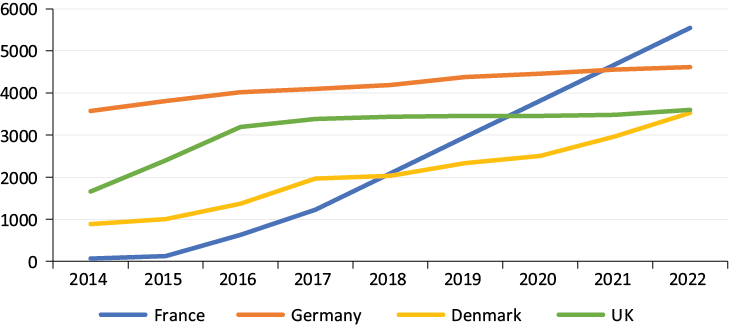
Source: own elaboration based on Navigant (2019), BNetzA (2014–2022), Danish Energy Agency (2021), Ministere de la Transition Ecologique (2014–2022) and Department for Business, Energy and Industrial Strategy (2021).
The final variable considered was the gas price paid by large industrial consumers – calculated average for each country following Eurostat data has been presented in Table 5 and Figure 4.
Table 5. Average industrial gas consumer price
|
2014 |
2015 |
2016 |
2017 |
2018 |
2019 |
2020 |
2021 |
2022 |
|
France
|
30,28
|
30,33
|
23,95
|
26,25
|
31,88
|
24,75
|
20,80
|
55,78
|
102,60
|
|
Germany
|
29,50
|
27,43
|
21,93
|
22,35
|
25,00
|
22,38
|
17,33
|
35,63
|
67,55
|
|
Denmark
|
29,88
|
27,68
|
23,53
|
22,43
|
25,58
|
25,40
|
21,30
|
33,25
|
83,55
|
|
UK
|
27,78
|
26,55
|
19,20
|
18,03
|
21,45
|
20,38
|
18,49
|
29,75
|
44,59
|
Source: own elaboration based on Eurostat (2014–2022).
Figure 4. Average gas price [EUR/MWh]
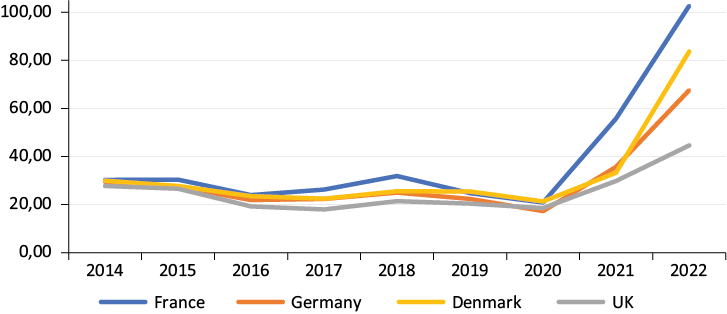
Source: own elaboration based on Eurostat (2014–2022).
One immediate observation stemming from analyzing the data in Table 5 and Figure 4 is the relatively close alignment between the prices paid by consumers in different countries, particularly by the year 2020. More specifically, in 2014 and 2015 the average spread between UK and Germany, as well as Germany and Denmark was close to just two and one EUR respectively. As mentioned before, southern region of France was notoriously paying a premium over the prices paid in other EU countries which is reflected by the average industrial gas consumer price calculated for this study. More noticeable differences arise past 2020, with the spread between the UK and France reaching nearly 39 EUR. Similarly, Denmark’s industrial gas consumers have experienced a sharp increase in the gas price – in both cases it can be assumed that, apart from the universal negative effects of the energy crisis, this surge also stems from the fast, induced build-up of biomethane production capacity.
After the values of the SCIG components were established for the entire research period, they had to be normalized to ensure their additivity. Depending on the nature of the variable, its high value could act either to the benefit or detriment of the overall SCIG score – this division into stimulants and destimulants respectively had to be reflected in the normalization method. Hence, a different calculation was applied to the gas price, the high value of which is deemed damaging to sectoral competitiveness. Following the approach proposed by Bluszcz (2020), the normalization was done through referencing each variable against the maximum or minimum value of that variable in the entire research group in a given year i.e.:
$$i_{xc}= {v_{xc} \over max \;v_{x}}\;(for \; stimulants)
$$
$$i_{xc}= {min \;v_{x} \over v_{xc}}\;(for \; destimulants)
$$
where:
vxc – value of variable x calculated for country c,
max vx – maximum value of variable x among all the countries in a given year,
min vx – minimum value of variable x for all the countries in a given year.
Once normalized, the values of the variables could be summed up into a single synthetic measure, the value of which was calculated as simple arithmetic average, allowing the score to be measured on a scale of 0÷1 for ease of interpretation:
$$SCI_{G}=\sum_{i=1}^n {i_{xc}\over n}
$$
The calculated values of the Sectoral Competitiveness Index for Gas have been presented in Figure 5.
Figure 5. Sectoral Competitiveness Index for Gas values [scale of 0÷1]
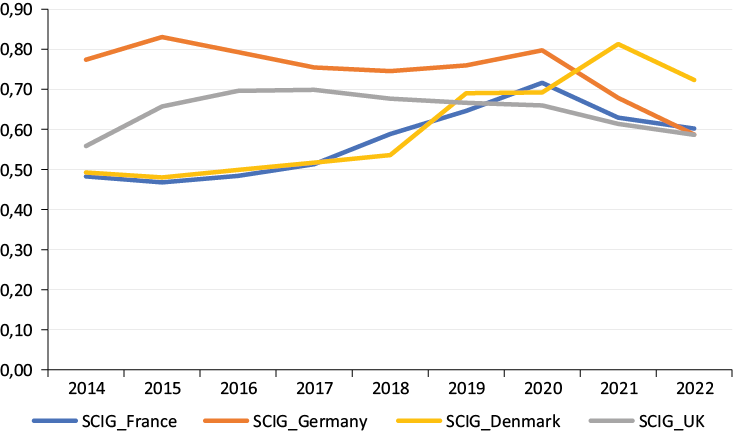
Source: own elaboration.
The results signal strong historical dominance of the German gas sector in the analyzed group, which stemmed from a combination of a well-developed gas infrastructure and relatively low gas prices, possibly stemming from a favorable import arrangement with Russia (Bros, Mitrova, Westphal 2017). This dominance ended not only due to cut of outright supply of gas from Russia in 2022, but also because of considerable investment in gas infrastructure and biomethane deployment made by France and Denmark.
Secondly, it is worth noticing the United Kingdom’s loss of competitive position over time that was previously established thanks to the country’s tried and tested institutional environment. That result was largely undermined by the relatively low gas infrastructure flexibility referenced against a high domestic demand, despite the UK’s sizeable LNG import capacity. The decision to leave the European Union also had a negative effect on the country’s gas market and this, according to the SCIG, was not counterbalanced by a considerably lower gas price offered to industrial consumers. Another factor that has negatively affected the overall score of the British gas sector is the reform of the subsidy scheme for biomethane that has failed to attract investors (Department for Energy Security & Net Zero 2023).
The third country that stands out is Denmark – this is due to the country’s sizeable gas infrastructure compared to a very modest domestic gas demand. In addition, the country is well advanced in biomethane production and use, with its share in domestic consumption exceeding 40% already in 2022 (Robb 2022). This undoubtedly places Denmark at the forefront of gas sector decarbonization, which is correctly reflected by the SCIG value.
Finally, the domestic market consolidation efforts in France, combined with its ambitious strategy to develop biomethane production, has allowed the country to improve its relative competitive position and surpass both Germany and the United Kingdom in the final year of the analysis. France has managed to develop market-based solutions to manage internal north-south gas network congestion that have previously been administered through dedicated use of storage facilities. This has allowed internal integration of the market that, together with a successful strategy supporting the development of biomethane production, has supported establishing good competitive position in spite of relatively high gas prices paid by the French industrial consumers.
Conclusions and policy implications
The case study results confirm the usefulness of SCIG in comparative analyses of liberalized gas sectors performance. It helps contextualizing the different developments in these sectors, through taking a more holistic view on changes taking place in the physical and regulatory spheres and how these eventually impact the gas sector’s performance. It also confirms that a sector-specific approach needs to be taken to properly capture the nature of economic activity and its specific features that, as is the case for the European gas sector, cannot rely solely on productivity measures.
The results indicate that the relative sectoral competitive position may not be intuitive as investment made in decarbonizing the gas market may indeed reinforce the sector’s relative standing rather than damage it through increased prices. The example of Denmark serves as a flagship example in this case, with biomethane gradually becoming the key source of gas in the country, creating jobs and underpinning the continued use of the infrastructure in the future. Similarly, France, through market consolidation efforts and an ambitious gas sector decarbonization strategy, has improved its gas sector’s performance considerably. It deserves to be noted, however, that the price spike for French end customers is more notable. This may be related to the type of support scheme applied and the additional burden it has created for end customers.
Another important implication arises when looking at the case of Germany, showing that the price of gas offered to end customers remains an important determinant of sectoral competitiveness. For the German gas sector, falling share of gas supplied from Russia under a favorable long-term contract has resulted in a considerable deterioration in sectoral performance, in spite of the great flexibility offered by the gas network and sizable renewable gas production (Jain 2019). Similarly, and as highlighted by Heather (2021b), the induced integration of the country’s two major trading regions, has not really translated into any major improvement in overall market performance and, as such, did not make up for the sudden end of cooperation with Russia.
The case of the United Kingdom confirms that the phenomenon of competitiveness should be studied through comparative analyses. The country’s considerable experience in liberalizing and regulating the gas sector, its considerable demand for gas and lower price of the commodity offered on average to industrial consumers, have collectively failed to defend its gas sector’s competitive position over time. This is due to the decision to leave the European Union following the referendum of 2016, which has discouraged investment and trading activity in favor of the markets inside the EU (Bros 2017). It is also worth noting that the 2021 reform of the support scheme for biomethane has proved to attract very few investments in the five-year horizon that it is set to cover (Department for Energy Security & Net Zero 2023).
Finally, and most importantly – in view of the competitiveness theories presented in this study, it should be noted that ultimately all the components of the SCIG refer back to the institutional performance of the bodies governing the gas sector. In terms of gas infrastructure, it needs to be recognized that hardly any large-scale investment in the high-pressure gas network can be realized without the government’s intermediation and support (Hashimoto 2022). For the time being, given the considerable capital intensity of the production process, the development of biomethane production also depends heavily on state support – and the example of Denmark and France shows that such subsidy schemes can have a very different impact on the end-customer bills. This also links the institutional performance to the last component, gas price, although the connection does not end there, since it is the institutional setup of the gas sector that is to ensure and safeguard the cost-reflectivity of the tariffs that network users pay to use the infrastructure.
On the limitations side, the most notable flaw of the SCIG is its reliance on qualitative data that are both prone to subjectivity and very time-consuming to collect. This issue can be addressed through referring to several sources of information impartially analyzing the sectoral performance, as was done in this study. When it comes to the structure of the SCIG itself, the results acquired in this study suggest that the introduction of weights to its components could be considered – for example, the case of the United Kingdom suggests that storage capacity may not be of equal gravity to different countries and can be attributed a lower weight (see e.g., Le Fevre 2013). Future research can focus on expanding the geographical scope of the study and exploring the extension of the SCIG through considering other variables, for example, reflecting greenhouse gas emissions savings achieved through different initiatives in the sector.
Paweł Lont – Ph.D., University of Lodz, Faculty of Economics and Sociology, Department of International Trade, pawel.lont@uni.lodz.pl
References
Agency for the Cooperation of Energy Regulators (ACER), (2023), European gas market trends and price drivers, ACER 2023 Market Monitoring Report, Ljubljana.
Aiginger K., Bärenthaler-Sieber S., Vogel, J. (2013), Competitiveness under New Perspectives, OECD Working Paper, vol. 44.
Al-Shafi M., Massarweh O., Abushaikha A.S., Bicer, Y. (2023), A review on underground gas storage systems: Natural gas, hydrogen and carbon sequestration, Energy Reports, vol. 9.
Banet C. (2023), Building Europe’s Hydrogen and Renewable Gas Market, Centre on Regulation in Europe, Brussels.
Beale E., Beugin D., Dahlby B., Drummond D., Olewiler N., Ragan C. (2015), Provincial Carbon Pricing and Competitiveness Pressures, Canada’s Ecofiscal Commission, Montreal.
Bluszcz A. (2020), Multidimensional comparative analysis as a tool for assessing the level of development of energy markets in selected European countries, IOP Conference Series: Earth and Environmental Science, vol. 609(1).
Bros A., Mitrova T., Westphal K. (2017), German-Russian Gas Relations. A Special Relationship in Troubled Waters, SWP Research Papers, vol. 13(1).
Bros T. (2017), Brexit’s Impact on Gas Markets. Irish options: IBP, NBP or TTF?, OIES Energy Comment, Oxford.
Cardinale R. (2023). Liberalization and the volatility of gas prices: Exploring their relation in times of abundance and scarcity, “Competition and Regulation in Network Industries”, 24(2–3).
Chikán A. (2008), National and firm competitiveness: a general research model. Competitiveness Review, “International Business Journal”, 18(1/2).
Council of European Energy Regulators (CEER), (2011), Draft Vision for a European Gas Target Model, CEER, Brussels.
Danish Energy Agency (DEA) (2021), Green Gas Strategy, DEA, Copenhagen.
Department for Business, Energy and Industrial Strategy (BEIS), (2021), Final Stage IA Assessment for the Green Gas Support Scheme/Green Gas Levy, BEIS, London.
Department for Energy Security & Net Zero (2023), Green Gas Support Scheme Mid-Scheme Review, Department for Energy Security & Net Zero, London.
Dukhanina E., Massol O., Leveque F. (2019), Policy measures targeting a more integrated gas market: Impact of a merger of two trading zones on price and arbitrage activity in France, “Energy Policy”, 132.
European Biogas Association (EBA), (2015), United Kingdom, EBA, Brussels.
Flejterski S. (1984), Istota i mierzenie konkurencyjności międzynarodowej, “Gospodarka Planowa”, 39(9).
Halkos G. (2020), Examining the level of competition in the energy sector, “Energy Policy”, 134.
Harvey M. (2014), The Food-Energy-Climate Change Trilemma: Toward a Socio-Economic Analysis, “Theory, Culture & Society”, 31(5).
Hashimoto S. (2022), The Importance of Government Support for Pipeline Network Construction, [in:] R. Sayeed, A.I. Mohamed (eds.), Pipeline Engineering – Design, Failure, and Management, IntechOpen, London.
Heather P. (2019), European Traded Gas Hubs: a decade of change, OIES Energy Insight 55, Oxford.
Heather P. (2021a), European Traded Gas Hubs: German hubs about to merge, OIES Paper: NG 170, Oxford.
Heather P. (2021b), European Traded Gas Hubs: German THE fails to impress, OIES Energy Comment, Oxford.
Honore A. (2019), Decarbonization and industrial demand for gas in Europe, OIES Paper: NG 146, Oxford.
Honore A. (2020), Natural gas demand in Europe: The impacts of Covid-19 and other influences in 2020, OIES Energy Comment, Oxford.
Hulshof D., van der Maat J., Mulder M. (2016). Market fundamentals, competition and natural-gas prices, “Energy Policy”, 94.
International Energy Agency (IEA), (2013), Energy Policies of IEA countries: Germany 2013, IEA, Paris.
International Energy Agency (IEA), (2021), Implementation of bioenergy in Germany – 2021 update, IEA, Paris.
International Energy Agency (IEA), (2022), Natural Gas-Fired Electricity, IEA, Paris.
International Energy Agency (IEA), (2023), Denmark 2023. Energy Policy Review, IEA, Paris.
Jain S. (2019), Market report: Germany, World Biogas Association, London.
Juris A. (1998), Market Development in the U.K. Natural Gas Industry: The Emergence of Spot, Financial and Pipeline Capacity Markets, World Bank, Washington.
Kabeyi M.J.B., Olanrewaju O.A. (2022), Biogas Production and Applications in the Sustainable Energy Transition, “Journal of Energy”, 2022.
Kettner C., Wretschitsch E. (2023), Taxes and Subsidies in EU Energy Policy – Fit for 55?, Österreichisches Institut für Wirtschaftsforschung Working Papers 656, Vienna.
Kulikov G. (2000), Japonskij menedzhment i teorija mezhdunarodnoj konkurentosposobnosti Ekonomika as cited, [in:] G. Kharlamova, O. Vertieleva (2013) International Competitiveness of Countries: Economic-Mathematical approach, “Economics and Sociology“, 6(2).
Law no 2015-992 du 17 août 2015 relative à la transition énergétique pour la croissance verte (1), Journal Officiel De La République Française, DEVX1413992L.
Le Fevre C. (2013), Gas Storage in Great Britain, OIES Paper: NG 72, Oxford.
Manyika J., Mendonca L., Remes J., Klussmann S., Dobbs R., Karkun K., Klinstov V., Kuekenshoener C., Nikomarov M., Roxburgh C., Schubert J., Tacke T., Toermanen A. (2010), How to compete and grow: A sector guide to policy, McKinsey Global Institute, New York.
Mejia J., Aliakbari E. (2022), Canada-US Energy Sector Competitiveness Survey 2022, Fraser Institute, Vancouver.
Naef I. (2024), The impossible love of fossil fuel companies for carbon taxes, “Ecological Economics”, 217.
Navigant (2019), Job creation by scaling up renewable gas in Europe, Navigant Netherlands B.V., Utrecht.
Porter M. (1990). The Competitive Advantage of Nations, “Harvard Business Review”, 3.
Robb S. (2022), Denmark heads for 100% biomethane by 2030, “Irish Farmers Journal”, 12.
Romero-Marquez I., Moreno-Bird J.C. (2015), Export competitiveness in an oil and gas economy: the case of Trinidad and Tobago, 1985–2010, “Cepal Review”, 117.
Scarlat N., Dallemand J.F. (2011), Status of the implementation of biofuels and bioenergy certification systems. Major implications, reporting constraints and implementation controls, Publications Office of the European Union, Luxembourg.
Schwab K. (2013), The Global Competitiveness Report 2013–2014, World Economic Forum Insight Report, Geneva.
Siudek T., Zawojska A. (2014), Competitiveness in the Economic Concepts, Theories and Empirical Research, “Oeconomia”, 13(1).
Soltani M., Hajipour B., Tayebinia J. (2021), Identifying the factors affecting competitiveness: A case study of Iranian natural gas industry, “Energy Strategy Reviews”, 36.
Thomas S. (2005), The European Union Gas and Electricity Directives, Research Institute of the University of Greenwich, Greenwich.
United Nations Economic Commission for Europe (2013), Study on Underground Gas Storage in Europe and Central Asia, United Nations, Geneva.
Van Stiphout M. (2023), Gas Quality Standards in the European Union. The need to develop European gas quality standards to achieve market integration and a competitive gas appliance market, International Gas Union, London.
Wright P. (2005). Liberalisation and the security of gas supply in the UK, “Energy Policy”, 33(17).
Yafimava K. (2017), The OPAL Exemption Decision: a comment on the CJEU’s ruling to reject suspension, “Oxford Energy Insights”, 18(1).
Databases
Bundesnetzagentur (BNetzA), (2014–2022), Marktstammdatenregister, https://www.marktstammdatenregister.de/MaStR/Einheit/Einheiten/OeffentlicheEinheitenuebersicht#gaserzeugung
European Commission (2014–2022), Gas Market Report, https://circabc.europa.eu/ui/group/3ef9355f-1ffe-4c82-ba19-f60a3ed2f652/library/295bae48-18a2-4901-afbe-edc7dcd40dee?p=1&n=10&sort=modified_DESC
European Federation of Energy Traders (EFET), (2014–2022), European Gas Hub Study, https://efet.org/home/documents?id=19
Eurostat (2014–2022), Statistical Data Warehouse, https://ec.europa.eu/eurostat/web/energy/database
Gas Infrastructure Europe (GIE), (2014–2022a), LNG Database, https://agsi.gie.eu/
Gas Infrastructure Europe (GIE), (2014–2022b), Storage Database, https://agsi.gie.eu/
International Energy Agency (IEA), (2014–2022), Energy policies of IEA countries, https://www.oecd-ilibrary.org/energy/energy-policies-of-iea-countries_19900082
Ministere de la Transition Ecologique (2014–2022), Data Lab, https://www.statistiques.developpement-durable.gouv.fr/edition-numerique/chiffres-cles-energies-renouvelables-2021/index
Streszczenie
Rozwiązania instytucjonalne na rzecz rozwoju konkurencyjności sektora gazu ziemnego w UE
Badaniu poddane zostało zagadnienie konkurencyjności sektorowej na przykładzie sektora gazu ziemnego w wybranych krajach Europy. Literatura przedmiotu z ostatnich lat wskazuje na ewolucję definicji zjawiska konkurencyjności, które wykraczają obecnie poza zagadnienia stricte ekonomiczne. Mimo to, badania sektora gazu ziemnego w tym zakresie skupiały się dotychczas na konkurencyjności eksportu i działalności wydobywczej. By zapełnić tę lukę badawczą, Autor przeprowadził analizę obejmującą cały sektor gazu ziemnego, odwołującej się do miar spoza tradycyjnego zestawu miar produktywności. Stworzono dedykowaną miarę syntetyczną, która ma umożliwiać analizę porównawczą współczesnych sektorów gazu ziemnego, uwzględniająca ceny oferowane odbiorcom końcowym, efektywność instytucjonalną, stopień rozwoju infrastruktury oraz potencjał do kreacji nowych miejsc pracy. Następnie zaprezentowano wyniku studium przypadku obejmującego cztery kraje, które zliberalizowały sektor gazu ziemnego, a przy tym w różnym stopniu pozostają zależne od importu tego surowca. Wyniki potwierdzają przydatność miernika syntetycznego do kompleksowej analizy względnej pozycji konkurencyjnej danego sektora gospodarki. Wyniki potwierdzają również znaczenie struktury instytucjonalnej z perspektywy promowania nowych inwestycji, budowania płynności rynku gazu ziemnego oraz potencjału do tworzenia trwałych miejsc pracy.
Słowa kluczowe: gaz ziemny, liberalizacja, konkurencyjność sektorowa
© by the author, licensee University of Lodz – Lodz University Press, Lodz, Poland. This article is an open access article distributed under the terms and conditions of the Creative Commons Attribution license CC-BY-NC-ND 4.0 (
https://creativecommons.org/licenses/by-nc-nd/4.0/)
