
This article presents local government expenditures on family foster care in terms of their spatial concentration. The main aim of the study is to capture regional differences in the financing of family foster care in Poland. The location quotient and the shift-share analysis were applied in the study. The spatial disparities in the functioning of social assistance, in terms of foster family care, in Poland have been detected. These differences are caused by higher revenues for budgets, resulting in major additions to social benefits.
Keywords: local government, foster care, public expenditures, childcare
JEL: I38, J13
Social policy is the state’s activity, local governments, and non-governmental organizations aimed at shaping the general working and living conditions of the population. It is based on equality and social justice, conducted to satisfy social needs at the available level (Kurzynowski 2006; Stecko 2017). The social policy and institutions of the welfare state, especially the educational system and social assistance, are the primary channel of expressing social rights (Zamorska 2010). By ensuring a minimum standard of living, the state compensates for inequalities caused by market distribution mechanisms and minimizes violence in interpersonal relationships. Social rights, being redistributive rights, impose certain obligations on both parties (Balcerzak-Paradowska 2004; Zamorska 2010). In modern Poland, the subject of special attention to social policy are obstacles that block the possibility of satisfying basic human needs. The most critical social issues in our country are, among others, poverty, unemployment, social pathologies, housing issues, health care, and educational gap (Kwapiszewska & Kwapiszewski 2012).
The state social policy refers to several tasks carried out by specialized organizational units service-oriented society. The central entity of social policy is the local government. Due to the decentralization processes, social policy rights were delegated to the level of municipal local government units (Stecko 2017). Thus, the local government has a relatively wide range of competences. Its tasks include all public matters of local importance, in particular, meeting the collective needs of the population (Kwapiszewska & Kwapiszewski 2012). The state’s social policy instrument is social assistance (based on the Act of 12 March 2004 on Social Assistance). It aims to enable individuals and families to overcome the difficult life situation that they are unable to overcome using their rights, resources, and opportunities.
Social policy is usually understood as purposeful actions of the state, aimed at directly satisfying social needs. Social assistance is recognized as a method of achieving social policy goals (Sierpowska 2011). The Act on Social Assistance introduces a division into cash and non-cash benefits. According to article 36 of the Act of 12 March 2004 on Social Assistance, monetary benefits include permanent benefit, periodic allowance, targeted allowance and special targeted allowance, allowance and loan for economic self-empowerment, or assistance for self-empowerment and continuing education. The organization of foster care in Poland is divided into family and institutional foster care. Graph 1shows the details.
Graph 1. The division of foster care in Poland
Source: own elaboration
The family foster care can be created by ascendants or child siblings (related foster family), extended family (non-professional foster family), or professional serving as a family emergency and specialist profession (professional foster family). Different types of family foster care also have different funding levels and the maximum number of children in a family. In non-professional and professional families, there are up to three children, and in foster family home max. eight children. The amount of the benefit in the year 2021 is a minimum of 1131 PLN (243,88 EUR – based on the exchange rate on 11/15/2021). In the case of the related foster family, the amount of the benefit is minimum 1131 PLN (243,88 EUR),and in other cases – 694 PLN (160,87 EUR – based on the exchange rate on 11/15/2021). Support for caregivers is indexed if the inflation rate exceeds 5%. from the year in which the last change in the number of benefits took place. Then their amounts are raised from 1 June of the following year. The previous and, at the same time, the first indexation of benefits paid under the Act on supporting the family and foster care system took place on June 1, 2018 (Topolewska 2021).
Nowadays most children without parental care still have both parents but are placed in out-of-home care as a protective measure (Knuiman et al. 2015). Different scenarios are possible for these children. According to the law in force in Poland, it is therefore the duty of public authorities to provide the child with the opportunity to be brought up in a biological family, and if this is not possible, in family forms of foster care (Regional Center of Social Policy 2015). It is also necessary to provide assistance to the family by taking steps to return the child under family foster care to the biological family, as well as looking for forms of family foster care, before placing the child in an institutional form, and choosing the form of family foster care in this way (Regional Center of Social Policy 2015). Moreover, it is crucial that the child over whom foster family care is provided has the possibility of contact with the biological family.
To sum up, the legal regulations in force are to enable the creation of a coherent system of family support in a situation when a family cannot properly fulfill its functions. Actions undertaken within the framework of this system should provide the family with such assistance so as to eliminate the risk of taking a child from the biological family or ensure a quick return of those children who, due to their welfare, had to be periodically placed in foster care institutions (Regional Center of Social Policy 2015). However, financial resources are often not sufficient to provide the most desirable care (Knuiman et al. 2015). Thus, the purpose of the article will be to capture regional differences in the financing of family foster care in Poland. The study attempted to answer the following research question: are there any spatial disparities of the functioning of social assistance in Poland in the context of foster family care? The research conducted as part of the article tries to fill the research gap concerning the issue of financing foster care in Poland. The related literature in this area is not widely developed and therefore, no estimates of the total amount allocated to financing foster care per child (depending on the type of foster care) have been made so far.
The location quotient (LQ) and the shift-share analysis method were used for the purpose of this study. The empirical data used to conduct the research came from statistical yearbooks of individual voivodeships and the database of the Ministry of Family, Labor, and Social Policy in Poland.
The remaining part of this article is organized as follows. Section 1 concentrates on literature review on the subject in question. Section 2 presents the research method. Sections 3 presents results and undertakes the discussion in the context of formulated aims and research questions. The last section presents conclusions.
The critical challenge for social policy is to take into account the approach to broadly understood social assistance and its contemporary challenges posed by the current system of scientific knowledge, research results, and policies implemented at the national and EU level. One can distinguish the following factors: a changed family model (infancy of families, single parenthood), late age of starting a family, increase in the number of single-person households, negative birth rate, decreasing fertility, or an increase in average life expectancy. Research conducted by the Regional Centre for Social Policy shows that several phenomena strongly influence Poland’s shape of social policy. We could enumerate here: aging of the society, long-term or severe illness and disability, helplessness in matters of care and upbringing or homelessness, and deepening disintegration of social groups. What is more, Pac (Pac et al., 2017) suggested that families which most likely are involved in the child protective services are poor, minority, and often single-parent families who live in low-income neighborhoods (Barth et al. 2006; Berger & Waldfogel 2004; Drake et al. 2009; Pac et al. 2017). In the literature it is underlined that such families are at greater risk not only of involvement with these services, but also with entry into foster care due to substance abuse (Cunningham & Finlay 2013; McGuinness, TM. Schneider 2007) or family structure instability (L. Berger & Waldfogel 2004; LM. Berger et al. 2009; Paxson & Waldfogel 2003).
The research on foster care has been conducted worldwide because it is a genuinely essential notion in terms of social care analyzed from different angles. Regulska attempted to determine fundamental, organizational and legal changes concerning the functioning of educational care centers, which allowed to show the main directions of deinstitutionalization of the system of foster care in Poland. The author underlined that the new solutions, introduced in 2012, demonstrate a distinct paradigm shift of the pro-family policy in this area: preference for working with the natural family to eliminate the dysfunction before the need for foster care emerges. It points to the latest perspective on the care of orphaned children – moving away from institutional care towards family forms of foster care (Regulska 2015). Knuiman et al. describe the historical background and current situation of the child welfare system for children without parental care in Poland. Despite reforms aimed at deinstitutionalization and a growing number of foster care placements in Poland, almost 20,000 children remain in institutional care. For some children without parental care, domestic or international adoption is decided (Knuiman et al. 2015). Czepil and Karpenko (2019) underline that in modern Poland, the foster family is an important social institution that promotes the development of a child deprived of parental care and is prioritized over other institutional forms of care. Gruca-Miąsik analyzed foster family care from the Polish and American perspectives (Gruca-Miąsik 2003). Pac, Waldfogel, and Wimer estimated the poverty among foster children and concluded that foster care payments are likely play an essential role in reducing the risk of poverty in the studied group (Pac et al. 2017). Children living in foster care belong to a vulnerable child population afflicted by a wide range of acute and chronic psychosocial, mental, and even physical health conditions requiring multidisciplinary care services (AAP 2005). The organizational profile of services for vulnerable children should include special healthcare assistance provided by specialized personnel (Ringeisen et al. 2008). That is why, Ferrara et al. created a report to raise the awareness of the pediatric community and the public opinion toward the importance of investing in health programs offering adequate protection, prevention, and provision of care for the orphan, abandoned, maltreated, and neglected children (Ferrara et al. 2016). Gerber-Grote et al. underlined the necessity of starting a debate on the role of health economics in supporting child-friendly health care in Europe (Gerber-Grote et al. 2015). Moreover, Ortiz et al. conducted a study on the identification of fiscal space options for social and economic development for children and poor households in 184 countries (Ortiz et al. 2011).
One of the most critical factors determining the functioning of foster care is the expenditure incurred on this form of social assistance by relevant entities, which in Poland are local government units. The funds spent for this purpose are associated with various types of support, depending on the form of foster care.
However, it should be remembered that the scale of expenses related to the self-government’s implementation of tasks in this area does not ultimately prejudge the level and quality of operations of entities performing the function of foster care. One should not forget here about the enormous influence of people leading a given form of care on their pupils. The level of security, self-acceptance, and satisfaction of those under their care is challenging to quantify.
The research aims to identify the spatial concentration of expenditure on foster care in Poland.
For the diagnosis of concentration level and its changes over time (in 2012–2018), the location quotient (LQ) and the shift-share analysis method were used. The analysis was conducted from the perspective of 16 local government units in Poland. The location quotient reflects the degree of concentration of expenditure in individual provinces to the reference area (Poland). The indicator was calculated according to the formula (GB 2001):

where,


i = 1,2,3,4 (1 = related foster family, 2 = professional foster family, 3 = no-professional foster family, 4 = family children’s home)
Shift-share analysis has been widely applied to regional economic research. Empirical studies have conclusively confirmed it as a useful tool to depict environmental change (Shi & Yang 2008). The traditional form of the shift-share analysis was developed by Daniel Creamer in the early 1940s. It was later formalized by Edgar S. Dunn in 1960. It allows for the distribution of changes for regional (geographic, competitive, differentiating), cross-sectional (structural, sectoral), and global (national) components (Jewczak & Żółtaszek 2011). It is a descriptive data analysis tool used to study the development of a given area against the background of the reference area (Dunn 1960). This method is retrospective and can be used to compare the actual state of the region with the situation achievable if regional trends coincided with national ones (Grzybowska 2013). Its essence is a decomposition approach to economic changes in the regions taking into account three components (Leigh 2013):
National growth effect (abbrev. NGE) depicts the portion of the change attributed to the national economy’s total growth. It equals the theoretical change in the regional variable had it increased by the same percentage as the national economy.
Industry mix effect (abbrev. IME) characterizes the portion of the change attributed to the performance of the specific economic industry. It equals the theoretical change in the regional variable had it increased by the same percentage as the industry nationwide, minus the national growth effect.
Local share effect (abbrev. LSE) is the portion of the change attributed to regional influences and is the component of primary concern to regional analysts. It equals the actual change in the regional variable, minus the previous two effects.
Individual components were calculated according to the following formulas:

where,


i = 1,2,3,4 (1 = related foster family, 2 = professional foster family, 3 = no-professional foster family, 4 = family children’s home)
t – last year of the analyzed period (2018),
t–1 – the first year of the analyzed period (2012).
The sum of all abovementioned three components is called total shift (TS), which reflects the actual change in the level of expenditure on foster care in 2018 compared to 2012.

The research conducted in this study was aimed at the analysis and assessment of the spatial diversity of the functioning of social assistance (aimed at foster care) in the context of the expenditure policy of local government units in 16 Polish voivodeships with the help of locations quotient and shift-share analysis. Before these two main methods were implemented, the detailed analysis of expenditures on foster care had been carried out to bring closer the functioning of foster care in Poland. The empirical data used to conduct the research came from statistical yearbooks of individual voivodeships and the database of the Ministry of Family, Labor and Social Policy in Poland. By embedding the study in the years between 2012–2018, it will be possible to capture regional differences in foster care financing in Poland.
The expenditures incurred on foster care activities are an essential element affecting the quality of their functioning in this sector. They translate into its potential and also determine the ability to introduce new solutions. In the period of 2012–2018, the level of expenditures on foster care in Poland varied (Graph 2). The unfavorable tendency was their systematic decrease in 2013, 2016 and 2017. It was not until 2018 that the increase was recorded – however, compared to 2012, it was not significant. Fluctuations were also noted throughout the entire social welfare sector. However, unlike foster care, expenditures were increased more often than reduced.
The structure of financing foster care also varies. Most funds are allocated to related and non-professional foster families (Graph 3).
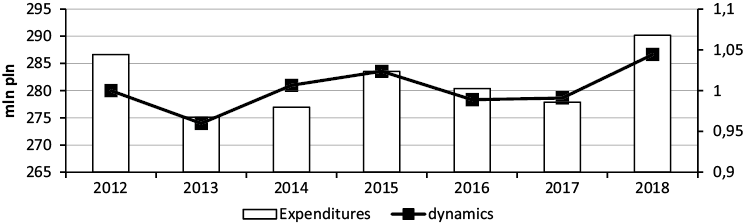
Graph 2. The level and dynamics of expenditure on foster care
Source: own application based on data from the CeSAR MRPiPS application
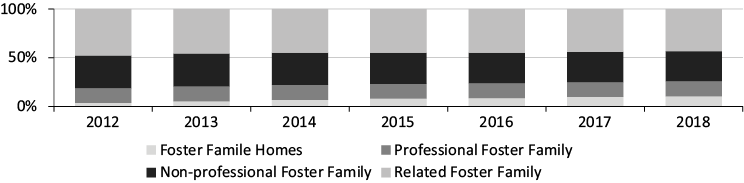
Graph 3. The structure of expenditures on different types of foster care.
Source: own application based on data from the CeSAR MRPiPS application
The analysis of the number of children covered by foster care in interregional terms shows that the highest concentration is recorded in the territory of two voivodeships: Masovian and Silesian (Graph 4).
On the other hand, the analysis of expenditure on foster care in interregional terms shows that they are concentrated, regardless of the type of foster care, mainly in Lower Silesian, Silesian and Masovian voivodeship (Graph 5).
However, the amounts allocated to foster care per child differ significantly, related to the different funding scale allocated to foster care by provincial authorities (Graph 6). It should be emphasized that local authorities subsidize foster care above the minimum thresholds set by the ministry.
The results of the analyzes carried out on expenses allocated to foster care are consistent with the results of the research presented by Czepil and Karpenko (2019). Furthermore, the authors also agree with Knuiman et al. (2015) that the financial resources allocated to care are insufficient. It is also difficult to disagree with Wojciuk and Zegarowicz, who stated that the problem of allocating funds in foster care is also related to the lack of transparency of family policy in Poland.
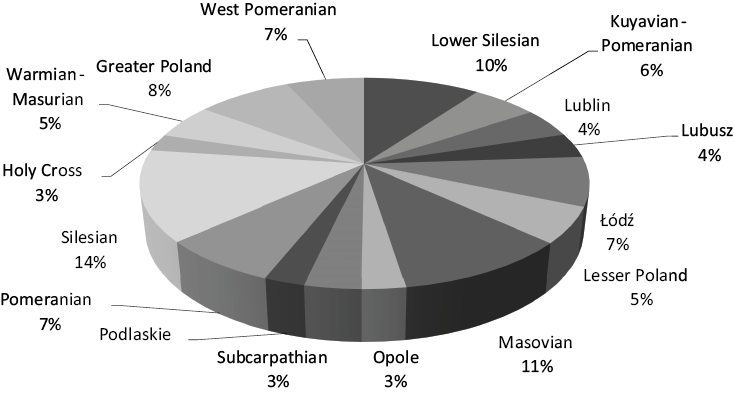
Graph 4. Mean number of children under foster care in Poland between years 2012–2018
Source: own compilation based on data from the CeSAR MRPiPS application
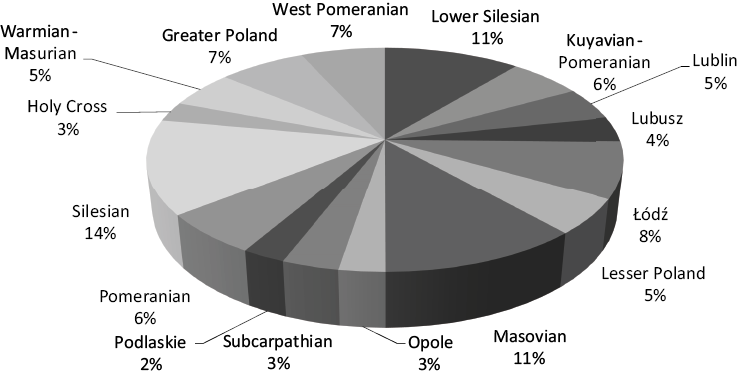
Graph 5. Mean expenditures of related foster families between years 2012–2018
Source: own compilation based on data from the CeSAR MRPiPS application
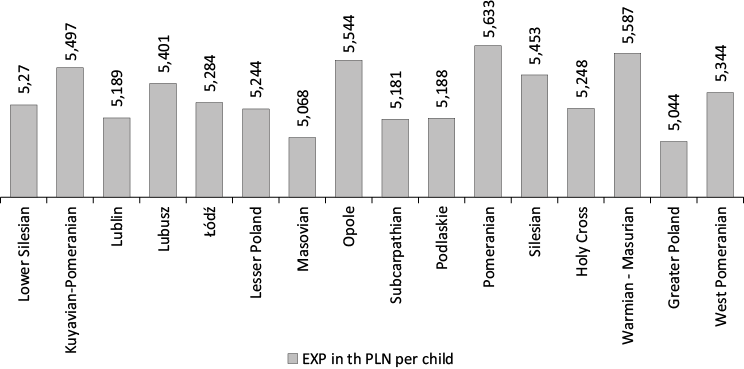
Graph 6. Mean expenditures per child in foster care in Poland between years 2012–2018
Source: own compilation based on data from the CeSAR MRPiPS application
In the first part of the study, LQ analysis was carried out. All four types of family foster care were analyzed here: family children’s home and foster families (related, non-professional, and professional). Due to a limited possibility of presenting the results in the article, the results referring primarily to family children’s homes are presented.
Referring to family children’s homes, on the average, in the years between 2012–2018, the highest concentration was recorded in the Opole and Pomeranian voivodeships (Table 1). However, the level of the LQ indicator was not significantly higher than the level in other voivodeships. Above average concentration of expenditures was also recorded in the following voivodeships: Lower Silesia, Kuyavian-Pomeranian, Lesser Poland, Holy Cross and West Pomeranian (LQ > 1).In the lowest classified voivodeships, expenditure on replacement care did not play such a significant role in intra-regional expenditure on foster care (LQ < 1). It also suggests that in their case, the functioning of foster care is not one of the leading tasks financed under the social policy. This state of spatial concentration of expenditure in foster care is the result of many factors. They include the size of the funds at hand implemented to support and assistance programs for children under foster care, and those running foster care entities play a significant role. As a consequence, although foster care entities are present in all voivodeships in the country, they do not absorb the allocated expenditure with the same intensity. In those with a high concentration of inputs (LQ > 1) its importance is greater. Such concentration in a geographically close space may also have another, much broader dimension. It is conducive to establishing cooperative relationships integrating various individuals around diverse social initiatives conducive to their mutual development and development of the region.
| Voivodeship | The level of the indicator in a year | Mean between years 2012–2018 | ||||||
|---|---|---|---|---|---|---|---|---|
| 2012 | 2013 | 2014 | 2015 | 2016 | 2017 | 2018 | ||
|
Lower Silesian |
1,15 |
1,10 |
0,95 |
1,10 |
1,03 |
1,10 |
1,07 |
1,07 |
|
Kuyavian-Pomeranian |
0,84 |
0,98 |
1,06 |
1,06 |
1,07 |
1,21 |
1,31 |
1,08 |
|
Lublin |
0,64 |
0,69 |
0,62 |
0,65 |
0,58 |
0,60 |
0,69 |
0,64 |
|
Lubusz |
0,28 |
0,35 |
0,29 |
0,52 |
0,44 |
0,55 |
0,52 |
0,42 |
|
Łódź |
0,45 |
0,66 |
0,54 |
0,64 |
0,77 |
0,79 |
0,91 |
0,68 |
|
Lesser Poland |
1,71 |
1,52 |
1,25 |
1,06 |
1,00 |
0,79 |
0,72 |
1,15 |
|
Masovian |
0,67 |
0,67 |
0,81 |
0,81 |
0,83 |
0,83 |
0,89 |
0,79 |
|
Opole |
1,09 |
1,55 |
1,76 |
1,49 |
1,41 |
1,28 |
1,16 |
1,39 |
|
Subcarpathian |
0,22 |
0,25 |
0,27 |
0,32 |
0,29 |
0,24 |
0,25 |
0,26 |
|
Podlaskie |
0,46 |
0,43 |
0,40 |
0,42 |
0,51 |
0,57 |
0,58 |
0,48 |
|
Pomeranian |
3,36 |
2,54 |
2,51 |
2,35 |
2,27 |
2,24 |
2,34 |
2,52 |
|
Silesian |
0,68 |
0,80 |
0,84 |
1,04 |
1,14 |
1,10 |
0,92 |
0,93 |
|
Holy Cross |
1,55 |
1,44 |
1,20 |
1,01 |
0,84 |
0,92 |
0,74 |
1,10 |
|
Warmian-Masurian |
1,20 |
1,13 |
0,97 |
0,96 |
0,88 |
0,78 |
0,79 |
0,96 |
|
Greater Poland |
0,46 |
0,50 |
0,98 |
0,43 |
0,39 |
0,41 |
0,44 |
0,51 |
|
West Pomeranian |
0,73 |
1,18 |
1,16 |
1,41 |
1,47 |
1,52 |
1,49 |
1,28 |
|
Max. |
3,36 |
2,54 |
2,51 |
2,35 |
2,27 |
2,24 |
2,34 |
2,52 |
|
Min. |
0,22 |
0,25 |
0,27 |
0,32 |
0,29 |
0,24 |
0,25 |
0,26 |
|
Mean |
0,97 |
0,99 |
0,98 |
0,95 |
0,93 |
0,93 |
0,93 |
0,95 |
|
St. Dev. |
0,77 |
0,58 |
0,57 |
0,51 |
0,50 |
0,48 |
0,49 |
0,53 |
|
Var. Coef. |
79% |
59% |
58% |
53% |
53% |
52% |
53% |
56% |
Source: own compilation based on data from the CeSAR MRPiPS application
The spatial concentration of expenditure on foster care is quite dynamic. The coefficient of variation of the LQ indicator in the case of foster family homes indicates its significant diversity both in a given year between voivodeships and in individual years. Changes in the LQ level are not unidirectional (year-to-year comparison), making it challenging to identify lasting phenomena. However, comparing the results of the last with those of the first year, it can be stated that both in the group of regions with an above-average concentration of expenditures and the remaining ones, an increase in their share in social protection expenditures was observed (Graph 7). As many as ten regions saw this phenomenon, although it was not as intense in all of them. In the Pomeranian Voivodeship, in which the highest level of concentration of expenditures was recorded, the quotient was as high as e.g. West Pomeranian (by over 206%) or Łódź (by about 204%) – regions with a much lower concentration. The comparison of changes in 2018 to 2012, although based on real data, reflects the state only for two years. Thus, such an analysis may not fully reflect the actual trends characterizing the dynamism of development considered in a few years’ perspectives and should be treated with some caution.

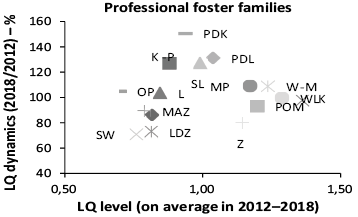
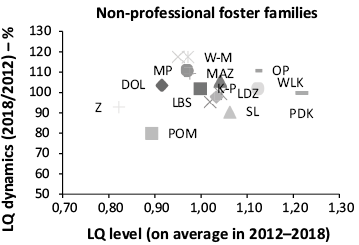
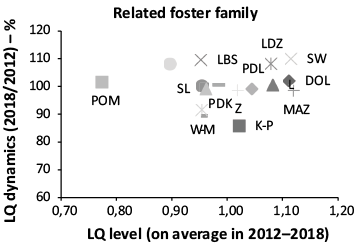
Graph 7.The level and dynamics of changes in the location index of expenditure on activities of various types of foster care in Poland in 2012–2018
Source: own compilation based on data from the CeSAR MRPiPS application
In the second part of the study, the shift-share analysis was performed. Similarly, as in the case of LQ analysis, the article presents the results based on the example of family children’s homes. The shift-share analysis results indicate an upward trend in the level of expenditure on substitute care (Table 2). Overall, these expenditures in 2018 were almost PLN 507 million higher than in 2012.
Table 2. Shift-share analysis of expenditure on family children’s home in Poland in 2012–2018
| Voivodeship | Level of components | TS | ||
|---|---|---|---|---|
| LSE | IME | NGE | ||
|
Lower Silesian |
0,05 |
2,38 |
28,72 |
31,16 |
|
Kuyavian-Pomeranian |
0,02 |
1,00 |
30,82 |
31,85 |
|
Lublin |
0,01 |
0,59 |
31,45 |
32,05 |
|
Lubusz |
0,00 |
0,23 |
32,00 |
32,24 |
|
Łódź |
0,02 |
0,72 |
31,25 |
31,99 |
|
Lesser Poland |
0,04 |
2,02 |
29,28 |
31,34 |
|
Masovian |
0,03 |
1,51 |
30,06 |
31,60 |
|
Opole |
0,01 |
0,60 |
31,44 |
32,05 |
|
Subcarpathian |
0,00 |
0,16 |
32,11 |
32,27 |
|
Podlaskie |
0,00 |
0,22 |
32,01 |
32,24 |
|
Pomeranian |
0,12 |
5,61 |
23,81 |
29,54 |
|
Silesian |
0,04 |
1,99 |
29,31 |
31,35 |
|
Holy Cross |
0,02 |
0,93 |
30,93 |
31,88 |
|
Warmian-Masurian |
0,03 |
1,57 |
29,95 |
31,56 |
|
Greater Poland |
0,02 |
0,74 |
31,22 |
31,98 |
|
West Pomeranian |
0,02 |
0,98 |
30,87 |
31,86 |
|
0,45 |
21,25 |
485,25 |
506,95 |
|
Source: own compilation based on data from the CeSAR MRPiPS application
The individual components of the analysis relate to various aspects of change. The first of them, the potential of the studied area (LSE), reflects an expected increase (or decrease) of the analyzed variable, assuming that the functioning of foster care in voivodeships is similar to the situation in the country (Grzybowska 2013). Thus, LSE indicates changes that result from the general economic situation in the country (Barrios et al. 2007). The positive value of LSEs in all voivodeships indicates that the family children’s homes located there have development potential in terms of expenditure on foster care, albeit it is small. This situation was observed in all voivodeships. The Lower Silesia voivodeship had the most significant possibilities relatively. Potentially, it was possible to increase the expenditure thereby as much as PLN 0.051 million.
The structural component (IME) of the total displacement shows the amount of changes in expenditure on the selected type of foster care in voivodeships compared to the reference area (Table 2). Due to a relatively better entity structure of family children’s homes in the regions than the whole foster care, it was possible to increase expenditures by PLN 21.25 million. The IME component’s positive values indicate a revival in the development of family children’s homes (compared to the whole foster care) and some use of opportunities to intensify that development. Thisphenomenon is visible in all voivodeships, although with varying intensity. This also occurs with the professional foster family. For other types, i.e. related foster family and non-professional foster family, the SP factor’s value is negative.
Economic conditions, especially those related to macroeconomic trends, are the same for all regions. They can have either a positive (LSE) or negative (IME) effect on the inputs’ level in regions. It can be assumed (albeit, it is a certain degree of simplification) that differences in development dynamics shaped by identical macro factors are largely the result of the impact of intra-regional resources, conditions and determinants, which at the same time testify to the specificity of the region (Grzybowska 2013). The third component of shift-share analysis – NGE – having an endogenous character (as opposed to LSE and IME) is treated as a reflection of the strength or weakness of the local economy. A positive LSE value indicates higher regional competitiveness of family children’s homes to foster care in Poland in general. Such a situation was noted in all voivodeships. A clear dominance of the NGE component over the remaining components of the total shift is also noticeable.
The analysis of the economic aspects of foster care’s functioning is becoming an increasingly frequent research subject. Analysis of the related literature confirmed this trend. However, it should be emphasized that both domestic and international studies still lack an in-depth analysis dealing with the subject of the organization and financing of foster care.
The use of the LQ method and shift-share analysis proved successful in the context of the research questions posed and the primary goal. The analysis of the literature also showed that these methods are successfully used in social analyzes.
The analysis of expenditure on foster care activities based on the location quotient refers to their spatial concentration. In dynamic terms, it also allows us to observe changes over time but does not identify the reasons that caused them. At least to some extent, this explains the analysis of share shifts, which indicates whether, and to what extent expenses for the functioning of foster care in the regions differ from each other, and whether they are different from the general phenomena noted in foster care in the country’s perspective.
Based on the research conducted between the years 2013 and 2018, a decrease in the number of children in family foster care was observed with a simultaneous increase in funds for custody in 2018. What is more, voivodeships allocate amounts exceeding the statutory minimum for benefits. West Pomeranian allocates the highest amounts to the related foster family, Łódź to a non-professional foster family, Podlaskie to professional foster family, and Lesser Poland to family children’s homes.
In their future studies, the authors plan to make an attempt to explore the reasons for the spatial diversity of family foster care and the effects of this condition for those under their care. Thus, the study presented in the article should be treated as a preliminary stage to the extended foster care policy modelling.
We acknowledge support from a subsidy granted to University of Lodz.
AAP. (2005), Task Force on Health Care for Children in Foster Care. Fostering health: Health care for children and adolescents in foster care, American Academy of Pediatrics.
Balcerzak-Paradowska B. (2004), Rodzina i polityka rodzinna na przełomie wieków: przemiany, zagrożenia potrzeba działań, Instytut Pracy i Spraw Socjalnych.
Barrios S., Mas M., Navajas E., Quesada J. (2007), Mapping the ICT in EU Regions: Location, Employment, Factors of Attractiveness and Economic Impact, Office for Official Publications of the European Communities.
Barth R., Wildfire J., Green R. (2006), Placement into foster care and the interplay of urbanicity, child behavior problems, and poverty, “American Journal of Orthopsychiatry”, 76(3): 358–366.
Berger L., Waldfogel J. (2004), Out-of-Home Placement of Children and Economic Factors: An Empirical Analysis, “Review of Economics of the Household”, 2(5): 387–411.
Berger LM., Paxson C., Waldfogel J. (2009), Mothers, men, and child protective services involvement, “Child Maltreat”, 14(3): 263–276.
Cunningham S., Finlay K. (2013), Evidence From Two Methamphetamine Supply Shocks, “Economic Inquiry”, 57(1): 764–782.
Drake B., Lee S., Jonson-Reid M. (2009), Race and child maltreatment reporting: Are Blacks overrepresented? “Children and Youth Services Review” 31(3): 309–316.
Dunn E. (1960), A Statistical and Analytical Technique for Regional Analysis, “Papers and Proceedings of the Regional Science Association”, 6: 98–112.
Ferrara P., Corsello G., Sbordone A., Nigri L., Ehrich J., Pettoello-Mantovani M. (2016), Foster Care: A Fragile Reality Needing Social Attention, and Economic Investments, “The Journal of Pediatrics”, 173: 270–271.e1.
GB. (2001), Business Clusters in the UK – a First Assessment. DTI, Department of Trade and Industry.
Gerber-Grote A., Lenton S., Amelung V., Pettoello-Mantovani M., Ehrich J. (2015), Starting the debate on the role of health economics to support child friendly health care in Europe, “The Journal of Pediatrics”, 167: 944–945.e2.
Gruca-Miąsik U. (2003), Foster family care from the Polish and American paerpectives, “Socjologii, Roczniki XV, Rodziny”, 2000.
Grzybowska B. (2013), Spatial Concentration Of Innovative Potential In Food Industry, “Yearbook Of Agriculture Economy And Rural Development”, 100(2): 53–64.
Jewczak M., Żółtaszek A. (2011), Spatial Shift-Share Analysis As A Health Policy Tool, “Acta Universitatis Lodziensis. Folia Oeconomica”, 252: 87–100.
Knuiman S., Rijk C., Hoksbergen R., van Baar A.L. (2015), Children without parental care in Poland: Foster care, institutionalization and adoption, “International Social Work”, 58(1): 142–152.
Kurzynowski A. (2006), Polityka społeczna – podstawowe pojęcia i zakres. In Polityka Społeczna, Warszawa.
Kwapiszewska M., Kwapiszewski J. (2012), Polityka społeczna, praca socjalna i wolontariat, Państwowa Wyższa Szkoła Zawodowa im. Stanisława Staszica, Piła.
Leigh N. (2013), Planning Local Economic Development. Sage Publications.
McGuinness TM. Schneider K. (2007), Child Maltreatment, and Foster Care, “Journal of the American Psychiatric Nurses Association”, 13(5): 296–303.
Ortiz I., Chai J., Cummins M. (2011), Identifying fiscal space options for social and economic development for children and poor households in 184 countries (UNICEF Social and Economic Policy Working Paper).
Pac J., Waldfogel J., Wildman C. (2017), Poverty among Foster Children: Estimates Using the Supplemental Poverty Measure, “Social Service Review”, 91(1): 8–40.
Paxson C., Waldfogel J. (2003), Welfare Reforms, “Family Resources, and Child Maltreatment”, 22(1): 85–113.
Regulska A. (2015), Educational Care Centres in the system. 2(2).
Ringeisen H., Casanueva C., Urato M., Cross T. (2008), Special health care needs among children in the child welfare system, “Pediatrics”, 122: e232–e241.
Shi C.-Y., Yang Y. (2008), A review of shift-share analysis and its application in tourism, “International Journal of Management Perspectives”, 1(1): 21–30.
Sierpowska I. (2011), Prawo pomocy społecznej, Wolters Kluwer, Warszawa.
Stecko S. (2017), Polityka społeczna państwa względem rodziny, “Społeczeństwo i Rodzina”, 50(1): 139–151.
Topolewska M. (2021), Będą wyższe świadczenia dla rodzin zastępczych, serwisy.gazetaprawna.pl, https://serwisy.gazetaprawna.pl/emerytury-i-renty/artykuly/8126471,wyzsze-swiadczenia-dla-rodzin-zastepczych.html (accessed: 15.11.2021).
Wojciuk M., Zegarowicz Ł. (2019). Fiscal instruments supporting families in poland in the years 2004–2017. “Financial Internet Quarterly’e-Finanse”, 15(2): 63–72.
Zamorska K. (2010), Prawa społeczne jako program przebudowy polityki społecznej. Uniwersytet Wrocławski.
W artykule przedstawiono wydatki samorządów na rodzinną pieczę zastępczą w aspekcie ich koncentracji przestrzennej. Głównym celem badania jest uchwycenie regionalnych różnic w finansowaniu rodzinnej pieczy zastępczej w Polsce. W badaniu zastosowano współczynnik lokalizacji LQ oraz analizę shift-share. W wyniku badania stwierdzono przestrzenne zróżnicowanie funkcjonowania pomocy społecznej w zakresie rodzinnej pieczy zastępczej w Polsce.
Słowa kluczowe: samorząd terytorialny, piecza zastępcza, wydatki publiczne, opieka nad dzieckiem
