Body height and mass of children and adolescents in Poland: age-specific centile distributions from the 2024–2025 nationwide survey
 https://orcid.org/0000-0003-3786-4833
Institute of Sport – National Research Institute, Warsaw, Poland
https://orcid.org/0000-0002-2425-4932
Institute of Sport – National Research Institute, Warsaw, Poland
Józef Piłsudski University of Physical Education in Warsaw, Poland
https://orcid.org/0000-0002-9823-7991
Institute of Sport – National Research Institute, Warsaw, Poland
Abstract
Introduction
Data on the growth and development of the young generation constitute a reliable indicator of the health and nutritional status of societies. They can be used as a tool for monitoring the social and economic situation of the population as a whole and for identifying groups at risk within it.
Study aim
The aim of this paper was to present the empirical material underlying the centile estimation of body height and body mass in Polish children and adolescents, to describe the centile modelling procedure, and to report the resulting age-specific distributions of the analysed somatic traits.
Materials and methods
Our study has a cross-sectional design and is distinguished by both its large sample size and nationwide coverage. A total of 23,988 students were measured (11,880 boys and 12,108 girls) in 405 schools across all regions of Poland between May 2024 and June 2025. Body height and body mass were measured and analysed statistically.
Results
The results for body height and body mass are presented as centile charts shown against raw-data scatterplots and supplemented with tables of centile values.
Conclusions
The results presented here may provide a basis for the development of up-to-date reference systems for basic somatic traits in school-aged children and adolescents aged 6–18 years.
Keywords: growth, centiles, research methodology
Introduction
Data on the growth and development of younger generations constitute a reliable indicator of the health and nutritional status of societies. They can be used to monitor the overall social and economic situation of the populations and to identify at-risk groups for potential interventions (WHO, 1995). Measurements of body height and body mass are among the fundamental tools used to assess physical development and nutritional status at the population level. Studies of children and adolescents aged 5–19 years from more than 190 countries showed that between 2000 and 2025, the prevalence of obesity increased from 3% to 9.4% and exceeded underweight prevalence globally except in Sub-Saharan Africa and South Asia (UNICEF, 2025). Findings from nationwide studies in Poland (Jarosz et al., 2016; Mazur, 2024) confirm these global trends. Recent international evidence also indicates unfavourable trends in excessive body mass among children and adolescents worldwide, including in Europe (NCD-RisC, 2024).
Growth and maturation parameters are widely used as indicators of intergenerational changes and of the biological effects of living conditions at the population level. Previous studies have documented long-term changes in body height, body mass, and maturation timing in children and adolescents in Poland (Gomula et al., 2021; Kułaga et al., 2011), as well as in many other European countries (Eiholzer et al., 2025; Júlíusson et al., 2013; Pop et al., 2021; Roelants et al., 2009; Saari et al., 2011) and globally, particularly in industrialized regions (Cole & Mori, 2018; NCD-RisC, 2020). More recent reports, however, suggest that the pace of these changes may differ from that observed in earlier decades (Kryst et al., 2022; Pastor-Fajardo et al., 2020; NCD-RisC, 2020). These observations support the need for updated empirical data describing the current somatic characteristics of younger populations.
The health status and physical development of children and adolescents are shaped by multiple biological, environmental, and social factors, which should be considered when interpreting population-level somatic data (Bielicki, 1986; Charzewski et al., 2003; Kozieł, Nowak-Szczepańska, & Gomuła, 2014). For this reason, nationwide empirical material collected according to a standardized protocol is of particular importance for developing up-to-date centile-based descriptions of basic somatic traits.
In many countries, measurements of basic somatic traits serve as growth references used to support the assessment of growth and developmental status in children and adolescents. These cross-sectional studies are typically updated every 10–15 years, as illustrated by research conducted in Finland (Saari et al., 2011), Norway (Júlíusson et al., 2013), Switzerland (Eiholzer et al., 2025), Romania (Pascanu et al., 2016; Pop et al., 2021), China (Li et al., 2009), and Poland (Kułaga et al., 2011; Palczewska & Niedźwiedzka, 2001). In more than 140 countries lacking up-to-date data for assessing growth in school-aged children and adolescents, WHO growth references are used (de Onis et al., 2007). In Europe, WHO growth references have been adopted in several countries, including Portugal, Albania, and Moldova. In Poland, the most recent nationwide reference studies based on a random sample of children and adolescents were conducted between 2007 and 2012 within the OLAF and OLA projects, and their findings were published as the Polish 2010 and 2012 reference systems for school-aged and preschool children, respectively (Kułaga et al., 2011; 2013; 2015).
The data analysed in the present paper were collected as part of the project “Centile Charts for Body Height, Body Weight, and Body Mass Index in Children and Adolescents in Poland”, funded by the Ministry of Science and Higher Education under the Science for Society II programme. The project was designed to obtain a nationwide empirical dataset for the development of up-to-date centile distributions of basic somatic traits in school-aged children and adolescents. Field examinations were conducted in 2024–2025 in schools across all regions of Poland, using a standardized student selection procedure based on the assumptions previously applied in the OLAF project, along with a standardized anthropometric measurement protocol.
Against the background of the broader objectives of the project, the present paper focuses on a specific scope of data analysis and result presentation. The aim of this paper is to present the empirical material underlying the centile estimation of body height and body mass in Polish children and adolescents, including the relationship between the age and territorial structure of the study sample and that of the nationwide population, as well as to describe the method used to develop centile distributions and to present the results of centile modelling for the analysed somatic traits.
The results presented in this paper provide an empirical basis for further work on updated reference systems for basic somatic traits in Polish school-aged children and adolescents. Additional analyses based on the same dataset will be presented separately.
Materials and methods
The research project was reviewed by the Research Ethics Committee operating at the Institute of Sport – National Research Institute (approval No. KEBN-24-100-AP). Field examinations were conducted in 405 schools across all regions of Poland between May 2024 and June 2025. The school selection procedure was based on the sampling framework previously applied in the OLAF project (Kułaga et al., 2011), which was designed to approximate the population structure of children and adolescents in Poland. The original OLAF school list served as the starting point for sample construction in the present study, and approximately 76% of the schools included in the current survey had also participated in the OLAF project. Some schools from the original list could not be retained, mainly because of changes in the educational system following the abolition of lower secondary schools. To preserve, as far as possible, the assumptions of the original sampling framework and territorial and environmental comparability, these schools were replaced by the nearest schools enrolling students in the relevant age range.
Student selection followed a multistage systematic sampling procedure. At the school level, one class group from each educational level was selected. Within the selected class group, every third student was chosen from the class register, separately for girls and boys. After the candidates had been identified, written informed consent was obtained from the parents or legal guardians of minors and from students who were of legal age. In the absence of consent, the next student on the list was invited to participate, and the procedure was continued until the target number of participants had been reached or the list had been exhausted. At each educational level within a participating school, the plan was to include, within the selected class group, at least 3 students of each sex in primary schools and at least 6 students of each sex in post-primary schools, as well as 2 reserve students in each case.
The study had a cross-sectional design and was conducted in school settings according to a standardized measurement protocol. Measurements were performed by a team of 20 experienced anthropologists, each responsible for examinations in a designated region of the country. Before the start of data collection, all examiners underwent training in measurement techniques and error identification procedures.
The exact age of each participant on the day of examination was calculated as the difference between the examination date and the date of birth, expressed in days. For descriptive purposes, age was converted into decimal years (dividing the number of days by 365.25), whereas the continuous age variable used in modelling was expressed in months (age in years × 12).
Anthropometric techniques
Anthropometric measurements were performed during morning hours on a single day in each school among students selected for the study who were present on the examination day. This approach helped reduce within-day variation in the recorded values. Body height was measured in duplicate with a GPM anthropometer. Measurement error was calculated separately for each examiner. The Type A evaluation of standard uncertainty yielded values ranging from 0.01 to 0.03 cm, indicating very high repeatability of body height measurements. Participants were measured barefoot, with heels together, standing upright, shoulders and hips aligned, arms hanging freely, and the head positioned in the Frankfurt plane. Height was recorded to the nearest 0.1 cm. Body mass was measured in light underwear to the nearest 0.05 kg using a certified electronic medical scale (Charder MS6110).
Exclusion criteria
The exclusion criteria were consistent with those applied in the previous project (Kułaga et al., 2011) and included major postural abnormalities, genetic syndromes (e.g., Down syndrome, Turner syndrome), cancer, and other chronic diseases affecting growth. Additional exclusion criteria included previous growth hormone treatment or a diagnosis of growth hormone deficiency; systemic steroid therapy for conditions such as asthma or arthritis, or following renal transplantation; diabetes, cerebral palsy, cystic fibrosis, renal disease, congenital adrenal hyperplasia, congenital heart defects associated with impaired physical fitness; and thyroid hormone supplementation. Children wearing a plaster cast that could not be removed for measurement were also excluded, as its presence could affect measurement accuracy.
Statistical analysis
Body height and body mass were analysed using generalized additive models for location, scale, and shape (GAMLSS). This framework generalizes the LMS method (Cole, 1988; Cole & Green, 1992) by allowing the modelling of not only location and scale parameters but also distributional skewness (ν) and kurtosis/heavy tails (τ), which typically improves the fit to anthropometric data, particularly during puberty (Rigby & Stasinopoulos, 2005). GAMLSS-based approaches are widely used in the development of growth references and normative centile charts (e.g., Ortega et al., 2023; Tomkinson et al., 2018; WHO, 2006).
Data preparation and modelling assumptions
Data were initially recorded on paper forms and subsequently entered into a computer database (Excel). Standard quality control procedures were applied to identify and correct missing values, implausible records, duplicates, and outliers. The sample size (approximately 12,000 observations per sex, ages 6–19 years) was within the range discussed as adequate for constructing reference centiles across childhood and adolescence (Cole, 2021). Considering age expressed on a continuous scale in years, the density of observations across age supported the chosen degree of smoothing and the use of model diagnostics based on Q-tests and worm plots (Pan & Cole, 2004; Rigby & Stasinopoulos, 2005; Stasinopoulos et al., 2017).
Selection of the distribution family
To select the most appropriate distribution family, we applied a multi-stage comparative procedure based on the information criteria AIC (Akaike, 1998), BIC (Schwarz, 1978), GAIC6 and GAIC15 (Rigby & Stasinopoulos, 2005). Four distribution families commonly used in anthropometric modelling were considered: NO, BCCG, BCPE and BCT. For each outcome, five independent random subsamples comprising 33% of the dataset were drawn (subset validation). Within each subsample, we computed information-criterion deltas (ΔAIC, ΔBIC, ΔGAIC6, ΔGAIC15) as differences relative to the best model in that draw (i.e., the lowest value of a given metric) (Burnham & Anderson, 2002). The deltas were then min–max normalized within each metric and draw:
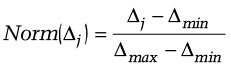
where j denotes the evaluated distribution family (NO, BCCG, BCPE, BCT).
Based on these values, a Weighted Information-Criteria Index (WICI) was computed for the BCCG, BCPE and BCT families:
WICIj = 0,35 × Norm(∆AIC)j + 0,35 × Norm(∆BIC)j + 0,15 × Norm(∆GAIC6)j + 0,15 × Norm(∆GAIC15)j
where j denotes the evaluated family (BCCG, BCPE, BCT). WICI was restricted to BCCG/BCPE/BCT to prevent extremely large deltas for NO from dominating the min–max scaling and reducing the resolution of comparisons among shape-parameter families.
The NO family was treated as a baseline model and was allowed to be selected in each draw if it minimized the total sum of deltas ΔAIC+ΔBIC+ΔGAIC6+ΔGAIC15. In each of the five subsamples, the best family was defined as the one with the lowest WICI (or NO in the case of the baseline rule).
The final choice of distribution family followed a majority rule: we selected the family identified as best in at least three out of five draws. This threshold corresponds to the classical majority rule used in resampling procedures and reduces the impact of individual outlying draws (Efron & Tibshirani, 1993). If no family met this criterion, a fallback procedure was applied by selecting the family with the lowest mean WICI across draws. This approach was intended to ensure stability and reproducibility of the selected distribution family across the entire age range.
All analyses were performed using R (version 4.4.1; R Core Team) with the packages gamlss, gamlss.dist, and gamlss.add. The analytical workflow was implemented in custom modular R code, and reproducibility was ensured through the use of configuration files and a fixed random seed.
Full GAMLSS model estimation
Final models were fitted using GAMLSS, with the distribution family selected as described above. Age (in months) was modelled as a continuous covariate using penalized B-splines (pb) for the location parameter (μ) and, where applicable, for the scale and shape parameters (σ, ν, τ), yielding smooth age-specific trajectories in line with recommendations for modelling anthropometric traits (Cole & Green, 1992; Rigby & Stasinopoulos, 2005).
Model validation and diagnostics
Model fit was evaluated using diagnostic tools commonly recommended for GAMLSS (Rigby et al., 2019; van Buuren & Fredriks, 2001). Local diagnostics included Q-statistics and worm plots. Global diagnostics comprised residual Q–Q plots, residuals versus fitted values, residuals versus age, and residual histograms. We assessed variance stability, potential residual trends, and overall agreement between the residual distribution and the assumed theoretical model, both for the full sample and across age intervals.
Construction of centile charts
Based on the final model, the parameters μ, σ, ν and τ were predicted on an age grid with a step of 0.5 months. Selected centiles (3rd, 5th, 10th, 15th, 25th, 50th, 75th, 85th, 90th, 95th, and 97th) were then computed as:
Cp = qDist (p; μ, σ, ν, τ)
where qDist denotes the quantile function of the selected distribution family (e.g. qBCCG, qBCPE, qBCT). Results were stored in tabular form with columns corresponding to age, C3, C5, C10, C15, C25, C50, C75, C85, C90, C95, and C97, which served as the basis for plotting the centile curves.
Results
A total of 23,988 students were measured (11,880 boys and 12,108 girls). There were 145 children under 6 years of age (65 boys and 80 girls) and 110 participants older than 18 years (63 boys and 47 girls, respectively). The numbers of participants by age category are presented in Table 1.
Overall project coverage of the population of children and adolescents in Poland (Project/Poland; as of 31 December 2024, Statistics Poland (GUS)) within the school-age range (6–18 years) was approximately 0.45%. Excluding the boundary age groups (6 and 18 years), coverage was relatively stable and ranged from approximately 0.41% to 0.57% depending on age and sex (Table 2).
| Poland | Project | Project coverage (% of population) | |||||||
|---|---|---|---|---|---|---|---|---|---|
| Years | Total | ♂ | ♀ | Total | ♂ | ♀ | % | ♂ | ♀ |
| 5 | 376235 | 193241 | 182994 | 113 | 52 | 61 | 0.03 | 0.03 | 0.03 |
| 6 | 394546 | 203065 | 191481 | 963 | 477 | 486 | 0.24 | 0.23 | 0.25 |
| 7 | 413447 | 212224 | 201223 | 1725 | 862 | 863 | 0.42 | 0.41 | 0.43 |
| 8 | 397373 | 204014 | 193359 | 1959 | 965 | 994 | 0.49 | 0.47 | 0.51 |
| 9 | 388864 | 199717 | 189147 | 1925 | 958 | 967 | 0.50 | 0.48 | 0.51 |
| 10 | 391768 | 201074 | 190694 | 2043 | 984 | 1059 | 0.52 | 0.49 | 0.56 |
| 11 | 384808 | 197494 | 187314 | 1923 | 976 | 947 | 0.50 | 0.49 | 0.51 |
| 12 | 404112 | 207785 | 196327 | 1948 | 938 | 1010 | 0.48 | 0.45 | 0.51 |
| 13 | 403700 | 207601 | 196099 | 1936 | 962 | 974 | 0.48 | 0.46 | 0.50 |
| 14 | 427402 | 219643 | 207759 | 2333 | 1156 | 1177 | 0.55 | 0.53 | 0.57 |
| 15 | 431473 | 220925 | 210548 | 2240 | 1131 | 1109 | 0.52 | 0.51 | 0.53 |
| 16 | 425435 | 217734 | 207701 | 1844 | 916 | 928 | 0.43 | 0.42 | 0.45 |
| 17 | 396544 | 203123 | 193421 | 1789 | 855 | 934 | 0.45 | 0.42 | 0.48 |
| 18 | 375848 | 192539 | 183309 | 1096 | 569 | 527 | 0.29 | 0.30 | 0.29 |
| 19 | 360994 | 184567 | 176427 | 147 | 76 | 71 | 0.04 | 0.04 | 0.04 |
| 20 | 348832 | 178704 | 170128 | 2 | 1 | 1 | 0.00 | 0.00 | 0.00 |
| 21 | 342203 | 174751 | 167452 | 2 | 2 | 0 | 0.00 | 0.00 | 0.00 |
| Total | 6663584 | 3418201 | 3245383 | 23988 | 11880 | 12108 | 0.36 | 0.35 | 0.37 |
Categories ≥20 years were rare (n=2 each) and are shown for completeness. Totals are shown in bold.
| N (exam age) | N (ref. age, 31 Dec 2024) | ΔN [1] – [2] | Δ% (vs ref.) | |||||||||
|---|---|---|---|---|---|---|---|---|---|---|---|---|
| [1] | [2] | [3] | [4] | |||||||||
| Age | ♂ | ♀ | Total | ♂ | ♀ | Total | ♂ | ♀ | Total | ♂ | ♀ | Total |
| 4 | 0 | 1 | 1 | 0 | 0 | 0 | 0 | 1 | 1 | — | — | — |
| 5 | 65 | 79 | 144 | 52 | 61 | 113 | 13 | 18 | 31 | 25.0 | 29.5 | 27.4 |
| 6 | 521 | 527 | 1048 | 477 | 486 | 963 | 44 | 41 | 85 | 9.2 | 8.4 | 8.8 |
| 7 | 861 | 844 | 1705 | 862 | 863 | 1725 | -1 | -19 | -20 | -0.1 | -2.2 | -1.2 |
| 8 | 928 | 1013 | 1941 | 965 | 994 | 1959 | -37 | 19 | -18 | -3.8 | 1.9 | -0.9 |
| 9 | 966 | 941 | 1907 | 958 | 967 | 1925 | 8 | -26 | -18 | 0.8 | -2.7 | -0.9 |
| 10 | 999 | 1040 | 2039 | 984 | 1059 | 2043 | 15 | -19 | -4 | 1.5 | -1.8 | -0.2 |
| 11 | 941 | 998 | 1939 | 976 | 947 | 1923 | -35 | 51 | 16 | -3.6 | 5.4 | 0.8 |
| 12 | 932 | 960 | 1892 | 938 | 1010 | 1948 | -6 | -50 | -56 | -0.6 | -5.0 | -2.9 |
| 13 | 998 | 1014 | 2012 | 962 | 974 | 1936 | 36 | 40 | 76 | 3.7 | 4.1 | 3.9 |
| 14 | 1062 | 1093 | 2155 | 1156 | 1177 | 2333 | -94 | -84 | -178 | -8.1 | -7.1 | -7.6 |
| 15 | 1118 | 1096 | 2214 | 1131 | 1109 | 2240 | -13 | -13 | -26 | -1.1 | -1.2 | -1.2 |
| 16 | 986 | 954 | 1940 | 916 | 928 | 1844 | 70 | 26 | 96 | 7.6 | 2.8 | 5.2 |
| 17 | 851 | 875 | 1726 | 855 | 934 | 1789 | -4 | -59 | -63 | -0.5 | -6.3 | -3.5 |
| 18 | 589 | 626 | 1215 | 569 | 527 | 1096 | 20 | 99 | 119 | 3.5 | 18.8 | 10.9 |
| 19 | 60 | 47 | 107 | 76 | 71 | 147 | -16 | -24 | -40 | -21.1 | -33.8 | -27.2 |
| 20 | 2 | 0 | 2 | 1 | 1 | 2 | 1 | -1 | 0 | — | — | — |
| 21 | 1 | 0 | 1 | 2 | 0 | 2 | -1 | 0 | -1 | — | — | — |
| All | 11880 | 12108 | 23988 | 11880 | 12108 | 23988 | 0 | 0 | 0 | 0.0 | 0.0 | 0.0 |
[1] Age at examination was calculated from the date of birth and the measurement date as the number of completed years on the examination day.
[2] Reference age as of 31 December 2024 was defined as the number of completed years on 31 December 2024 (Główny Urząd Statystyczny, n.d.). Two boys declined to provide their date of birth and were therefore excluded from this comparison.
[4] Because percentage indices are unstable for small cell counts, Δ% was not reported for categories where N (age as of 31 Dec 2024) < 30 (marked as “—”).
For comparisons of the age structure of the study sample with population data from Statistics Poland (GUS), reference age was defined as the number of completed years as of 31 December 2024. In contrast, statistical analyses were based on age at examination (calculated from the date of birth and the measurement date) as a continuous variable. To assess differences arising from these two age definitions, we compared the numbers of participants by age category obtained using both methods (Table 2) and calculated the agreement between age categories, and the extent of ±1-year shifts (Table 3). The percentages for δ=−1 and δ=+1 describe the net balance of shifts in age-group aggregation resulting from the use of different reference points. As a summary measure, we used the difference between the proportion shifted to an older category and that shifted to a younger category, which was 1.22 percentage points in boys (17.02% − 15.80%) and 1.95 percentage points in girls (17.86% − 15.92%).
To verify the comparability of the study sample with voivodeship-level school-age populations (Table 4), we used the reference age as of 31 December 2024 and restricted analyses to ages 6–19 years, consistent with the population data range and the school-age period. Analyses of test outcomes were based on age at examination.
| Boys | Girls | |||||||||||
|---|---|---|---|---|---|---|---|---|---|---|---|---|
| δ (age-category difference) | % of participants | δ (age-category difference) | % of participants | |||||||||
| Age category (exam age) | δ =-1 | δ =0 | δ =+1 | -1 | 0 | +1 | δ =-1 | δ =0 | δ =+1 | δ =-1 | δ =0 | δ =+1 |
| 4 | 0 | 0 | 0 | 0.00 | 0.00 | 0.00 | 1 | 0 | 0 | 0.01 | 0.00 | 0.00 |
| 5 | 29 | 36 | 0 | 0.24 | 0.30 | 0.00 | 34 | 45 | 0 | 0.28 | 0.37 | 0.00 |
| 6 | 154 | 351 | 16 | 1.30 | 2.95 | 0.13 | 157 | 355 | 15 | 1.30 | 2.93 | 0.12 |
| 7 | 195 | 569 | 97 | 1.64 | 4.79 | 0.82 | 185 | 562 | 97 | 1.53 | 4.64 | 0.80 |
| 8 | 158 | 631 | 139 | 1.33 | 5.31 | 1.17 | 206 | 663 | 144 | 1.70 | 5.48 | 1.19 |
| 9 | 182 | 645 | 139 | 1.53 | 5.43 | 1.17 | 197 | 598 | 146 | 1.63 | 4.94 | 1.21 |
| 10 | 182 | 662 | 155 | 1.53 | 5.57 | 1.30 | 179 | 698 | 163 | 1.48 | 5.76 | 1.35 |
| 11 | 165 | 636 | 140 | 1.39 | 5.35 | 1.18 | 218 | 616 | 164 | 1.80 | 5.09 | 1.35 |
| 12 | 164 | 610 | 158 | 1.38 | 5.13 | 1.33 | 173 | 635 | 152 | 1.43 | 5.24 | 1.26 |
| 13 | 185 | 650 | 163 | 1.56 | 5.47 | 1.37 | 198 | 659 | 157 | 1.64 | 5.44 | 1.30 |
| 14 | 170 | 744 | 148 | 1.43 | 6.26 | 1.25 | 183 | 768 | 142 | 1.51 | 6.34 | 1.17 |
| 15 | 123 | 768 | 227 | 1.04 | 6.46 | 1.91 | 132 | 753 | 211 | 1.09 | 6.22 | 1.74 |
| 16 | 143 | 650 | 193 | 1.20 | 5.47 | 1.62 | 140 | 641 | 173 | 1.16 | 5.29 | 1.43 |
| 17 | 143 | 565 | 143 | 1.20 | 4.76 | 1.20 | 130 | 590 | 155 | 1.07 | 4.87 | 1.28 |
| 18 | 28 | 414 | 147 | 0.24 | 3.48 | 1.24 | 29 | 393 | 204 | 0.24 | 3.25 | 1.68 |
| 19 | 0 | 48 | 12 | 0.00 | 0.40 | 0.10 | 1 | 42 | 4 | 0.01 | 0.35 | 0.03 |
| 20 | 1 | 1 | 0 | 0.01 | 0.01 | 0.00 | 0 | 0 | 0 | 0.00 | 0.00 | 0.00 |
| 21 | 0 | 1 | 0 | 0.00 | 0.01 | 0.00 | 0 | 0 | 0 | 0.00 | 0.00 | 0.00 |
| Total | 2022 | 7981 | 1877 | 17.02 | 67.18 | 15.80 | 2163 | 8018 | 1927 | 17.86 | 66.22 | 15.92 |
| 11 880 | 100 | 12 108 | 100 | |||||||||
δ=age category (completed years) at examination − age category (completed years) as of 31 Dec 2024; −1: one age category younger, 0: same age category, +1: one age category older. Totals are shown in bold.
| Poland | Project | Project coverage (% of population) | |||||||
|---|---|---|---|---|---|---|---|---|---|
| Voivodeship | Total | ♂ | ♀ | Total | ♂ | ♀ | Total | ♂ | ♀ |
| Dolnośląskie | 402765 | 206164 | 196601 | 1472 | 742 | 730 | 0.37 | 0.36 | 0.37 |
| Kujawsko-Pomorskie | 297906 | 152888 | 145018 | 1067 | 534 | 533 | 0.36 | 0.35 | 0.37 |
| Lubelskie | 295784 | 151172 | 144612 | 1673 | 725 | 948 | 0.57 | 0.48 | 0.66 |
| Lubuskie | 146504 | 75246 | 71258 | 543 | 267 | 276 | 0.37 | 0.35 | 0.39 |
| Łódzkie | 331262 | 170315 | 160947 | 1325 | 653 | 672 | 0.40 | 0.38 | 0.42 |
| Małopolskie | 526505 | 270341 | 256164 | 2816 | 1375 | 1441 | 0.53 | 0.51 | 0.56 |
| Mazowieckie | 852430 | 437601 | 414829 | 2216 | 1159 | 1057 | 0.26 | 0.26 | 0.25 |
| Opolskie | 126401 | 64912 | 61489 | 875 | 428 | 447 | 0.69 | 0.66 | 0.73 |
| Podkarpackie | 314395 | 161192 | 153203 | 1576 | 800 | 776 | 0.50 | 0.50 | 0.51 |
| Podlaskie | 167112 | 85729 | 81383 | 871 | 459 | 412 | 0.52 | 0.54 | 0.51 |
| Pomorskie | 373492 | 191919 | 181573 | 1879 | 915 | 964 | 0.50 | 0.48 | 0.53 |
| Śląskie | 614851 | 314944 | 299907 | 1643 | 804 | 839 | 0.27 | 0.26 | 0.28 |
| Świętokrzyskie | 162091 | 83259 | 78832 | 1490 | 746 | 744 | 0.92 | 0.90 | 0.94 |
| Warmińsko-Mazurskie | 205130 | 105431 | 99699 | 1073 | 533 | 540 | 0.52 | 0.51 | 0.54 |
| Wielkopolskie | 547987 | 281989 | 265998 | 2248 | 1122 | 1126 | 0.41 | 0.40 | 0.42 |
| Zachodnio-Pomorskie | 231699 | 118403 | 113296 | 1104 | 563 | 541 | 0.48 | 0.48 | 0.48 |
| Total | 5596314 | 2871505 | 2724809 | 23871 | 11825 | 12046 | 0.43 | 0.41 | 0.44 |
Totals are shown in bold.
Overall, project coverage of the population of children and adolescents across voivodeships (Project/Poland) was 0.43% and was consistent across most regions (approximately 0.35–0.57%; Table 4). Higher coverage was observed in Świętokrzyskie (0.92%) and Opolskie (0.69%), whereas the lowest coverage was found in Mazowieckie (0.26%) and Śląskie (0.27%). Differences in coverage between voivodeships will be accounted for through the application of weighting factors to reduce the potential impact of unequal regional coverage on the development of reference data.
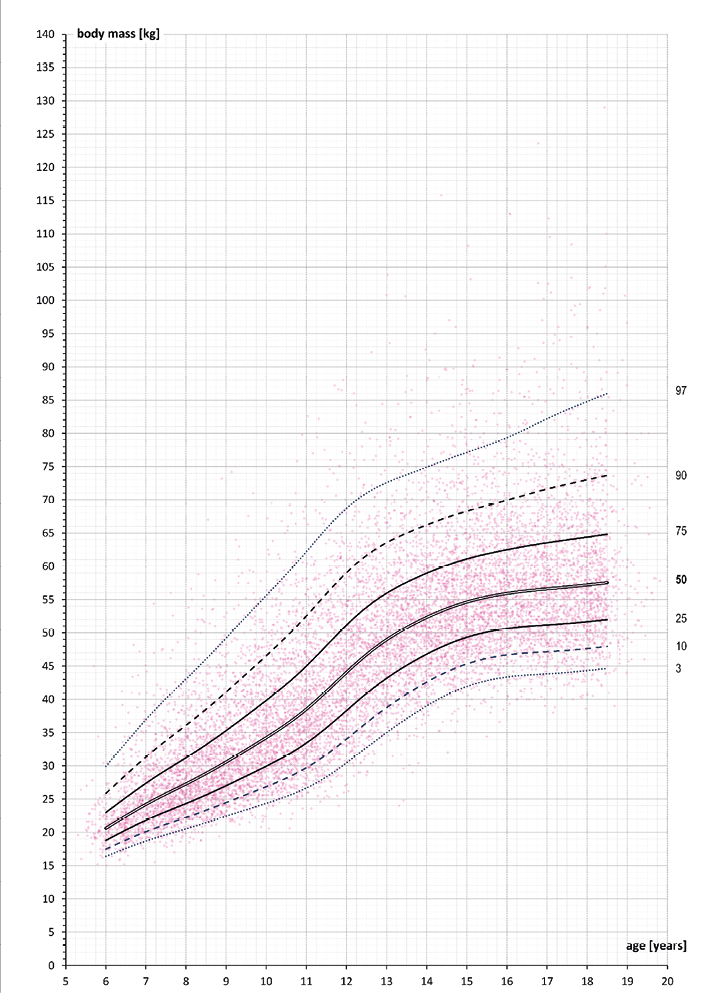
The results for body height and body mass measurements were presented as centile charts shown against raw-data scatterplots and supplemented with tables of centile values, as this form of presentation was considered more appropriate for GAMLSS modelling and better reflected the empirical distribution of the analysed somatic traits than descriptions based solely on classical descriptive statistics. Figures 1,2 and Table 5,6 present individual measurements of body height, whereas Figures 3,4 and Table 7,8 show body mass measurements for boys and girls examined in the project. The points represent raw observations, whereas the lines depict selected centile curves (P3–P97) estimated using GAMLSS models over the age range 6–18.5 years, providing a descriptive summary of the study population. Corresponding model parameter estimates and selected centile values are provided in the accompanying tables.
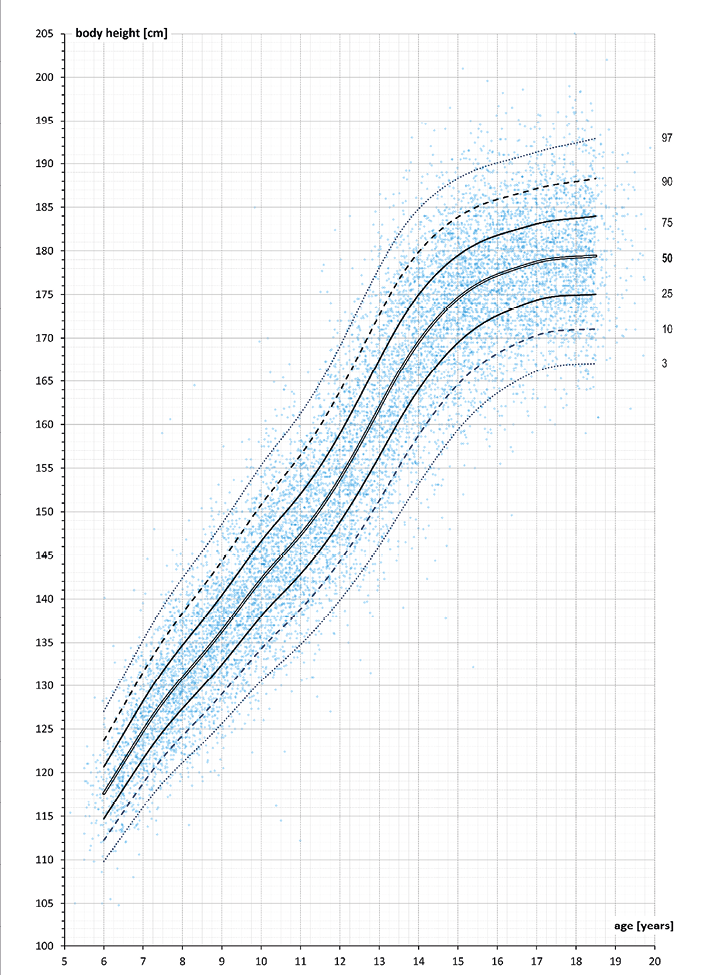
| BCT distribution | Centile values for selected age [cm] | ||||||||||
|---|---|---|---|---|---|---|---|---|---|---|---|
| Age (years) | mu | sigma | nu | tau | 3 | 10 | 25 | 50 | 75 | 90 | 97 |
| 6.0 | 117.59 | 0.037 | -1.69 | 25.21 | 109.8 | 112.2 | 114.7 | 117.6 | 120.7 | 123.7 | 127.0 |
| 6.5 | 121.20 | 0.038 | -1.51 | 25.21 | 113.0 | 115.5 | 118.2 | 121.2 | 124.4 | 127.6 | 131.2 |
| 7.0 | 124.81 | 0.039 | -1.35 | 25.21 | 116.0 | 118.8 | 121.6 | 124.8 | 128.2 | 131.6 | 135.3 |
| 7.5 | 128.09 | 0.040 | -1.18 | 25.21 | 118.8 | 121.7 | 124.7 | 128.1 | 131.7 | 135.2 | 139.1 |
| 8.0 | 130.93 | 0.041 | -0.98 | 25.21 | 121.2 | 124.2 | 127.4 | 130.9 | 134.7 | 138.4 | 142.4 |
| 8.5 | 133.58 | 0.042 | -0.75 | 25.21 | 123.3 | 126.6 | 129.9 | 133.6 | 137.5 | 141.3 | 145.4 |
| 9.0 | 136.36 | 0.043 | -0.56 | 25.21 | 125.6 | 129.0 | 132.5 | 136.4 | 140.4 | 144.4 | 148.6 |
| 9.5 | 139.32 | 0.043 | -0.40 | 25.21 | 128.1 | 131.7 | 135.3 | 139.3 | 143.5 | 147.6 | 152.0 |
| 10.0 | 142.25 | 0.044 | -0.27 | 25.21 | 130.5 | 134.3 | 138.0 | 142.2 | 146.6 | 150.8 | 155.3 |
| 10.5 | 144.83 | 0.045 | -0.16 | 25.21 | 132.7 | 136.6 | 140.5 | 144.8 | 149.3 | 153.7 | 158.3 |
| 11.0 | 147.38 | 0.046 | -0.09 | 25.21 | 134.8 | 138.8 | 142.9 | 147.4 | 152.1 | 156.5 | 161.3 |
| 11.5 | 150.34 | 0.047 | -0.05 | 25.21 | 137.2 | 141.4 | 145.6 | 150.3 | 155.2 | 159.9 | 164.8 |
| 12.0 | 153.81 | 0.048 | 0.07 | 25.21 | 139.9 | 144.3 | 148.8 | 153.8 | 159.0 | 163.8 | 169.1 |
| 12.5 | 157.73 | 0.050 | 0.34 | 25.21 | 142.8 | 147.7 | 152.4 | 157.7 | 163.1 | 168.2 | 173.6 |
| 13.0 | 161.91 | 0.050 | 0.76 | 25.21 | 146.1 | 151.3 | 156.4 | 161.9 | 167.5 | 172.7 | 178.1 |
| 13.5 | 166.03 | 0.049 | 1.27 | 25.21 | 149.7 | 155.2 | 160.4 | 166.0 | 171.6 | 176.7 | 181.9 |
| 14.0 | 169.57 | 0.047 | 1.75 | 25.21 | 153.2 | 158.8 | 164.0 | 169.6 | 175.0 | 179.9 | 184.8 |
| 14.5 | 172.39 | 0.045 | 2.09 | 25.21 | 156.5 | 161.9 | 167.0 | 172.4 | 177.6 | 182.2 | 186.8 |
| 15.0 | 174.57 | 0.042 | 2.19 | 25.21 | 159.4 | 164.6 | 169.5 | 174.6 | 179.5 | 183.9 | 188.3 |
| 15.5 | 176.16 | 0.040 | 2.07 | 25.21 | 161.8 | 166.7 | 171.3 | 176.2 | 180.9 | 185.1 | 189.4 |
| 16.0 | 177.25 | 0.038 | 1.78 | 25.21 | 163.6 | 168.2 | 172.6 | 177.2 | 181.8 | 185.9 | 190.1 |
| 16.5 | 178.04 | 0.037 | 1.38 | 25.21 | 165.0 | 169.4 | 173.6 | 178.0 | 182.5 | 186.5 | 190.7 |
| 17.0 | 178.72 | 0.036 | 0.94 | 25.21 | 166.2 | 170.3 | 174.4 | 178.7 | 183.1 | 187.1 | 191.3 |
| 17.5 | 179.13 | 0.036 | 0.50 | 25.21 | 166.8 | 170.8 | 174.8 | 179.1 | 183.5 | 187.6 | 191.9 |
| 18.0 | 179.29 | 0.036 | 0.11 | 25.21 | 167.0 | 171.0 | 174.9 | 179.3 | 183.7 | 187.9 | 192.4 |
| 18.5 | 179.43 | 0.037 | -0.19 | 25.21 | 167.1 | 171.1 | 175.0 | 179.4 | 184.0 | 188.3 | 192.9 |
Values shown are model-based estimates obtained using GAMLSS under the BCT distribution. The model was fitted with age expressed in months and treated as a continuous variable. The table presents model parameter estimates and centile values for selected age points between 6.0 and 18.5 years. The symbols mu, sigma, nu and tau denote the parameters of the distribution assumed in the fitted model. Bolded values indicate the median (50th centile).
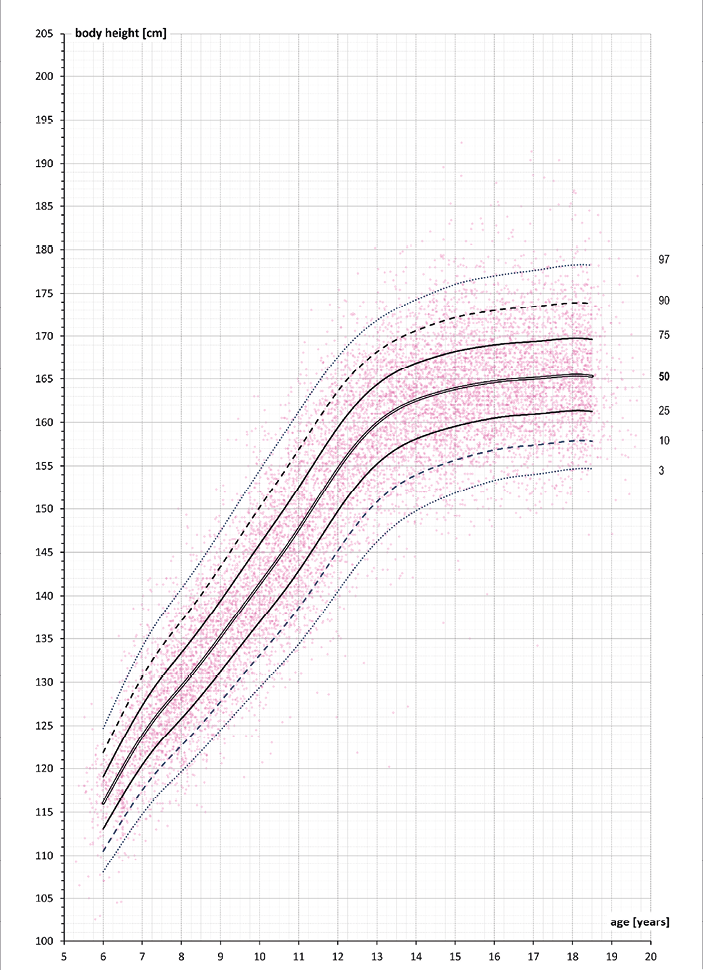
| BCT distribution | Centile values for selected age [cm] | ||||||||||
|---|---|---|---|---|---|---|---|---|---|---|---|
| Age (years) | mu | sigma | nu | tau | 3 | 10 | 25 | 50 | 75 | 90 | 97 |
| 6.0 | 116.11 | 0.036 | -0.30 | 20.19 | 108.1 | 110.5 | 113.1 | 116.0 | 119.0 | 121.8 | 124.7 |
| 6.5 | 120.07 | 0.038 | -0.52 | 20.19 | 111.6 | 114.2 | 116.9 | 120.1 | 123.4 | 126.4 | 129.6 |
| 7.0 | 123.75 | 0.039 | -0.68 | 20.19 | 114.8 | 117.5 | 120.4 | 123.8 | 127.3 | 130.6 | 134.1 |
| 7.5 | 126.84 | 0.040 | -0.74 | 20.19 | 117.4 | 120.3 | 123.3 | 126.9 | 130.6 | 134.1 | 137.7 |
| 8.0 | 129.51 | 0.041 | -0.69 | 20.19 | 119.7 | 122.6 | 125.8 | 129.5 | 133.4 | 137.0 | 140.8 |
| 8.5 | 132.29 | 0.042 | -0.59 | 20.19 | 122.0 | 125.1 | 128.4 | 132.3 | 136.3 | 140.1 | 144.0 |
| 9.0 | 135.26 | 0.043 | -0.47 | 20.19 | 124.5 | 127.8 | 131.2 | 135.2 | 139.4 | 143.4 | 147.4 |
| 9.5 | 138.30 | 0.044 | -0.33 | 20.19 | 127.0 | 130.5 | 134.1 | 138.3 | 142.7 | 146.8 | 151.0 |
| 10.0 | 141.34 | 0.045 | -0.10 | 20.19 | 129.4 | 133.1 | 136.9 | 141.4 | 145.9 | 150.2 | 154.5 |
| 10.5 | 144.39 | 0.046 | 0.23 | 20.19 | 131.8 | 135.7 | 139.8 | 144.4 | 149.1 | 153.5 | 157.9 |
| 11.0 | 147.65 | 0.046 | 0.65 | 20.19 | 134.4 | 138.6 | 142.9 | 147.7 | 152.5 | 156.9 | 161.3 |
| 11.5 | 151.15 | 0.046 | 1.16 | 20.19 | 137.3 | 141.8 | 146.3 | 151.2 | 156.1 | 160.4 | 164.6 |
| 12.0 | 154.59 | 0.044 | 1.67 | 20.19 | 140.5 | 145.2 | 149.7 | 154.7 | 159.4 | 163.6 | 167.6 |
| 12.5 | 157.57 | 0.042 | 2.07 | 20.19 | 143.6 | 148.3 | 152.8 | 157.6 | 162.2 | 166.2 | 170.0 |
| 13.0 | 159.86 | 0.040 | 2.24 | 20.19 | 146.2 | 150.8 | 155.2 | 159.9 | 164.4 | 168.2 | 171.8 |
| 13.5 | 161.47 | 0.039 | 2.13 | 20.19 | 148.3 | 152.7 | 157.0 | 161.5 | 165.8 | 169.6 | 173.2 |
| 14.0 | 162.52 | 0.038 | 1.75 | 20.19 | 149.8 | 154.0 | 158.1 | 162.6 | 166.9 | 170.6 | 174.3 |
| 14.5 | 163.24 | 0.037 | 1.21 | 20.19 | 150.9 | 154.9 | 158.9 | 163.3 | 167.6 | 171.5 | 175.2 |
| 15.0 | 163.81 | 0.037 | 0.66 | 20.19 | 151.8 | 155.7 | 159.5 | 163.9 | 168.2 | 172.2 | 176.0 |
| 15.5 | 164.28 | 0.037 | 0.20 | 20.19 | 152.7 | 156.3 | 160.1 | 164.3 | 168.7 | 172.6 | 176.6 |
| 16.0 | 164.66 | 0.036 | -0.17 | 20.19 | 153.3 | 156.8 | 160.5 | 164.7 | 169.0 | 173.0 | 177.0 |
| 16.5 | 164.93 | 0.036 | -0.46 | 20.19 | 153.8 | 157.2 | 160.8 | 164.9 | 169.2 | 173.2 | 177.3 |
| 17.0 | 165.08 | 0.036 | -0.75 | 20.19 | 154.0 | 157.4 | 160.9 | 165.1 | 169.4 | 173.4 | 177.6 |
| 17.5 | 165.26 | 0.036 | -1.07 | 20.19 | 154.3 | 157.6 | 161.2 | 165.3 | 169.6 | 173.7 | 178.0 |
| 18.0 | 165.39 | 0.036 | -1.44 | 20.19 | 154.6 | 157.9 | 161.3 | 165.4 | 169.8 | 173.9 | 178.3 |
| 18.5 | 165.27 | 0.036 | -1.82 | 20.19 | 154.7 | 157.9 | 161.3 | 165.3 | 169.6 | 173.8 | 178.2 |
Values shown are model-based estimates obtained using GAMLSS under the BCT distribution. The model was fitted with age expressed in months and treated as a continuous variable. The table presents model parameter estimates and centile values for selected age points between 6.0 and 18.5 years. The symbols mu, sigma, nu and tau denote the parameters of the distribution assumed in the fitted model. Bolded values indicate the median (50th centile).
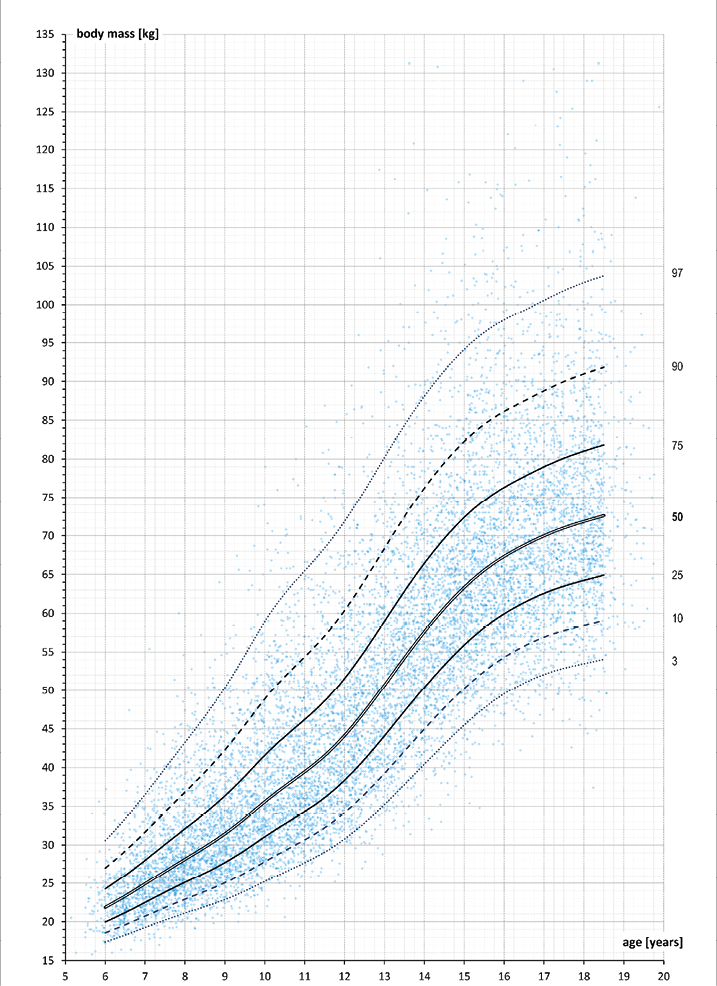
| BCCG distribution | Centile values for selected age [kg] | ||||||||||
|---|---|---|---|---|---|---|---|---|---|---|---|
| Age (years) | mu | sigma | nu | tau | 3 | 10 | 25 | 50 | 75 | 90 | 97 |
| 6.0 | 21.88 | 0.143 | -1.36 | – | 17.4 | 18.6 | 20.0 | 21.9 | 24.3 | 27.0 | 30.6 |
| 6.5 | 23.33 | 0.152 | -1.31 | – | 18.3 | 19.6 | 21.2 | 23.3 | 26.1 | 29.2 | 33.4 |
| 7.0 | 24.93 | 0.162 | -1.25 | – | 19.3 | 20.7 | 22.5 | 24.9 | 28.0 | 31.7 | 36.5 |
| 7.5 | 26.56 | 0.171 | -1.20 | – | 20.2 | 21.9 | 23.8 | 26.6 | 30.1 | 34.3 | 39.9 |
| 8.0 | 28.15 | 0.181 | -1.14 | – | 21.1 | 22.9 | 25.1 | 28.2 | 32.1 | 36.8 | 43.2 |
| 8.5 | 29.72 | 0.190 | -1.07 | – | 22.0 | 23.9 | 26.4 | 29.7 | 34.1 | 39.4 | 46.6 |
| 9.0 | 31.45 | 0.200 | -1.01 | – | 22.9 | 25.1 | 27.7 | 31.5 | 36.4 | 42.3 | 50.4 |
| 9.5 | 33.43 | 0.208 | -0.96 | – | 24.0 | 26.4 | 29.3 | 33.4 | 38.9 | 45.5 | 54.6 |
| 10.0 | 35.56 | 0.215 | -0.92 | – | 25.2 | 27.8 | 31.1 | 35.6 | 41.6 | 48.9 | 58.9 |
| 10.5 | 37.54 | 0.218 | -0.89 | – | 26.5 | 29.3 | 32.7 | 37.6 | 44.0 | 51.8 | 62.5 |
| 11.0 | 39.43 | 0.219 | -0.85 | – | 27.7 | 30.7 | 34.3 | 39.5 | 46.2 | 54.4 | 65.5 |
| 11.5 | 41.52 | 0.219 | -0.80 | – | 29.1 | 32.2 | 36.1 | 41.5 | 48.6 | 57.1 | 68.4 |
| 12.0 | 44.12 | 0.219 | -0.73 | – | 30.8 | 34.2 | 38.4 | 44.1 | 51.6 | 60.4 | 71.9 |
| 12.5 | 47.22 | 0.218 | -0.65 | – | 32.9 | 36.6 | 41.1 | 47.2 | 55.1 | 64.2 | 75.9 |
| 13.0 | 50.67 | 0.215 | -0.57 | – | 35.2 | 39.2 | 44.1 | 50.7 | 59.0 | 68.4 | 80.2 |
| 13.5 | 54.21 | 0.211 | -0.51 | – | 37.8 | 42.1 | 47.3 | 54.2 | 62.8 | 72.5 | 84.4 |
| 14.0 | 57.58 | 0.205 | -0.47 | – | 40.4 | 45.0 | 50.4 | 57.6 | 66.5 | 76.2 | 88.1 |
| 14.5 | 60.66 | 0.198 | -0.46 | – | 43.0 | 47.7 | 53.3 | 60.7 | 69.7 | 79.5 | 91.4 |
| 15.0 | 63.35 | 0.191 | -0.49 | – | 45.5 | 50.3 | 55.9 | 63.4 | 72.4 | 82.3 | 94.2 |
| 15.5 | 65.59 | 0.185 | -0.54 | – | 47.7 | 52.5 | 58.1 | 65.6 | 74.6 | 84.5 | 96.4 |
| 16.0 | 67.38 | 0.179 | -0.58 | – | 49.5 | 54.3 | 59.9 | 67.3 | 76.3 | 86.1 | 98.0 |
| 16.5 | 68.81 | 0.175 | -0.61 | – | 51.0 | 55.8 | 61.4 | 68.8 | 77.7 | 87.5 | 99.3 |
| 17.0 | 70.04 | 0.172 | -0.61 | – | 52.1 | 56.9 | 62.6 | 70.0 | 79.0 | 88.8 | 100.6 |
| 17.5 | 71.06 | 0.172 | -0.61 | – | 52.9 | 57.8 | 63.5 | 71.0 | 80.1 | 90.0 | 101.8 |
| 18.0 | 71.88 | 0.172 | -0.60 | – | 53.5 | 58.4 | 64.3 | 71.9 | 81.0 | 91.0 | 102.9 |
| 18.5 | 72.61 | 0.171 | -0.59 | – | 54.1 | 59.1 | 64.9 | 72.6 | 81.8 | 91.8 | 103.8 |
Values shown are model-based estimates obtained using GAMLSS under the BCCG distribution. The model was fitted with age expressed in months and treated as a continuous variable. The table presents model parameter estimates and centile values for selected age points between 6.0 and 18.5 years. The symbols mu, sigma, nu and tau denote the parameters of the distribution assumed in the fitted model. Tau is not estimated for the BCCG distribution. Bolded values indicate the median (50th centile).
| BCCG distribution | Centile values for selected age [kg] | ||||||||||
|---|---|---|---|---|---|---|---|---|---|---|---|
| Age (years) | mu | sigma | nu | tau | 3 | 10 | 25 | 50 | 75 | 90 | 97 |
| 6.0 | 20.61 | 0.148 | -1.65 | – | 16.4 | 17.5 | 18.8 | 20.6 | 23.0 | 25.9 | 29.9 |
| 6.5 | 22.47 | 0.158 | -1.57 | – | 17.6 | 18.8 | 20.4 | 22.5 | 25.2 | 28.7 | 33.5 |
| 7.0 | 24.22 | 0.167 | -1.48 | – | 18.7 | 20.1 | 21.8 | 24.2 | 27.4 | 31.3 | 37.0 |
| 7.5 | 25.81 | 0.176 | -1.39 | – | 19.7 | 21.2 | 23.1 | 25.8 | 29.4 | 33.8 | 40.1 |
| 8.0 | 27.30 | 0.183 | -1.30 | – | 20.5 | 22.2 | 24.3 | 27.3 | 31.2 | 36.1 | 43.1 |
| 8.5 | 28.89 | 0.190 | -1.21 | – | 21.5 | 23.3 | 25.6 | 28.9 | 33.2 | 38.5 | 46.1 |
| 9.0 | 30.60 | 0.197 | -1.11 | – | 22.4 | 24.5 | 27.0 | 30.6 | 35.3 | 41.1 | 49.2 |
| 9.5 | 32.39 | 0.204 | -1.00 | – | 23.4 | 25.7 | 28.5 | 32.4 | 37.5 | 43.8 | 52.5 |
| 10.0 | 34.24 | 0.211 | -0.87 | – | 24.4 | 26.9 | 30.0 | 34.3 | 39.9 | 46.6 | 55.6 |
| 10.5 | 36.22 | 0.216 | -0.75 | – | 25.4 | 28.2 | 31.6 | 36.2 | 42.3 | 49.4 | 58.8 |
| 11.0 | 38.52 | 0.220 | -0.63 | – | 26.7 | 29.7 | 33.4 | 38.5 | 45.0 | 52.6 | 62.2 |
| 11.5 | 41.20 | 0.220 | -0.53 | – | 28.4 | 31.7 | 35.7 | 41.2 | 48.1 | 55.9 | 65.7 |
| 12.0 | 44.06 | 0.214 | -0.46 | – | 30.5 | 34.0 | 38.3 | 44.1 | 51.2 | 59.1 | 68.7 |
| 12.5 | 46.72 | 0.204 | -0.43 | – | 32.8 | 36.5 | 40.9 | 46.7 | 53.8 | 61.6 | 71.0 |
| 13.0 | 48.96 | 0.192 | -0.44 | – | 35.0 | 38.8 | 43.2 | 49.0 | 56.0 | 63.6 | 72.6 |
| 13.5 | 50.78 | 0.181 | -0.51 | – | 37.1 | 40.8 | 45.1 | 50.8 | 57.6 | 65.0 | 73.8 |
| 14.0 | 52.33 | 0.171 | -0.62 | – | 39.0 | 42.6 | 46.8 | 52.3 | 59.0 | 66.2 | 74.9 |
| 14.5 | 53.62 | 0.163 | -0.76 | – | 40.7 | 44.1 | 48.2 | 53.6 | 60.2 | 67.3 | 76.1 |
| 15.0 | 54.64 | 0.158 | -0.88 | – | 41.9 | 45.3 | 49.3 | 54.6 | 61.1 | 68.3 | 77.2 |
| 15.5 | 55.39 | 0.155 | -0.98 | – | 42.8 | 46.2 | 50.1 | 55.4 | 61.9 | 69.1 | 78.2 |
| 16.0 | 55.94 | 0.155 | -1.06 | – | 43.4 | 46.7 | 50.6 | 55.9 | 62.5 | 69.9 | 79.3 |
| 16.5 | 56.33 | 0.157 | -1.14 | – | 43.7 | 47.0 | 51.0 | 56.3 | 63.1 | 70.8 | 80.7 |
| 17.0 | 56.63 | 0.159 | -1.21 | – | 43.8 | 47.2 | 51.2 | 56.6 | 63.6 | 71.6 | 82.2 |
| 17.5 | 56.90 | 0.161 | -1.28 | – | 44.0 | 47.4 | 51.4 | 56.9 | 64.0 | 72.4 | 83.6 |
| 18.0 | 57.21 | 0.162 | -1.36 | – | 44.3 | 47.6 | 51.7 | 57.2 | 64.4 | 73.0 | 84.8 |
| 18.5 | 57.55 | 0.162 | -1.44 | – | 44.7 | 48.0 | 52.0 | 57.6 | 64.8 | 73.7 | 86.0 |
Values shown are model-based estimates obtained using GAMLSS under the BCCG distribution. The model was fitted with age expressed in months and treated as a continuous variable. The table presents model parameter estimates and centile values for selected age points between 6.0 and 18.5 years. The symbols mu, sigma, nu and tau denote the parameters of the distribution assumed in the fitted model. Tau is not estimated for the BCCG distribution. Bolded values indicate the median (50th centile).
Discussion
The tradition of research on the physical development of children and adolescents in Poland dates back to the 1930s, when the Department of Anthropology of the Central Institute of Physical Education in Warsaw conducted the first large-scale project investigating the development and physical fitness of Polish youth (Mydlarski, 1934). This line of research was continued in the 1950s, with the aim of determining the extent of deterioration in the physical development of the post-war generation of children and adolescents in Poland (Trześniowski, 1961). Subsequent nationwide representative studies on the physical development and fitness of schoolchildren were carried out in 1979 (Trześniowski, 1990), 1989 (Przewęda & Trześniowski, 1996), 1999 (Przewęda & Dobosz, 2005, 2007), and 2009 (Dobosz, 2012; Dobosz et al., 2015). At the same time, detailed somatic measurements of adults, school-aged children, and adolescents throughout the country were conducted by anthropologists from the Committee of Anthropology of the Polish Academy of Sciences in Wrocław, established to implement the Polish Anthropological Nationwide Field Investigations project. Over a period of 60 years, five editions of this project were completed (Bielecki et al., 2012; Gomula et al., 2021; Kozieł et al., 2014).
At the beginning of the present century, population reference scales for infants as well as school-aged children and adolescents in Poland were still based on studies of Warsaw populations (Palczewska & Niedźwiedzka, 2001). The most recent nationwide studies based on a random sample of children and adolescents were conducted between 2007 and 2012 within the OLAF and OLA projects, and their results were presented as the Polish 2010 and 2012 reference systems for school-aged children and adolescents and for preschool children, respectively (Kułaga et al., 2011, 2013, 2015).
The present study has a cross-sectional design and lies at the intersection of the social and medical sciences. Its particular strengths include both the large sample size and the nationwide coverage. In order to obtain a sample that reflected as closely as possible the structure of the population of children and adolescents in Poland, the study was conducted in a substantial proportion of the schools previously included in the OLAF project (Kułaga et al., 2011). The sampling methodology also drew on the assumptions adopted in the third, fourth, and fifth editions of the nationwide anthropological surveys of children and adolescents, which were carried out in the same areas of the country (Kozieł et al., 2014).
An additional strength of the data collected in the project, and a guarantee of the quality of the measurements of basic anthropometric traits, is that they were performed by a small team of 20 anthropologists experienced in conducting this type of research. The Type A standard uncertainty of measurement ranged from 0.01 to 0.03 cm. In previous nationwide studies, anthropometric measurements were performed by large teams of trained students, representatives of the medical community (Kozieł et al., 2014; Kułaga et al., 2011, 2013), or physical education teachers (Dobosz, 2012; Dobosz et al., 2015; Przewęda & Dobosz, 2005, 2007; Przewęda & Trześniowski, 1996; Trześniowski, 1961, 1990).
In the analyses of study outcomes, age at examination was used, calculated on the basis of the full date of birth and the date of measurement. In contrast, analyses of participant counts and comparisons of the sample age structure with nationwide data (Główny Urząd Statystyczny, 2025) were based on reference age, defined as completed years of age as of 31 December 2024, in accordance with the definition used in official statistics. Differences between these two age definitions were assessed on the basis of shifts in counts and flow indicators across age categories (Tables 2 and 3). In the age range of 6–19 years, these differences were small (1.22 and 1.95 percentage points) and resulted mainly from shifts between adjacent categories (±1 year), which indicates that the use of reference age does not materially distort the description of the sample age structure in population comparisons. This approach justifies relating the study results to official statistics using the age categories applied by Statistics Poland (GUS).
At the same time, the analysis of counts by age category (6–18 years) revealed both underrepresentation and overrepresentation of some age groups relative to the nationwide population. Lower relative counts were observed among boys and girls aged 6 and 18 years, whereas higher relative counts were found among 14-year-old boys and among 10- and 14-year-old girls. Even more pronounced differences concerned the territorial structure of the sample. The highest relative share of study participants was recorded in the Świętokrzyskie voivodeship (0.92%), which was approximately 3.5 times higher than the corresponding values observed in the Śląskie and Mazowieckie voivodeships. These differences do not automatically justify the conclusion that the obtained results fail to reflect the distribution of the analysed somatic traits in a large nationwide sample. They do, however, indicate the need for further analyses and the application of statistical weights to adjust the sample structure to the population structure. This step appears necessary for the development of reliable reference scales for body height and body mass in the contemporary Polish population, as well as for assessing the agreement between the unweighted characteristics presented in this paper and the estimates obtained after weighting-based correction of the sample structure.
In Poland, multiple reference systems for the assessment of physical development continue to be used in parallel, including older charts based on Warsaw data (Palczewska & Niedźwiedzka, 2001) and more recent nationwide references developed within the OLAF/OLA studies. Kułaga and Kotowska (2025) showed that the nationwide references from 2010 and 2012, developed using the LMS method accounting for distributional skewness, provide computationally consistent results near key diagnostic cut-off points, such as the 3rd centile for body height and the 95th centile for BMI, whereas older Warsaw references may lead to inconsistencies in the estimation of centiles and Z-scores.
Against this background, the approach used in our project represents a further methodological step forward. GAMLSS models generalize the LMS framework and allow the distribution family to be selected on the basis of information criteria and goodness-of-fit diagnostics, including worm plots and Q-statistics. This makes it possible to achieve a better fit of the model to the empirical shape of the distributions of somatic traits. In addition, the short period of data collection reduces the risk of within-study secular trends. The variation in cohort and voivodeship coverage identified in the present study provides a basis for the construction of weights and for adjusting the sample structure to the population structure, which will facilitate the development of updated nationwide reference data for the assessment of growth and development in school-aged children and adolescents.
It should be emphasized that the centile modelling results presented in this paper were based on a large nationwide sample; however, the analyses were performed without the application of weighting procedures correcting for differences between the structure of the study sample and that of the national population. Therefore, the resulting curves should currently be interpreted primarily as a description of the empirical distribution of the analysed somatic traits in the study sample. Although the sample size within particular age ranges was sufficient for stable modelling using the GAMLSS approach, a fuller alignment of the estimates with the structure of the nationwide population will require the application of weighting procedures in further analyses.
Conclusions
The present study, based on a cross-sectional design, is characterized by a large sample size and nationwide coverage. The high quality of the measurements of basic anthropometric traits in children and adolescents was ensured by their collection within a short period by a small team of experienced anthropologists. The methods used for data analysis are consistent with contemporary standards of statistical analysis. The results presented here provide a basis for the development of updated reference systems for basic somatic traits in school-aged children and adolescents aged 6–18 years.
References
Akaike, H. (1998). Information theory and an extension of the maximum likelihood principle. In: E. Parzen, K. Tanabe, & G. Kitagawa (Eds.), Selected papers of Hirotugu Akaike (pp. 199–213). Springer. https://doi.org/10.1007/978-1-4612-1694-0_15
Bielecki, E. M., Haas, J. D., & Hulanicka, B. (2012). Secular changes in the height of Polish schoolboys from 1955 to 1988. Economics and Human Biology, 10(3), 310–317. https://doi.org/10.1016/j.ehb.2011.06.004
Bielicki, T. (1986). Physical growth as a measure of the economic well-being of populations: The twentieth century. In: F. Falkner & J. M. Tanner (Eds.), Human growth: A comprehensive treatise (Vol. 3, pp. 283–305). Plenum Press.
Burnham, K. P., & Anderson, D. R. (2002). Model selection and inference: A practical information-theoretic approach (2nd ed.). Springer-Verlag. https://doi.org/10.1007/b97636
Charzewski, J., Lewandowska, J., Piechaczek, H., Syta, A., & Łukaszewska, L. (2003). Kontrasty społeczne rozwoju somatycznego i aktywności fizycznej dzieci 13–15-letnich (Studia i Monografie AWF w Warszawie, nr 97). Wydawnictwo AWF.
Cole, T. J. (1988). Fitting smoothed centile curves to reference data. Journal of the Royal Statistical Society: Series A (Statistics in Society), 151, 385–418. https://doi.org/10.2307/2982992
Cole, T. (2021). Sample size and sample composition for constructing growth reference centiles. Statistical Methods in Medical Research, 30(2), 488–507. https://doi.org/10.1177/0962280220958438
Cole, T. J., & Green, P. J. (1992). Smoothing reference centile curves: the LMS method and penalized likelihood. Statistics in Medicine, 11(10), 1305–1319. https://doi.org/10.1002/sim.4780111005
Cole, T. J., & Lobstein, T. (2012). Extended international (IOTF) body mass index cut-offs for thinness, overweight and obesity. Pediatric Obesity, 7(4), 284–294. https://doi.org/10.1111/j.2047-6310.2012.00064.x
Cole, T. J., & Mori, H. (2018). Fifty years of child height and weight in Japan and South Korea: Contrasting secular trend patterns analyzed by SITAR. American Journal of Human Biology, 30(1), e23054. https://doi.org/10.1002/ajhb.23054
de Onis, M., Onyango, A. W., Borghi, E., Siyam, A., Nishida, C., & Siekmann, J. (2007). Development of a WHO growth reference for school-aged children and adolescents. Bulletin of the World Health Organization, 85(9), 660–667. https://doi.org/10.2471/blt.07.043497
Dobosz, J. (2012). Kondycja fizyczna dzieci i młodzieży w wieku szkolnym: Siatki centylowe. Akademia Wychowania Fizycznego Józefa Piłsudskiego w Warszawie. Warszawa.
Dobosz, J., Mayorga-Vega, D., & Viciana, J. (2015). Percentile Values of Physical Fitness Levels among Polish Children Aged 7 to 19 Years – Population-Based Study. Central European Journal of Public Health, 23(4), 340–351. https://doi.org/10.21101/cejph.a4153
Efron, B., & Tibshirani, R. J. (1993). An introduction to the bootstrap. Chapman and Hall. https://doi.org/10.1007/978-1-4899-4541-9
Eiholzer, U., Stephan, A., Dubinski, I., Fritz, C., & Noordam, C. (2025). Updated Swiss Growth References 2025: No Height Differences, but BMI Variations Associated with Migration. Journal of Clinical Medicine, 14(16), 5912. https://doi.org/10.3390/jcm14165912
Główny Urząd Statystyczny. (2025). Baza Demografia: Stan i struktura ludności – ludność według stanu w dniu 31 XII 2024. https://demografia.stat.gov.pl/bazademografia/Tables.as
Główny Urząd Statystyczny. (n.d.). Słownik pojęć. https://stat.gov.pl/metainformacje/slownik-pojec/pojecia-stosowane-w-statystyce-publicznej/724,pojecie.html
Gomula, A., Nowak-Szczepanska, N., & Koziel, S. (2021). Secular trend and social variation in height of Polish schoolchildren between 1966 and 2012. Acta Paediatrica (Oslo, Norway: 1992), 110(4), 1225–1230. https://doi.org/10.1111/apa.15572
Gomula, A., Nowak-Szczepanska, N., Hermanussen, M., Scheffler, C., & Koziel, S. (2021). Trends in growth and developmental tempo in boys aged 7 to 18 years between 1966 and 2012 in Poland. American Journal of Human Biology, 33(6), e23548. https://doi.org/10.1002/ajhb.23548
Jarosz, M., Charzewska, J., Wolnicka, K., Wajszczyk, B., Chwojnowska, Z., Taraszewska, A., & Jaczewska-Schuetz, J. (2016). Stan odżywienia dzieci i młodzieży szkolnej w Polsce – badania w ramach projektu KIK/34 „Zachowaj równowagę” realizowanego w Szwajcarsko-Polskim Programie Współpracy. Żywienie Człowieka i Metabolizm, 43(4), 231–238.
Júlíusson, P. B., Roelants, M., Nordal, E., Furevik, L., Eide, G. E., Moster, D., Hauspie, R., & Bjerknes, R. (2013). Growth references for 0–19 year-old Norwegian children for length/height, weight, body mass index and head circumference. Annals of Human Biology, 40(3), 220–227. https://doi.org/10.3109/03014460.2012.759276
Kozieł, S., Nowak-Szczepańska, N., & Gomuła, A. (2014). Antropologiczne badania dzieci i młodzieży w Polsce w latach 1966–2012: Zmiany sekularne i różnicowanie społeczne. Oficyna Wydawnicza Arboretum.
Kryst, Ł., Żegleń, M., Woronkowicz, A., & Kowal, M. (2022). Body height, weight, and Body Mass Index – magnitude and pace of secular changes in children and adolescents from Kraków (Poland) between 1983 and 2020. American Journal of Human Biology, 34(9), e23779. https://doi.org/10.1002/ajhb.23779
Kułaga, Z., & Kotowska, A. (2025). Assessment of the Internal Consistency of Two Polish References in Detecting Short Stature and Obesity in Children and Adolescents. Anthropological Review, 88(4), 69–76. https://doi.org/10.18778/1898-6773.88.4.04
Kułaga, Z., Grajda, A., Gurzkowska, B., Góźdź, M., Wojtyło, M., Swiąder, A., Różdżyńska-Świątkowska, A., & Litwin, M. (2013). Polish 2012 growth references for preschool children. European Journal of Pediatrics, 172(6), 753–761. https://doi.org/10.1007/s00431-013-1954-2
Kułaga, Z., Litwin, M., Tkaczyk, M., Palczewska, I., Zajączkowska, M., Zwolińska, D., Krynicki, T., Wasilewska, A., Moczulska, A., Morawiec-Knysak, A., Barwicka, K., Grajda, A., Gurzkowska, B., Napieralska, E., & Pan, H. (2011). Polish 2010 growth references for school-aged children and adolescents. European Journal of Pediatrics, 170(5), 599–609. https://doi.org/10.1007/s00431-010-1329-x
Kułaga, Z., Różdżyńska-Świątkowska, A., Grajda, A., Gurzkowska, B., Wojtyło, M., Góźdź, M., Świąder-Leśniak, A., & Litwin, M. (2015). Siatki centylowe dla oceny wzrastania i stanu odżywienia polskich dzieci i młodzieży od urodzenia do 18 roku życia. Standardy Medyczne Pediatria, 12, 119–135.
Li, H., Ji, C. Y., Zong, X. N., & Zhang, Y. Q. (2009). Height and weight standardized growth charts for Chinese children and adolescents aged 0 to 18 years. Zhonghua er ke za zhi = Chinese Journal of Pediatrics, 47(7), 487–492.
Mazur, J. (2024). Child and adolescent health. In: S. Golinowska (Ed.), Public health: The social and ecological dimension (pp. 272–289). Scholar Publishing House.
Mydlarski, J. (1934). Sprawność fizyczna młodzieży w Polsce. Przegląd Fizjologii Ruchu.
NCD Risk Factor Collaboration (NCD-RisC). (2020). Height and body-mass index trajectories of school-aged children and adolescents from 1985 to 2019 in 200 countries and territories: a pooled analysis of 2181 population-based studies with 65 million participants. The Lancet, 396(10261), 1511–1524. https://doi.org/10.1016/S0140-6736(20)31859-6
NCD Risk Factor Collaboration (NCD-RisC) (2024). Worldwide trends in underweight and obesity from 1990 to 2022: a pooled analysis of 3663 population-representative studies with 222 million children, adolescents, and adults. The Lancet, 403(10431), 1027–1050. https://doi.org/10.1016/S0140-6736(23)02750-2
Ortega, F.B., Leskošek, B., Blagus, R., Gil-Cosano, J.J., Mäestu, J., Tomkinson, G. R., Ruiz, J.R., Mäestu, E., Starc, G., Milanovic, I., Tammelin, T. H., Sorić, M., Scheuer, C., Carraro, A., Kaj, M., Csányi, T., Sardinha, L. B., Lenoir, M., Emeljanovas, A., Mieziene, B., Sidossis, L.S., Pihu, M., Lovecchio, N., Konstabel, K., Tambalis, K. D., Štefan, L., Drenowatz, C., Rubín, L., Gontarev, S., Castro-Piñero, J., Vanhelst, J., O’Keeffe, B., Veiga, O. L., Gisladottir, T., Sandercock, G., Misigoj-Durakovic, M., Niessner, C., Riso E-M., Popovic, S., Kuu, S., Chinapaw, M., Clavel, I., Labayen, I., Dobosz, J., Colella, D., Kriemler, S., Salaj, S., Noriega, M. J., Bös, K., Sánchez-López, M., Lakka, T. A., Tabacchi, G., Novak, D., Ahrens, W., Wedderkopp, N., Jurak, G., & the FitBack, HELENA and IDEFICS consortia. (2023). European fitness landscape for children and adolescents: updated reference values, fitness maps and country rankings based on nearly 8 million test results from 34 countries gathered by the FitBack network. British Journal of Sports Medicine, 57(5), 299–310. https://doi.org/10.1136/bjsports-2022-106176
Palczewska, I., & Niedzwiedzka, Z. (2001). Wskaźniki rozwoju somatycznego dzieci i młodziezy Warszawskiej [Somatic development indices in children and youth of Warsaw]. Medycyna Wieku Rozwojowego, 5(2 Suppl 1), 18–118.
Pan, H., & Cole, T. J. (2004). A comparison of goodness of fit tests for age-related reference ranges. Statistics in Medicine, 23(11), 1749–1765. https://doi.org/10.1002/sim.1692
Pascanu, I., Pop, R., Barbu, C. G., Dumitrescu, C. P., Gherlan, I., Marginean, O., Preda, C., Procopiuc, C., Vulpoi, C., & Hermanussen, M. (2016). Development of synthetic growth charts for romanian population. Acta Endocrinologica (Bucharest, Romania: 2005), 12(3), 309–318. https://doi.org/10.4183/aeb.2016.309
Pastor-Fajardo, M. T., Bosch-Giménez, V. M., Larqué, E., Solano Navarro, C., Fuentes-Castelló, M. Á., & Pastor-Rosado, J. (2020). Prevalence and secular trend of childhood overweight and obesity in a Mediterranean area of Southeast Spain. Child and Adolescent Obesity, 3(1), 136–149.
Pop, R.-M., Tenenboum, A., & Pop, M. (2021). Secular Trends in Height, Body Mass and Mean Menarche Age in Romanian Children and Adolescents, 1936–2016. International Journal of Environmental Research and Public Health, 18(2), 490. https://doi.org/10.3390/ijerph18020490
Przewęda, R., & Dobosz, J. (2005). Growth and physical fitness of Polish youths. Wydawnictwo AWF.
Przewęda, R., & Dobosz, J. (2007). Kondycja fizyczna polskiej młodzieży. Wydawnictwo AWF.
Przewęda, R., & Trześniowski, R. (1996). Sprawność fizyczna polskiej młodzieży w świetle badań z roku 1989 (Studia i Monografie AWF). Wydawnictwo AWF.
Rigby, R. A., & Stasinopoulos, D. M. (2005). Generalized additive models for location, scale and shape. Journal of the Royal Statistical Society: Series C (Applied Statistics), 54(3), 507–554. https://doi.org/10.1111/j.1467-9876.2005.00510.x
Rigby, R. A., Stasinopoulos, M., Heller, G. Z., & De Bastiani, F. (2019). Distributions for modeling location, scale, and shape: Using GAMLSS in R. Chapman and Hall/CRC.
Roelants, M., Hauspie, R., & Hoppenbrouwers, K. (2009). References for growth and pubertal development from birth to 21 years in Flanders, Belgium. Annals of Human Biology, 36(6), 680–694. https://doi.org/10.3109/0301446090304907
Rosario, A. S., Schienkiewitz, A., & Neuhauser, H. (2011). German height references for children aged 0 to under 18 years compared to WHO and CDC growth charts. Annals of Human Biology, 38(2), 121–130. https://doi.org/10.3109/03014460.2010.521193
Saari, A., Sankilampi, U., Hannila, M. L., Kiviniemi, V., Kesseli, K., & Dunkel, L. (2011). New Finnish growth references for children and adolescents aged 0 to 20 years: Length/height-for-age, weight-for-length/height, and body mass index-for-age. Annals of Medicine, 43(3), 235–248. https://doi.org/10.3109/07853890.2010.515603
Schwarz, G. (1978). Estimating the dimension of a model. The Annals of Statistics, 6(2), 461–464.
Stasinopoulos, D., Rigby, R. A., Heller, G. Z., Voudouris, V., & De Bastiani, F. (2017). Flexible regression and smoothing: Using GAMLSS in R. Chapman & Hall/CRC.
Tomkinson, G. R., Carver, K. D., Atkinson, F., Daniell, N. D., Lewis, L. K., Fitzgerald, J. S., Lang, J. J., & Ortega, F. B. (2018). European normative values for physical fitness in children and adolescents aged 9–17 years: results from 2 779 165 Eurofit performances representing 30 countries. British Journal of Sports Medicine, 52(22), 1445–1456. https://doi.org/10.1136/bjsports-2017-098253
Trześniowski, R. (1961). Rozwój fizyczny i sprawność młodzieży polskiej. Nasza Księgarnia.
Trześniowski, R. (1990). Rozwój fizyczny i sprawność fizyczna młodzieży szkolnej w Polsce. Wydawnictwo AWF.
UNICEF. (2025). Feeding profit: How food environments are failing children (Child Nutrition Report 2025). https://data.unicef.org/resources/feeding-profit-2025-child-nutrition-report/
van Buuren, S., & Fredriks, M. (2001). Worm plot: A simple diagnostic device for modelling growth reference curves. Statistics in Medicine, 20(8), 1259–1277. https://doi.org/10.1002/sim.746
WHO. (1995). Physical status: the use of and interpretation of anthropometry, report of a WHO expert committee. https://iris.who.int/server/api/core/bitstreams/108e365f-0394-44ef-8d17-3e6b80429814/content
WHO. (2006). WHO child growth standards: Length/height-for-age, weight-for-age, weight-for-length, weight-for-height and body mass index-for-age: Methods and development. https://www.who.int/toolkits/child-growth-standards/standards
Final information
Acknowledgements
The authors would like to thank Prof. Agnieszka Różdzyńska-Świątkowska, PhD, from the Anthropology Laboratory at the Children’s Memorial Health Institute in Warsaw, for providing a list of schools participating in the OLAF project, and to the researchers who conducted the measurements in this project: Prof. Ryszard Asienkiewicz, PhD, Prof. Krzysztof Buśko, PhD, Alfreda Dencikowska, PhD, Magdalena Durda-Masny, PhD, Katarzyna Graja, PhD, Paulina Handzlik-Waszkiewicz, PhD, Bartłomiej Hes, PhD, Katarzyna Kubasiak, PhD, Joanna Lewandowska, PhD, Anna Majcher, PhD, Kinga Michnik, PhD, Prof. Ewa Rębacz-Maron, PhD, Agnieszka Przychodni, PhD, Prof. Agnieszka Suder, PhD, Prof. Anita Szwed, PhD as well as the staff of the Institute of Sport – National Research Institute: Prof. Jadwiga Malczewska-Lenczowska, PhD, Prof. Dorota Sadowska, PhD, Prof. Blair Crewther, PhD, Anna Pastuszak, PhD, and Dominika Granda, PhD.
Contributions from individual authors
Anna Pastuszak and Janusz Dobosz contributed to the study conception and design. Material preparation and data collection were performed by Anna Pastuszak, Dorota Sadowska, and Janusz Dobosz. Analysis was performed by Janusz Dobosz, and Anna Pastuszak. The first draft of the manuscript was written by Anna Pastuszak, and Janusz Dobosz. Dorota Sadowska reviewed and edited the manuscript, providing revisions. All authors commented on previous versions of the manuscript. All authors read and approved the final manuscript.
Ethics statement
The research project was reviewed by the Research Ethics Committee operating at the Institute of Sport – National Research Institute (approval No. KEBN-24-100-AP). The reviewed materials included the study protocol, the content of the project and measurement forms, and the procedure for obtaining informed consent from respondents and their parents. Parents were asked to provide written informed consent for their child’s participation in the study, whereas students expressed assent by taking part in the measurements after having been informed about the aims of the study, the confidential nature of the study and their right to withdraw at any time.
Data availability statement
Data are available from the corresponding author upon reasonable request.
Financial disclosure
Publication funded by the state budget under the program of the Minister of Education and Science “Science for Society II”, project no. NdS-II/SN/0183/2024/01, project funding amount: PLN 2 000000 (Poland).
Conflict of interest
The authors declare that there is no conflict of interest regarding this manuscript.
Corresponding author
Anna Pastuszak, Department of Biomechanics Institute of Sport National Research Institute, Trylogii 2/16, 01-982 Warsaw, Poland, e-mail: anna.pastuszak@insp.pl