Available online at: https://doi.org/10.18778/1898-6773.87.3.06
 https://orcid.org/0009-0005-9575-3148
Department of Anthropology, Faculty of Science, Masaryk University
https://orcid.org/0000-0001-9321-3360
Department of Anthropology, Faculty of Science, Masaryk University
ABSTRACT: Modern physical anthropology increasingly employs non-invasive methods that use 3D models representing the human body. Frequently, these are 3D models of a person’s physical appearance, i.e., face or body. A traditional approach to analyse these records is to process discrete points (landmarks, feature points) collected manually on the model surface. The digitization of landmarks and associated errors have been sufficiently studied in the context of the human face, due to its functional and aesthetic importance. However, other parts of the human body have not received the same level of attention.
The aim of the present study was to quantify the error of body landmarks when collected in 3D full-body models and to explore how it relates to other model properties, such as a demographic and somatic indicators.
The study tested two datasets of 10 body landmarks acquired in 60 models (32 males and 28 females). The data acquisition was carried out during the time span of 14 days. The magnitude of the digitization error for each point was acquired and tested between groups defined according to their anatomical location (shoulders, arms, legs; torso and limbs or body side), sex, age, height and body type.
The results of this study showed that the error of digitising landmarks in a 3D model was greater compared to the error reported in the literature when acquiring landmarks on the human body. The digitization error was independent of participants’ age, sex, height, and body type but was correlated with the anatomical location, where the upper chest, neck, and back on the knee yielded the highest digitization errors. In addition, this study showed that landmarks located on the shoulders and arms exhibited an error which was correlated negatively with the volume of the lower and upper half of the body and positively with the body depth.
KEY WORDS: digitization, landmarks, 3D model, digitization error, morphology, morphometry.
The rapid development of imaging and information technologies in the last two decades has enabled to extend the study of the human body into a digital environment. The key prerequisite for conducting a virtual body assessment is the accurate transfer of the human body properties, such as size, shape, colour, to the virtual workspace. Generally, the result of such a transfer (via 3D optical or laser scanning, or single-camera photogrammetry) is a three-dimensional model, also referred to as a polygonal model or 3D mesh (Daanen and Ter Haar 2013). Unlike traditional approaches, such as 2D images, photographs, or conventional measurements, three-dimensional models encompass complex morphological details about the human body, which also includes the depth information which is, otherwise, lost when using the traditional two-dimensional imagery. As an additional benefit, three-dimensional body models can be easily shared in the manner which is identical to any digital data. Importantly, their qualitative and quantitative properties may be explored, once or repeatedly, without requiring direct human contact or sometimes tedious and time-consuming repeated interactions with the subject under study (Kullmer 2008; Craik and Collings 2022).
To date, the quantitative variation of the human body represented by three-dimensional virtual models have been examined by a variety of traditional as well as advanced approaches, such as traditional measurements, curves, or surface comparison (Ben Azouz et al. 2008; Urbanová 2016; Čuta et al. 2024). However, the most frequent are studies of 3D models by means of discrete points, i.e., landmarks, collected manually or automatically on the model surface (Bromiley et al. 2014; Urbanová et al. 2018). The exact position of the collected landmarks within the virtual workspace is traditionally expressed by the Cartesian x, y, z coordinates (Bookstein 1991). These coordinates are used as start and end points to calculate inter-landmark distances, compatible to linear measurements (Caple and Stephan 2016), or to determine ratios, indices, or angles (Sforza and Ferrario 2006). In more complex data processing, they function as registration points to align and superimpose three-dimensional models (Charlier et al. 2014). Subsequently, in post-registration analysis, they serve as variables related to shape and/or size (Zelditch et al. 2012).
The quantitative methods employed to study human variation in 3D virtual body features can be considered accurate and meaningful only on the condition that data are collected cautiously, reliably and without bias. Therefore, to ensure an optimal level of accuracy, repeatability and reproducibility of collected landmarks is paramount (Jones and Rioux 1997). There are four approaches to quantifying acquisition error when discrete points are collected – 1) superimposition-based method, 2) simplified residual method, 3) inter-landmark distance method, and 4) point-to-centroid method. The first approach involves the use of two or more sets of digitized landmarks aligned using a registration method, such as Generalized Procrustes Analysis (GPA), Generalized resistant-fit analysis or the three-point registration (Slice 1996). The registration minimizes the spatial differences between the corresponding points based on the selected measure of deviation, e.g., least-squares, medians etc. Then, direct distances between corresponding points are calculated. This determines the acquisition error at the given point, while the sum of inter-point distances comprises the total error. Alternatively, under the condition that the sets of landmarks are aligned to three body axes, deviations relative to x, y, z axes can be calculated. This may further clarify the direction in which the error is imposed (von Cramon-Taubadel et al. 2007).
The second approach is an alternative of the first approach. It involves quantifying acquisition error from sets of landmark configurations collected repeatedly, while keeping the position of the 3D model unchanged and omitting the registration process (Arnqvist and Mårtensson 1998).
In the third approach, digitization error is quantified using modified methodology from an international standard (ISO 20685-1:2018), where two sets of measurements calculated from landmarks are confronted. The difference between the first and second measurement is calculated to determine the average measurement error and the measurement estimation error. Unlike the superimposition approach, this technique is more successful in localizing the source of error as superposition can dilute the error between landmarks (Ross and Williams 2008).
Ultimately, the fourth approach for error assessment uses the position of the centroid (i.e., the centre of a landmark configuration) and determines distances from the centroid to each point of the configuration. The digitization error is then expressed as the difference between the distances derived from the first and the second set of points (von Cramon-Taubadel et al. 2007; Navarro et al. 2019). This approach is particularly suited for determining the error of closely related landmarks, such as outlines (Chen et al. 2002). As distance-based approaches, both the third and fourth methods require no registration of landmarks.
While there ought to be maximum effort to achieve minimum measurement or data acquisition errors, there is little doubt that such intentions are frequently influenced by a number of external and internal factors. External factors include factors inherent to the digitization process. These include the software used to collect data, workplace, work schedule, or time restrictions. It has been shown that in a less intuitive virtual environment, working with digital data increases the time requirements, and when combined with time pressure it may result in errors (Jurda et al. 2019). Generally, acquiring experience and skills in digital data processing leads to increased accuracy (Kouchi and Mochimaru 2011).
In contrast, internal factors influencing data accuracy and reliability include the type, position, and definition of the landmark (or measurement) and the characteristics of the 3D model on which the data collection is conducted. These factors encompass demographic indicators, such as age and biological sex as well as body somatic indicators (Muehlenbein 2010). According to Bookstein’s classification system (1991), type II and III landmarks are particularly sensitive to acquisition errors. These points are defined as the extremes of curvatures or points furthest along (or away from) some structure or the standard anatomical axis (Benfer, 1975; Zelditch et al. 2012). In traditional caliper-based anthropometrics, these landmarks are identified tentatively by tracing the vicinity of anatomical spots until the maximum distance is reached and registered. Consequently, “instrumentally determined” or “maximum width” landmarks, such as the zygion or the vertex, often exhibit the greatest error in only one direction (Katina et al. 2016).
Studies examining the association between the error of landmark placement and body characteristics are scarce, despite potential interference from sex-related variations in body posture and composition, fat distribution, muscle development, or the tendency toward lower limb swelling. Among the few published studies, Hara et al. (2016) found no influence of participants’ age and sex on digitization error in two-dimensional records. Similarly, for faces, the influence of sex (Daboul et al. 2018) and age (Ferrario et al. 2022) was investigated providing negative results. The effect of body type has primarily been quantified for automatic digitization systems, where automatically digitized landmarks exhibited errors correlated with different or atypical body shapes (Devarajan and Istook 2004).
There is a wide range of digitization error that is generally tolerated without questioning the integrity of the published studies. Similarly, there is no consensus on how large the error is acceptable (Ulijaszek a Kerr 1999; Ryan-Stewart et al. 2022). The published work agree that the threshold of acceptable error varies with the size of the body or body parts for which the error is quantified (Ruescas-Nicolau et al. 2024). While a larger error is acceptable for the gross anatomical parts, the same error for the finer body elements has a significant effect on acquired results. In traditional somatometrics, such relevance is underlined by expressing the measurement error relative to the taken measurement. Of the human body parts, the human face is the most frequent anatomical site to quantify acquisition error. Fourie et al. (2011) reported a tolerated acquisition error of 1.5 mm when collecting standard facial points. Sukno et al. (2015) obtained an overall error of 2.3 mm, with averages per landmark below 3.4 mm for 14 tested points and within 2 mm for half of them. In addition to the extent of an error, identifying its direction provides insights into data variation. For instance, Utermohle and Zegura (1982) highlighted directional trends in quantitative data acquisition, observing that in traditional craniometrics, the second set of repeated measurements tended to yield larger values than the initial measurements.
One of the principles related to point accuracy was outlined by Prokopec published in Fetter et al. 1967. Here, an error of 10 mm is reported as tolerable for measuring person’s height, 5 mm for measuring dimension on body and 1 mm for measuring on human face. In this case, the limits refer to when the body measurement is taken directly on the participants without the use of 3D models. Conversely, Ulijaszek and Kerr assessed the acquisition error on 3D models, revealing a tolerance of 3% for smaller measurements (e.g., lengths of limbs and head) and 5% for larger dimensions (e.g., stature). Alternatively, standards, such as ISO 7250-1 establish benchmarks for basic human body measurements in technological design with a tolerable measurement error limit of 5 mm. Similarly, ISO 20685-2:2015, which sets standards for 3D scanning and dimensional measurements on 3D models representing the human body, where a measurement error of 9 mm for long measurements over 10 cm (body height, torso height, limb length) is tolerated, while for small measurements up to 10 cm (wrist width, ankle width, finger length), an error of 1 mm is acceptable.
The aim of this study is three-fold: 1) quantify the accuracy of collecting 10 landmarks on the 3D models representing the human body and compute contributions of each landmark to the total error, 2) explore the effect of demographic factors, such as age and sex, of the participants on the acquisition error, 3) assess the extent of somatic factors (e.g., body type, body size, landmark location, shape and size and influence to measurement of dimensions) on the acquisition error.
The study sample consisted of 60 volunteers, 32 males and 28 females aged from 25 to 76 years (with the average of 47 years) at the time of data acquisition. For males, the average age was 45 years (median = 44 years), while for females, the sample averaged at 49 years (median = 48 years). An analysis of age differences between sexes was performed to assess the sample’s demographic balance, and no statistically significant differences were found across the age categories 20–29, 30–39, 40–49, 50–59, and 60–76 (Chi-squared test, p= 0.06).
All participants were recruited from the CardioVision Brno 2030 project at the International Clinical Research Centre (ICRC), St Anne’s University Hospital in Brno (FNUSA), Czech Republic. The study was approved by the Ethics Committee of St. Anne’s University Hospital in Brno.
Three-dimensional digital body models were obtained using a full-body scanner [TC]². The full-body scanner [TC]² consists of a booth with an entrance covered with a curtain. Inside the booth, there are 16 sensors with a total of 32 cameras, i.e., two cameras per sensor. In order to ensure maximum accuracy, the scanner was calibrated and checked for errors daily. The participants were scanned in uniform underwear in a standing position with their lower limbs apart and upper limbs spread out. The standardized body posture was achieved using marks placed on the floor indicating the position of feet and height-adjustable handles for gripping and setting of the correct position of the hands.
The pointing accuracy of the scanner is less than 6 millimetres, and the circumferential accuracy is less than 1 cm. The density of the grid of points of the scanner is smaller than 2 by 2 millimetres. The density of data per square centimetres is 75 points, and the density of points throughout a scan is from 600 000 up to one million points (www.tc2.com, 2021). The primary output from the scanner is a point cloud representing a three-dimensional body model in Virtual Reality Modelling Language (.wrl) format.
In total, 60 three-dimensional body models were recorded. Final adjustments were carried out in the GOM Inspect and Meshlab program. The primary model in wrl format consisted of 8 separate, unconnected parts (head, torso, both arms, upper parts of both legs, and ankles) with a number of holes present between these parts. The format was first converted to a point cloud (xyz format) in GOM Inspect and then triangulated into a mesh (stl format and finally the obj format) in Meshlab. This ensured that the eight separate parts were connected into one model and all holes were closed properly.
Due to the lower quality of the mesh in the head area, the meshes were manually processed by cutting out the heads with necks in the virtual environment. They were checked for errors (function: Eliminate Mesh Errors) and holes, caused by mesh error (function: Close Holes) and reduced to the final resolution of 45k – 50k vertices.In areas where originally separate parts of the model overlapped, different densities of vertices emerged, therefore, a reorganization of polygons (GOM Inspect) was performed. This achieved a consistent distribution of vertices within the polygonal mesh.
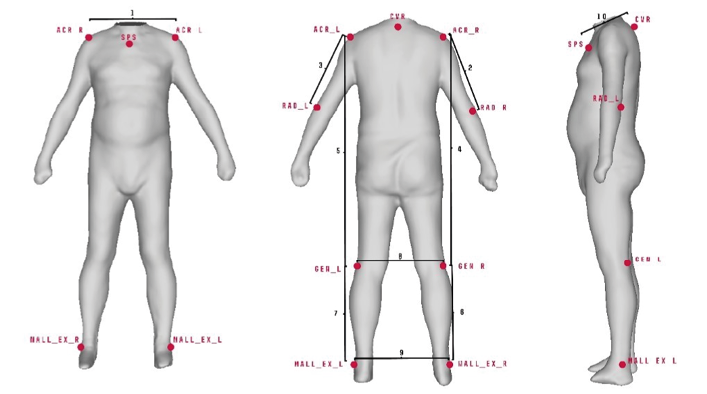
For each model, a set of 10 landmarks (2 unilateral, 8 bilateral) was collected following definitions as described in Table 1 and Figure 1.
| Name | Definition | |
| Acromiale dx | ACR_R | The points located at the superior and external border of the acromion process with the subject standing erect with arms relaxed. |
| Acromiale sn. | ACR_L | |
| Suprasternale | SPS | The point located on the upper edge of the sternum in the mid-sagittal plane. |
| Radiale dx. | RAD_R | The point located at the tip of the elbow. |
| Radiale sn. | RAD_L | |
| Lateral part of the popliteal fossa dx. | GEN_R | The points located on the lateral part of the shallow depression located at the back of the knee. |
| Lateral part of the popliteal fossa sn. | GEN_L | |
| Outer ankle dx. | MALL_EX_R | The points located on the tip of the outer ankle. |
| Outer ankle sn. | MALL_EX_L | |
| Cervicale | CVR | Protrusion of the 7th cervical vertebra. |
Fig. 1. Landmarks: right and left acromiale (ACR_R, ACR_L), suprasternale (SPS), right and left radiale (RAD_R, RAD_L), right and left lateral part of the popliteal fossa (GEN_R, GEN_L), right and left outer ankle (MALL_EX_L, MALL_EX_R and cervicale (CVR). Linear distances between landmarks: ACR_R-ACR_L (1), ACR_R-RAD_R (2), ACR_L-RAD_L (3), ACR_R-GEN_R (4), ACR_L-GEN_L (5), GEN_R-MALL_EX_R (6), GEN_L-MALL_EX_L (7), GEN_R-GEN_L (8), MALL_EX_R-MALL_EX_L (9), CVR-SPS (10)
Landmarks were selected based on several criteria: 1) clear definition with a supposedly high level of repeatability, 2) distribution throughout the entire body, allowing for a comprehensive description of the human body (Simmons and Istook 2003; Atamtürk et al. 2019), and 3) the clarity of the landmark on the model without texture.
The dataset of 10 landmarks was digitized twice for each model. Data digitalisation was conducted with a 14–day interval between the first and second session. Digitalisation error was quantified from the sets of landmark configurations collected repeatedly while the 3D model position remains unchanged. The error was calculated as the difference, i.e., direct distance between the first and second set of digitized landmarks corresponding to each other and obtained on one identical model. In addition, the landmark displacement according to the x, y, and z axes was determined. The x-axis corresponded to the anterior-posterior body direction, the y-axis aligned with the medial-lateral direction, and the z-axis matched the up and down direction.
Normality of data distribution was tested using the Shapiro-Wilk test and a normal probability plot. Descriptive statistics including mean, maximum, minimum, and standard deviation were calculated. Alternatively, the median, maximum, minimum, and quartile range were used for the results when the data distribution did not meet normality requirements.
A digitization error was detected for each landmark and landmark location. To test the effects of the landmark location, the data set was divided into groups according to anatomical location: those located on the 1) torso and 2) limbs, and in concordance with the right and left side of the body (Fig. 1). In addition, individual’s sex, height, body type, body shape, and body size were tested for their influence on data digitalisation. For each 3D model, body type was assessed visually by classifying the 3D model into one of three pre-defined classes. To create categories for body type assessment, BMI was calculated from height and weight of 208 individuals from an independent dataset (archived at the home institution). These individuals were further grouped into three categories, and 3D models representing individuals with the lowest and highest BMI for a given category were used as templates, built separately for men and women (Fig. 2). The pair of templates per category defined the range within which each individual with unknown BMI was assessed. To test repeatability of the approach, intra-observer and interobserver errors were determined. When testing an intra-observer error, only one individual was assigned to a different category. When interobserver error was determined, five individuals were classified differently.
In contrast, body size was described as the volume of a prism calculated from: 1) the height of the individual (cm), measured on the day of the scan at CardioVision (ICRC, FNUSA); 2) the width of the body at the abdomen and hips, defined as the dimension between the two most lateral points in this area (cm), measured on the model; and 3) the anteroposterior dimension at the abdomen, defined as the distance between the most ventral point on the abdomen and the most dorsal point on the back, in a plane parallel to the imaginary ground on which the individual is standing (cm), measured on the model (Fig. 3).
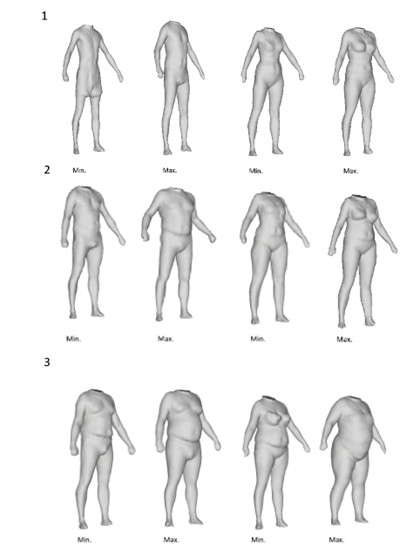
Fig. 2. Model examples representing 3 categories of body types for both males and females: Normal range (1), Overweight (2), Obese (3)
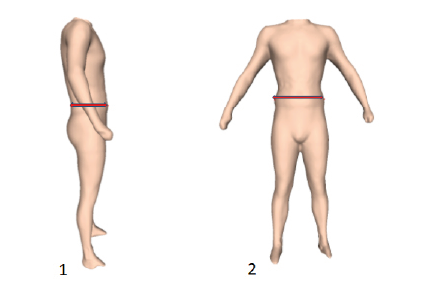
Fig. 3. Two dimensions of body type, the largest anteroposterior dimension of the body in the abdomen (1) and the largest width of the body in the hips (2)
To examine the impact of body shape, the set of landmarks collected at the first session underwent alignment process via Generalized Procrustes Analysis (GPA) while the size standardization was first omitted (i.e., shape and size variables were acquired), and then included (i.e., only shape variables were acquired). Principal component analysis was performed on both registered data sets (size-present, size-invariant), from which the 4 first components were selected and tested against the digitization error.
In addition, the impact of errors on linear inter-landmark distances were explored. A total of 10 linear distances (Fig. 1) were computed for both sets of collected landmarks and absolute differences between the first and the second set were computed. The error of measurements was expressed in terms of mean absolute difference (MAD), median absolute difference (MedAD), and technical error of measurement (TEM).
Effects of the position of landmarks, sex and somatotype based on BMI were tested with the nonparametric Kruskal-Wallis test and median test, and the Mann-Whitney U test. The relationship between the error and quantitative parameters (body height, body size, error of linear measurements, shape and size principal components) was expressed in terms of the non-parametric Spearman’s rank correlation coefficient. Principal component analysis and visual outputs were created in R Studio software using the morpho package (v2.12; Schlager 2017) and geomorph (v3.3.2; Adams et al. 2021).
To test the effect of symmetry, the difference in digitization error between the right and left landmarks at paired points was calculated and tested using the Wilcoxon pairwise test. Difference in symmetry, between the landmarks on right and left side of the body in the digitization error was also tested for its association with shape and size using the Spearman’s rank correlation coefficient.
The errors of the digitized landmarks averaged between 11.88 and 18.65 mm (with medians ranging from 10.21 to 16.41 mm) (Tab. 2). The maximum digitization errors were observed for landmarks located on the neck (CVR), the back of the knee joint (GEN_R, GEN_L), and the upper chest (SPS). Landmarks with the highest variability were those on the upper chest (SPS) and the back of the knee joint (GEN_R, GEN_L). Descriptive statistics of digitization error for landmarks by each anatomical axis in absolute values are displayed in Table 3. Here, displacement in the superior-inferior direction often dominated.
| Landmark | Median | Mean | Minimum | Maximum | SD |
| ACR_R | 11.1 | 13.26 | 0.45 | 36.29 | 8.44 |
| ACR_L | 11.04 | 13.2 | 1.69 | 32.37 | 8.33 |
| SPS | 15.52 | 18.65 | 2.98 | 50.25 | 12.11 |
| CVR | 11.17 | 13.54 | 0.98 | 51.15 | 9.11 |
| RAD_R | 11.89 | 14.23 | 2.38 | 42.7 | 9.05 |
| RAD_L | 11.99 | 14.25 | 3.16 | 39.97 | 8.74 |
| GEN_R | 16.41 | 18.91 | 1.4 | 44.33 | 9.7 |
| GEN_L | 13.44 | 15.90 | 2.27 | 46.18 | 9.50 |
| MALL_EX_R | 10.5 | 12.65 | 1.11 | 50.65 | 8.51 |
| MALL_EX_L | 10.21 | 11.88 | 1.43 | 30.98 | 6.5 |
| Landmark | Axis | Median | Minimum | Maximum | Quartile margin |
| ACR_R | x | 5.90 | 0.19 | 28.05 | 7.70 |
| y | 6.56 | 0.17 | 24.00 | 8.04 | |
| z | 4.83 | 0.01 | 23.41 | 5.69 | |
| ACR_L | x | 5.12 | 0.32 | 26.01 | 7.78 |
| y | 6.59 | 0.02 | 26.32 | 7.99 | |
| z | 4.16 | 0.33 | 19.51 | 7.96 | |
| SPS | x | 6.14 | 0.17 | 24.47 | 10.81 |
| y | 5.95 | 0.04 | 23.16 | 6.46 | |
| z | 11.08 | 1.04 | 39.92 | 15.55 | |
| CVR | x | 4.77 | 0.04 | 28.64 | 4.89 |
| y | 4.86 | 0.41 | 32.98 | 5.54 | |
| z | 6.71 | 0.10 | 36.64 | 5.11 | |
| RAD_R | x | 1.94 | 0.06 | 28.14 | 3.61 |
| y | 6.74 | 0.21 | 33.02 | 9.03 | |
| z | 7.57 | 0.06 | 25.72 | 8.55 | |
| RAD_L | x | 2.45 | 0.03 | 25.85 | 3.92 |
| y | 6.72 | 0.38 | 25.76 | 7.01 | |
| z | 7.46 | 0.06 | 37.52 | 8.26 | |
| GEN_R | x | 6.67 | 0.01 | 28.56 | 7.66 |
| y | 5.44 | 0.19 | 16.90 | 6.24 | |
| z | 12.63 | 0.06 | 40.36 | 17.69 | |
| GEN_L | x | 5.62 | 0.04 | 37.18 | 7.42 |
| y | 4.82 | 0.06 | 22.99 | 5.85 | |
| z | 8.96 | 0.60 | 35.84 | 10.64 | |
| MALL_EX_R | x | 4.05 | 0.12 | 43.48 | 5.07 |
| y | 2.40 | 0.02 | 22.56 | 3.97 | |
| z | 6.68 | 0.38 | 23.39 | 7.96 | |
| MALL_EX_L | x | 4.27 | 0.06 | 23.01 | 6.52 |
| y | 1.76 | 0.07 | 24.21 | 1.83 | |
| z | 7.83 | 0.04 | 24.17 | 9.06 | |
Based on the values of standard deviation, the groups with the largest variations were landmarks on the upper part of the chest (SPS and CVR) and landmarks on the lateral part of the back of the knee (GEN_R and GEN_L). Kruskal-Wallis test showed statistically significant differences between landmark groups (H = 21.94, p = <0.001). For landmarks located on the torso or limbs, Mann-Whitney U Test showed no statistically significant difference (U = 19688, p = 0.15). For landmarks grouped according to the right and left body side, Wilcoxon pairwise test showed significant differences only for the landmarks located at the back of the knee (GEN_L and GEN_R) (T = 61.0, p = 0.02).
The Mann-Whitney U Test showed no statistically significant differences between males and females for any of the tested landmarks. Spearman’s correlation coefficient testing the effect of somatic factors (body height and estimated body size) on digitization error was found to be statistically insignificant for the total data set as well as separately for males and females. Similarly, no correlation was found while testing the error against age.
The Kruskal-Wallis and median tests showed no statistically significant differences between all body type groups, except for the landmark cervicale (Kruskal-Wallis test H = 21.71, p = 0.02) (Tab. 4). In this case, the 3D models of individuals with normal weight produced the largest errors, while the overweight group showed relative consistency in data acquisition.
| Normal weight (N 14) | Overweight (N 25) | Obesity (N 21) | |||||||
| Landmark | Median | Mean | SD | Median | Mean | SD | Median | Mean | SD |
| ACR_R | 12.66 | 13.1 | 8.92 | 9.38 | 12.05 | 6.44 | 12.93 | 14.02 | 6.83 |
| ACR_L | 10.92 | 11.25 | 7.8 | 15.01 | 10.32 | 7.39 | 10.66 | 11.5 | 9.57 |
| SPS | 15.36 | 15.85 | 9.12 | 14.02 | 16.2 | 10.19 | 16.12 | 17.71 | 10.65 |
| CVR* | 16.48 | 17.02 | 10.96 | 9.54 | 10.86 | 9.03 | 13.01 | 14.02 | 7.62 |
| RAD_R | 15.41 | 16.22 | 8.02 | 11.01 | 12.1 | 8.97 | 12.04 | 13.52 | 8.38 |
| RAD_L | 16.42 | 17.12 | 10.44 | 10.59 | 12.5 | 8.33 | 11.4 | 13.1 | 6.44 |
| GEN_R | 19.2 | 20.08 | 9.38 | 16.5 | 18.8 | 10.09 | 18.27 | 20.22 | 9.98 |
| GEN_L | 16.2 | 17.5 | 9.16 | 11.95 | 13.13 | 9.74 | 12.93 | 15.01 | 10.31 |
| MALL_EX_R | 12.28 | 13.38 | 8.92 | 11.13 | 12.44 | 9.01 | 10.48 | 12.82 | 7.43 |
| MALL_EX_L | 13.07 | 13.95 | 7.03 | 10.59 | 12.6 | 7.62 | 9.05 | 10.9 | 7.97 |
Spearman’s correlation coefficient testing the effect of shape, size, and symmetry variables on digitization error was found to be statistically significant for several landmarks. Correlations were observed for the right acromiale point and shape-and-size PC3 associated with subtle arm and leg position and robusticity, and for the left acromiale point together with the left radiale with PC4, which describes arm and leg position. (Fig. 4). Left acromiale and left radiale points revealed a relationship with shape-based PC3 and PC4, which describe the upper and lower body robusticity and the ventrodorsal body dimension respectively.
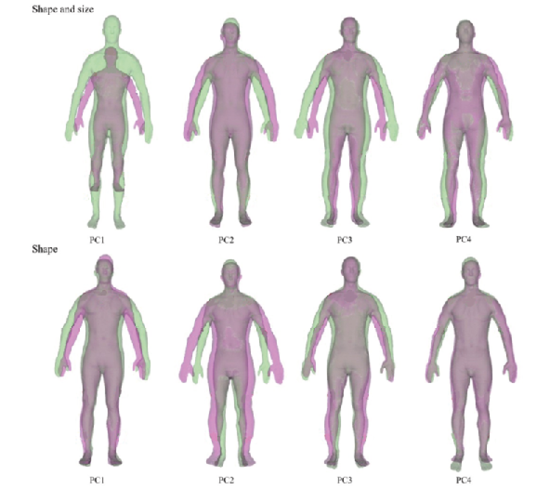
Fig. 4. Description of 4 principal components expressing the most variability for shape and size (green corresponds to positive PC scores, purple corresponds to negative PC scores): PC1 overall size (67.1% variability), PC2 body width and arms position (8.7% variability), PC3 body width knee distance (4.8% variability) and PC4 knee distance (3.5% variability) and for shape: PC1 body position and strength of the upper half of the body (61.3% variability), PC2 body width (10.3% variability), PC3 robusticity of the lower and upper half of the body (5.6% variability) and PC4 anteroposterior body dimension (4.9% variability). Statistically significant correlations between digitalisation errors and principal components for both shape and shape and size are described by landmarks names with positive/negative correlation are market with plus or minus signs
The error of inter-landmark distances computed from the two sets of landmarks is displayed in Table 5. The largest error, regardless of evaluation statistics, was recorded for the right-sided length of the shin (GEN_R-MALL_EX_R), while the smallest was observed for the distance between the right and left ankles (MALL_EX_R-MALL_EX_L). When compared to the landmark error, Spearman’s correlation coefficient showed that the strongest correlation with the absolute error was for the suprasternale point and the upper chest measurement (CVR-SPS) (ρ = 0.85, p = 0.001). This was followed by the knee joint points and their corresponding measurements (GEN_R vs GEN_R-GEN_L: ρ = 0.31, p = 0.011; GEN_L vs GEN_R-GEN_L: ρ = 0.48, p = 0.001; GEN_R vs ACR_R-RAD_R: ρ = 0.62, p = 0.011; GEN_L vs ACR_L-RAD_L: ρ = 0.53, p = 0.001; GEN_R vs GEN_R-MALL_EX_R: ρ = 0.65, p = 0.001; GEN_L vs GEN_L-MALL_EX_L: ρ = 0.24, p = 0.06). However, when considering the described differences, the correlation between the points and the measurements of the upper chest remained significant (ρ = 0.60, p = 0.001), but the lower limb relationships were not present.
| MAD | MedAD | TEM | |
| ACR_R-ACR_L | 10.726 | 9.435 | 9.574 |
| ACR_R-RAD_R | 11.165 | 9.675 | 10.090 |
| ACR_L-RAD_L | 10.690 | 8.430 | 9.950 |
| ACR_R-GEN_R | 14.763 | 11.035 | 13.308 |
| ACR_L-GEN_L | 12.542 | 11.075 | 10.957 |
| GEN_R-MALL_EX_R | 16.681 | 14.220 | 14.701 |
| GEN_L-MALL_EX_L | 11.840 | 9.975 | 10.747 |
| GEN_R-GEN_L | 10.022 | 7.990 | 8.929 |
| MALL_EX_R-MALL_EX_L | 5.316 | 3.215 | 5.750 |
| CVR-SPS | 13.764 | 11.650 | 12.019 |
Selection of variables is a key aspect of any morphological data processing. Typically, this selection process is influenced by field standards, the study’s purpose, as well as traditions and lab protocols passed down through generations of professionals (Fetter 1967; Ben Azous et al. 2006). It is important to stress that most traditional anthropometric landmarks are defined relative to specific locations on the human body, often situated in areas with a solid bony base and minimal overlaying soft tissue. Similarly, it has also been pointed out that landmarks are defined for body dimensions, not locating a position on the body surface (Kouchi, Mochimaru 2011). In addition, these definitions generally pertain to taking linear measurements directly on the human body, assuming that the underlying skeletal structures ensure placement consistency (such as landmarks near joints or bone prominences) (Blaak 2001). However, they do not account for the possibility of collecting a landmark on a 3D model, where immediate feedback regarding the landmark’s position relative to its surroundings is missing. Before selecting the final ten landmarks for further processing, additional landmarks located on the wrists, hips, and back of the pelvis area were considered to ensure more thorough coverage of the entire human body. However, this pilot study revealed that landmarks on the wrists were unsuitable due to poor model quality in that area, and landmarks on the hips and lower back were inaccessible due to participants’ underwear or the observer’s inability to follow the original point definition, which often requires tactile assessment to confirm the location of the landmarks (e.g., iliospinale, trochanterion).
The present study showed that among the ten tested landmarks digitized on a 3D model representing the human body, the upper chest and both landmarks on the back of the knee joint had the highest digitization errors. The error in the chest area is understandable, as the region is relatively flat and lacks geometric characteristics that are easily distinguishable on 3D models. This is in agreement with the Harris and Smith (2009) study, which reported that surface curvatures affected the accuracy of landmark localization – sharper curves facilitate landmark placement, whereas more gradual curvatures tend to make placement more difficult.
In contrast, the large error in the knee joint region is more puzzling. It is worth noting that the major displacement of the knee joint points was observed in the up and down direction. Subsequently, this had a significant effect on the error registered for the length of the shin. Positions of joints are frequently traced manually or automatically on static or dynamic recordings for gait or movement analyses (Ruescas-Nicolau et al. 2024). In these instances, however, the joint is often in various degrees of flexion, which facilitates landmark placement. Similarly, for direct anthropometrics, the measured individual is often asked to facilitate point placement by changing the joint position (della Croce et al. 1999).
In addition to region specificity, significant differences were observed between right and left-sided landmarks. This was also very pronounced in the landmarks of the knee joint. Observer’s handedness is often reported as a source of asymmetry in measurement error studies (Harris and Smith 2009) and was also previously recorded when landmarks were collected using handheld mechanical digitizers (such as MicroScribe) (Urbanová 2009, Urbanová 2011). It remains unclear whether such a bias is translated into the virtual workspace in a similar manner, although computer screens, mice, and other accessories tend to be arranged to accommodate the user’s handedness and side preferences. It is worth noting that Kouchi and Mochimaru (2011) reported no right and left differences when landmarking a real-life subject.
Regarding external factors, our results showed that the digitization error of the analysed landmarks was not affected by the sex of the participants for whom the landmarks were digitized. Neither was the digitization error affected by the body type of the individuals. This indicates that sex-related variations in body size and morphology, particularly in fat distribution (Ruff 2002), had no significant impact on the accuracy of landmark placement for the ten landmarks we considered. This is logical given that none of the tested landmarks are located in regions generally associated with fat tissue deposition, which can cause morphological rounding and decrease landmark accuracy (Bouchard et al. 1990). Of the ten landmarks, only the suprasternale and cervicale points would be the logical choices. Here, the cervicale did indeed showed statistically significant associations with BMI values. However, the observed trend was not straightforward as the largest error was associated with normally weighted individuals, while the most accurately acquired data were from the overweight group.
The literature on acquisition error suggests that for body dimensions, the errors in landmark placement are largely underestimated (Kouchi and Mochimaru 2011). Misplacement of landmarks significantly impacts both body dimensions and shape analysis based on these landmarks (Xi et al. 2007). In addition, most studies have evaluated body dimensions rather than the erroneous placement of landmarks, and the effects of point misplacement have not been considered separately (Aldridge et al. 2005), possibly because landmark placement depends heavily on human judgment. Sometimes there might be a tendency to deny or conceal the impact of the human factor in scientific procedures (Murrie et al. 2019). This leads to the wrongful impression that most landmarks are placed correctly. Meysam et al. (2021) demonstrated that the measurement error was generally smaller compared to the error in the landmarks themselves. This is logical, as the greatest effect on linear measurements comes from landmark misplacement that aligns with the direction of the inter-landmark distance, whereas side deviations of the same magnitude would be less pronounced.
Our results confirm that landmark misplacement was more pronounced than the measurement error associated with inter-landmark distances. In both cases, however, the errors were alarmingly large. While Kouchi and Mochimaru (2011) reported intra-observer errors for the cervicale, suprasternale, acromiale, and radiale points in landmarking a real-life subject in the range of 1.5 to 2.5 mm, and inter-observer errors of 3.3 to 11.5 mm, our study found intra-observer errors far exceeding these values. The lack of geometric details in 3D models, the absence of immediate feedback about the error magnitude, and the absence of texture guiding the landmark placement, can be cited as reasons for these results. Additional training, proper supervision and experience are often recommended to improve proficiency and accuracy in data acquisition. However, in our case, the landmarks were collected by a single, reasonably experienced operator (the first author), who had spent a significant amount of time on landmark selection and adjustment of definitions. We believe that it is important not to shy away from these results, as errors of 3D body landmarks have reported scarcely and can significantly alter the outcomes of 3D scan-based analyses.
Lately, automated landmark detection algorithms have been on the rise owing to the computational capabilities of machine learning algorithms, particularly the neural networks (Ruescas-Nicolau et al. 2024). While a deep insight into these approaches is beyond the scope of this study, it is important to stress that they may be the key to improving the accuracy of manually collected landmarks. Generally, there are two types of techniques: landmark-based and template-based (Kaashki et al. 2021). The major drawbacks of these approaches are that they require a large training dataset if based on state-of-the-art machine learning algorithms, and they are often incompatible with traditional anatomical or anthropometric points (Ruescas-Nicolau et al. 2024).
Our results indicate that digitizing landmarks to a 3D model representing the human body has its pitfalls. When digitizing landmarks, it is necessary to pay attention to the proper methodology of digitization so that the already high error does not increase. It is also important to select landmarks according to their location, so that a compromise between their digitization error and the requirement of the analysis is achieved.
Ethics Approval
The study was approved by the Ethics Committee of St. Anne’s University Hospital in Brno 2 (reference number 2G/2012).
Acknowledgements
The authors would like to thank all participants who agreed to be a part of the data collection. We extend our gratitude to the CardioVision Brno 2030 at the International Clinical Research Centre (ICRC), St Anne’s University Hospital in Brno (FNUSA), Czech Republic whose willingness and collaboration made the data acquisition possible. This publication was written at Masaryk university as part of the project numbers MUNI/A/1434/2022 and MUNI/A/1597/2023 with the support of the Specific University Research Grant, as provided by the Ministry of Education, Youth and Sports of the Czech Republic in the years 2022 and 2023.
Conflict of interests
The authors declare no potential conflicts of interest regarding the research, authorship, or publication of this article.
Author’s contribution
DČ – data collection, data processing, methodology design, and manuscript drafting; PU – methodology design and manuscript drafting.
Adams DC, Collyer ML, Kaliontzopoulou A, Baken E. 2021. Geomorph: Software for geometric morphometric analyses. R package version 3.3.2. Available at: https://cran.r-project.org/package=geomorph
Aldridge K, Boyadjiev SA, Capone GT, DeLeon VB, Richtsmeier JT. 2005, Precision and error of three-dimensional phenotypic measures acquired from 3dMD photogrammetric images. Am J Med Genet 138A:247–253. https://doi.org/10.1002/ajmg.a.30959
Arnqvist G, Mårtensson T. 1998. Measurement error in geometric morphometrics: empirical strategies to assess and reduce its impact on measures of shape. Acta Zool Acad Sci Hung 44:73–96.
Atamtürk D, Pelin C, Duyar İ. 2019. Estimation of sex from scapular measurements: use of the bone area as a criterion. Euras J Anthropol 10(1):39–45.
Ben Azouz Z, Rioux M, Shu C. 2006. Characterizing human shape variation using 3D anthropometric data. Visual Comput 22:302–314. https://doi.org/10.1007/s00371-006-0006-6
Benfer RA. 1975. Morphometric analysis of Cartesian coordinates of the human skull. Am J Phys Anthropol 42:371–382. https://doi.org/10.1002/ajpa.1330420305
Blaak E. 2001. Gender differences in fat metabolism. Current Opinion in Clinical Nutrition & Metabolic Care 4(6):499–502.
Bromiley PA, Schunke AC, Ragheb H. 2014. Semi-automatic landmark point annotation for geometric morphometrics. Front Zool 11:61. https://doi.org/10.1186/s12983-014-0061-1
Bookstein FL. 1991. Morphometric Tools for Landmark Data Geometric and Biology. Cambrige University, Cambrige.
Bouchard TJ, Lykken DT, McGue M, Segal NL, Tellegen A. 1990. Sources of human psychological differences: The Minnesota study of twins reared apart. Science 250(4978): 223–228.
Caple J, Stephan CN. 2016. A standardized nomenclature for craniofacial and facial anthropometry. Int J Legal Med 130(3):863–879. https://doi.org/10.1007/s00414-015-1292-1
Charlier P, Froesch P, Huynh-Charlier I. 2014. Use of 3D surface scanning to match facial shapes against altered exhumed remains in a context of forensic individual identification. Forensic Sci Med Pathol 10:654–661. https://doi.org/10.1007/s12024-014-9618-8
Chen SYY, Lestrel PE, Kerr JWS, McColl JH. 2002. Describing shape changes in the human mandible using elliptical Fourier functions. Eur J Orthodont 22(3):205–216. https://doi.org/10.1093/ejo/22.3.205
Craik K, Collings AJ. 2022. A preliminary study into the impact of using three-dimensional models in forensic anthropology learning and teaching. Science & Justice. https://doi.org/10.1016/j.scijus.2022.04.006
von Cramon-Taubadel N, Frazier BC, Lahr MM. 2007. The problem of assessing landmark error in geometric morphometrics: Theory, methods, and modifications. Am J Phys Anthropol 134:24–35. https://doi.org/10.1002/ajpa.20616
Čuta M, Jurda M, Kováčová V, Jandová M, Bezděková V, Černý D, Urbanová P. 2024. Virtual fit and design improvements of a filtering half-mask for sub-adult wearers. Ergonomics. https://10.1080/00140139.2023.2298984
Daanen HAM, Ter Haar FB. 2013. 3D whole body scanners revisited. Displays 34(4):270–275.
Daboul A, Ivanovska T, Bülow R, Biffar R, Cardini A. 2018. Procrustes-based geometric morphometrics on MRI images: An example of inter-operator bias in 3D landmarks and its impact on big datasets. PLOS ONE 13(5):e0197675. https://doi.org/10.1371/journal.pone.019767
della Croce U, Cappozzo A, Kerrigan DC. 1999. Pelvis and lower limb anatomical landmark calibration precision and its propagation to bone geometry and joint angles. Med Biol Eng Comput 7(2):155–61. https://doi.org/10.1007/BF02513282 PMID: 10396818.
Devarajan P, Istook CL 2004. Validation of female figure identification technique (FFIT) for apparel software. J Text Appar Technol Manag 4(1):1–23.
Ferrario VF, Sforza C, Ciusa V, Dellavia C, Tartaglia GM. 2001. The effect of sex and age on facial asymmetry in healthy subjects: A cross-sectional study from adolescence to mid-adulthood. J Oral Maxillofac Surg 59(4):382–8. https://doi.org/10.1053/joms.2001.21872
Fetter V, Prokopec M, Suchý J, Titlebachová S. 1967. Antropologie. Praha: Academia.
Fourie Z, Damstra J, Gerrits PO, Ren Y. 2011. Evaluation of anthropometric accuracy and reliability using different three-dimensional scanning systems. Forensic Sci Int 207(1–3):127–134. https://doi.org/10.1016/j.forsciint.2010.09.018
Gibelli D, Palamenghi A, Poppa P, Sforza C, Cattaneo C, De Angelis, D. 2022. 3D-3D facial registration method applied to personal identification: Does it work with limited portions of faces? An experiment in ideal conditions. J Forensic Sci 00:1–7. https://doi.org/10.1111/1556-4029.15021
Hara R, McGinley J, Briggs C. 2016. Predicting the location of the hip joint centres, impact of age group and sex. Sci Rep 6:37707. https://doi.org/10.1038/srep37707
Harris EF, Smith RN 2009. Accounting for measurement error: a critical but often overlooked process. Arch Oral Biol 54 (Suppl 1:S)107–117. https://doi.org/10.1016/j.archoralbio.2008.04.010
Jones PRM, Rioux M. 1997. Three-dimensional surface anthropometry: Applications to the human body. Optics and Lasers in Engineering 28(2):89–117.
Jurda M, Urbanová P, Chmelík J. 2019. Digital restoration of fragmentary human skeletal remains: Testing the feasibility of virtual reality. J Forensic Leg Med 66:50–57. https://doi.org/10.1016/j.jflm.2019.06.005
Katina S, McNeil K, Ayoub A, Guilfoyle B, Khambay B, Siebert P, et al. 2016. The definitions of three-dimensional landmarks on the human face: an interdisciplinary view. J Anat 228:355–365. https://doi.org/10.1111/joa.12407
Kaashki NN, Hu P. Munteanu, A. 2023. Anet: A Deep Neural Network for Automatic 3D Anthropometric Measurement Extraction. IEEE Transactions on Multimedia 25:831–844. https://doi.org/10.1109/TMM.2021.3132487
Kouchi M, Mochimaru M. 2011. Errors in landmarking and the evaluation of the accuracy of traditional and 3D anthropometry. Appl Ergon 42(3):518–527. https://doi.org/10.1016/j.apergo.2010.09.011
Kullmer O. 2008. Benefits and risks in virtual anthropology. J Anthropol Sci 86:205–207.
Madadi M, Bertiche H, Escalera S. 2021. Deep Unsupervised 3D Human Body Reconstruction from a Sparse set of Landmarks. International Journal of Computer Vision. https://doi.org/10.1007/S11263-021-01488-2
Muehlenbein MP. 2010. Commentary: a Primer on Human Subjects Applications and Informed Consents. Human Evolutionary Biology 150.
Murrie DC, Gardner BO, Kelley S, Dror IE. 2019. Perceptions and estimates of error rates in forensic science: A survey of forensic analysts. Forensic Sci Int 302:109887. https://doi.org/10.1016/j.forsciint.2019.109887
Navarro P, Ramallo V, Cintas C, Ruderman A, de Azevedo S, Paschetta C, et al. 2020. Body shape: Implications in the study of obesity and related traits. Am J Hum Biol 32(2):e23323. https://doi.org/10.1002/ajhb.23323
Ross A, Williams S. 2008. Testing Repeatability and Error of Coordinate Landmark Data Acquired from Crania. J Forensic Sci 53:782–785. https://doi.org/10.1111/j.1556-4029.2008.00751.x
Ruescas-Nicolau AV, De Rosario H, Bernabé EP, Juan MC. 2024. Positioning errors of anatomical landmarks identified by fixed vertices in homologous meshes. Gait & Posture 108:215–221.
Ruff C. 2002. Variation in human body size and shape. Annual Review of Anthropology 31:211–232. https://doi.org/10.1146/annurev.anthro.31.040402.085407
Ryan-Stewart H, Faulkner J, Jobson S. 2022. The Impact of Technical Error of Measurement on Somatotype Categorization. Applied Sciences 12(6):3056. https://doi.org/10.3390/app12063056
Schlager S. 2017. Morpho and Rvcg – Shape Analysis in R. In: Zheng G, Li S, Szekely G (eds.). Statistical Shape and Deformation Analysis 217–256. Academic Press. ISBN 9780128104934.
Sforza C, Ferrario VF. 2006. Soft-tissue facial anthropometry in three dimensions: from anatomical landmarks to digital morphology in research, clinics and forensic anthropology. J Anthropol Sci 84:97–124.
Simmons K, Istook C. 2003. Body measurement techniques: Comparing 3D body-scanning and anthropometric methods for apparel applications. J Fash Mark Manag 7:306–332. https://doi.org/10.1108/13612020310484852
Slice DE. 1996. Three-dimensional, generalized resistant fitting and the comparison of least-squares and resistant-fit residuals. Advances in Morphometrics. pp. 179–199. New York: Plenum Press.
Sukno FM, Waddington JL, Whelan Paul F. 2015. 203d facial landmark localization with asymmetry patterns and shape regression from incomplete local features. IEEE Trans Cybernet 45:1717–1730. https://doi.org/10.1109/tcyb.2014.2359056
Ulijaszek SJ, Kerr DA. 1999. Anthropometric measurement error and the assessment of nutritional status. Br J Nutr 82(3):165–177. https://doi.org/10.1017/s0007114599001348
Utermohle CJ, Zegura SL. 1982. Intra- and interobserver error in craniometry: A cautionary tale. Am J Phys Anthropol 57:303–310.
Urbanová P. 2009. Variation of the Orbital Rim Using Elliptic Fourier Analysis. https://doi.org/10.1142/9789814355247_0013
Urbanová P. 2011. Variation of the Orbital Rim by using the Elliptic Fourier Analysis. In Pete E. Lestrel. BIOLOGICAL SHAPE ANALYSIS Proceedings of the 1st International Symposium Tsukuba. Singapore: World Scientific. pp. 221–241. ISBN 978-981-4355-23-0. https://dx.doi.org/10.1142/9789814355247_0013
Urbanová P. 2016. Performance of distance-based matching algorithms in 3D facial identification. Egyptian Journal of Forensic Sciences 6(2):135–151. https://doi.org/10.1016/j.ejfs.2016.04.004
Urbanová P, Ferková, Z, Jandová M, Jurda M, Černý D, Sochor J. 2018. Introducing the FIDENTIS 3DFace Database. Anthropol Rev 81(2):202–223.
Xi P, Lee WS, Shu C. 2007. Analysis of segmented human body scans. Proceedings of Graphics Interface 2007. pp. 19–26.
Zelditch M, Swiderski D, Sheets HD. 2012. Geometric morphometrics for biologists: a primer. Academic Press.
ISO 20685-1:2018: 3-D scanning methodologies for internationally compatible anthropometric databases — Part 1: Evaluation protocol for body dimensions extracted from 3-D body scans.
ISO 20685-2:2015 Ergonomics — 3-D scanning methodologies for internationally compatible anthropometric databases — Part 2: Evaluation protocol of surface shape and repeatability of relative landmark positions
ISO 7250-1:2017 Basic human body measurements for technological design Part 1: Body measurement definitions and landmarks
[TC]2 Labs, 2016 [online] https://www.tc2.com/tc2-19b-3d-body-scanner.html (20.08.2021)

