Available online at: https://doi.org/10.18778/1898-6773.87.4.05
 https://orcid.org/0000-0002-4452-7010
Biological Anthropology Unit, Indian Statistical Institute, Kolkata, India
Biological Anthropology Unit, Indian Statistical Institute, Kolkata, India
https://orcid.org/0000-0001-8435-8779
Department of Anthropology and Tribal Studies, Maharaja Sriram Chandra Bhanja Deo University, Baripada, Odisha, India
https://orcid.org/0000-0002-6502-8333
Department of Anthropology, University of Calcutta, Kolkata, India
ABSTRACT: The perception of pain, encompassing pain threshold and tolerance levels, is a complex phenomenon influenced by biological, psychological, and sociocultural factors. Notably, age and sex have consistently emerged as pivotal determinants in modulating pain perception. The study aimed to examine age and sex differences in pain threshold and tolerance levels. Furthermore, it delved into exploring whether age-related differences in pain threshold and tolerance levels vary between males and females. This study incorporated 484 healthy Santal tribal individuals aged 18–88 years (male 203 and female 281) living in Howrah and Purba Bardhaman Districts of West Bengal State, India, who reported no chronic or significant pain at the time of data collection. Pain threshold and tolerance levels were assessed using a digital algometer. Results of two-way ANOVA revealed significant main effects of age and sex on every pain threshold and tolerance level assessed in this study, indicating that older individuals had lower pain threshold and tolerance levels than younger ones. Males demonstrated greater levels of pain threshold and tolerance relative to females. Age and sex showed a significant interaction effect on pain tolerance levels, but not on pain threshold levels demonstrating the age-associated declining trend in pain threshold levels was consistent for either sex; however, such a tendency in pain tolerance levels was more pronounced in men. These findings highlight the importance of considering age and sex factors when assessing pain perception.
KEY WORDS: pain threshold, pain tolerance, age, sex, interaction effect
In 2020, the International Association for the Study of Pain (IASP) revised the definition of pain to describe it as ‘an unpleasant sensory and emotional experience associated with, or resembling that associated with, actual or potential tissue damage’ (Stevens 2021). Pain is one of the vital signs that signal the body about potential threats. Pain presents a dual nature, providing the body with protection (Belfer 2013), while also engendering discomfort, interfering with daily activities, and potentially leading to dependency and institutionalization in severe cases (Yağci et al. 2014). These facets underscore the multidimensional nature of pain. Prompt responses to pain not only safeguard the body against further damage but also contribute to sustaining a healthy existence (Lorusso et al. 2018). Therefore, the perception of pain emerges as a crucial aspect for human survival and overall well-being (Swift 2018).
Pain perception, encompassing pain threshold and tolerance levels, along with the management of pain, represent foundational aspects of human well-being and healthcare (DiMatteo and Martin 2002). The minimal stimulus required to elicit a painful sensation is denoted as the pain threshold (Schmitz et al. 2013), while the maximum amount of pain an individual can endure is defined as the pain tolerance (Cimpean and David 2019). Gaining insights into the factors that influence an individual’s pain threshold and tolerance is of paramount importance for devising successful approaches to pain management (Roy et al. 2013).
Pain perception is a multifaceted phenomenon influenced by a myriad of biological, psychological, and sociocultural factors (Bartley and Fillingim 2013; Shipton 2013; Ferreira et al. 2015). Among these, age has consistently emerged as a critical factor in shaping an individual’s response to pain (Yezierski 2012). Generally, age-related changes in the nervous system, such as alterations in nerve conduction velocity and decreased pain modulation, have been proposed as contributors to variations in pain sensitivity across the lifespan (Yezierski 2012). While it is recognized that older individuals might experience reduced pain, comprehending exactly how age affects pain thresholds and tolerance remains significant in this context. For example, the frequent absence of pain in older patients with conditions like myocardial infarction or peptic ulcer disease suggests potential alterations in pain thresholds (Moore and Clinch 2004). Despite these observations, the older adults reported experiencing frequent pain. Chronic pain becomes more prevalent as individuals age (Domenichiello and Ramsden 2019), affecting more than half of older adults residing in the community (Gibson 2003). This incident emphasizes the complex nature of age-related changes in pain. Moreover, the findings of the previous experimental studies on age-associated changes in pain threshold and tolerance are inconsistent and equivocal (Pickering et al. 2002; Lautenbacher et al. 2005; Cole et al. 2010; Petrini et al. 2015). For that reason, the precise nature and extent of these age-related alterations and their relevance for pain management remain areas of active investigation.
Sex, too, has been implicated in the modulation of pain perception. Similar to age, investigations into sex-related differences in pain sensitivity have yielded a multitude of diverse findings (Racine et al. 2012). Several experimental investigations have documented variations in pain sensitivity across sexes (Pelfort et al. 2015; Cámara et al. 2020), suggesting that hormonal, genetic, and psychosocial factors may contribute to these disparities (El Tumi and Tashani 2017). However, it is well documented that females tend to report a higher prevalence and intensity of pain compared to males (Lue et al. 2018; Overstreet et al. 2023). This sex-related variation in pain perception has prompted intriguing arguments over whether they are biologically determined versus socially constructed and if they should inform gender-specific approaches to pain management (Gazerani et al. 2021).
The exploration of age- and sex-related differences in pain perception has garnered significant research attention, with numerous attempts to elucidate these complexities. However, whether age-related alterations in pain perception vary between males and females remains largely unexplored. Females undergo pronounced hormonal fluctuations across their life span, with hormonal levels rising and falling cyclically during the menstrual cycle. These fluctuations have been associated with varying levels of pain sensitivity (Fillingim et al. 1997). Additionally, the occurrence of menopause in females leads to a substantial reduction in estrogen levels, with a lesser impact on progesterone levels (Burger et al. 2007). Notably, research has shown that estrogen has analgesic properties, and the increased pain sensitivity during menopause is linked to a drop in estrogen levels (Nikolov and Petkova 2010). Consequently, because of this increased pain sensitivity, women may be more susceptible to conditions like chronic pain, headaches, and joint pain (Meriggiola et al. 2012). In contrast, males do not experience analogous fluctuations in their primary sex hormone, testosterone, throughout different life stages, which is considered to play an anti-nociceptive role (Vincent and Tracey 2008). Besides, a recent study uncovered variations in age-related alterations in the endogenous opioid system across genders. Specifically, females demonstrated a decline in the functionality of the descending pain modulatory system (a network of neural pathways in the central nervous system that regulates pain perception), while males exhibited an upward trend in the activity of this system (Failla et al. 2024). Therefore, it is plausible to anticipate that age-related changes in pain threshold and tolerance levels may not exhibit a uniform pattern between males and females.
In India, there is a scarcity of research among the tribal communities concerning pain sensitivity and its associated factors, specifically age and sex. Moreover, the distinction between males and females extends beyond biological factors to include social and cultural dimensions. The term “tribe” typically refers to an ethnic group that is geographically isolated or semi-isolated, associated with a specific territory, and characterized by unique social, economic, and cultural traditions and practices (Singh and Singh 2017). Tribal communities in India exhibit distinct cultural characteristics, setting them apart from the rest of the general population (Boro and Saikia 2020). It remains unknown how these two factors influence their pain threshold and tolerance levels. Given the clinical relevance of age and sex as potential modifiers of pain perception, the present study intended to determine whether there exists any difference in the pain threshold and tolerance level across different age groups and between two sexes belonging to the Santal tribal community. Furthermore, the investigation aimed to determine whether the age-associated difference in pain threshold and tolerance levels exhibits variations between males and females. In other words, the study investigated the main effects as well as the interaction effects of age and sex among the Santal tribal people residing in West Bengal, India.
The data utilized in this study were derived from a large community-based study centered on exploring different aspects of pain, such as pain sensitivity, musculoskeletal pain-related cognitions, and treatment-seeking behavior for musculoskeletal pain (Santra et al. 2024). Participants were recruited from the Santal tribal community residing in two districts, namely Howrah and Purba Bardhaman, within the state of West Bengal, India. Within each district, settlements of Santals were chosen based on their higher population density or numerical representation in the area. The selection of study participants from such eight settlements followed a two-step process. In the first step, a demographic survey was conducted through door-to-door visits, during which socio-demographic information of all adult household members was collected. When an adult member was absent during this survey, the head of the household or any senior member of the same household provided the details. While collecting the details, the objectives and purpose of the study were explained to every household head and adult individual in the households, and verbal consent was obtained. This step covered 343 households and identified 1155 eligible participants (546 males and 609 females) who were aged 18–88 years and permanent residents of the selected areas. In the second step, the collection of all the required data began after compiling a comprehensive list of eligible participants. Prior to assessing pain threshold and tolerance, the procedure of testing with the instrument was clearly demonstrated to every individual we approached, and written consent was obtained. At this phase of data collection, 390 individuals were unavailable, and 67 individuals withdrew their participation. 685 individuals agreed to participate in the study and completed the survey, providing the required data. They also consented to the measurement of pain threshold and tolerance levels. However, for the purpose of the present study, we fixed some inclusion criteria: (1) currently experiencing no pain; (2) free from chronic illnesses like diabetes, hypertension, chronic pain, etc.; and (3) no disability or existing injury in the body at the time of the survey. Following these criteria, 13 individuals were eliminated for having an injury or disability. Further, to maintain homogeneity, we dropped 201 individuals with any known chronic conditions or who were afflicted with pain during the time of the survey. Eventually, a total of 484 individuals, including 203 males and 281 females, were incorporated into the present study.
Socio-demographic data that included participants’ present age (in years), sex (categories: male and female), educational attainment, marital status (categories: unmarried, married, and widowed/separated/divorced), working status (categories: working and non-working), household characteristics (e.g., house type, toilet facilities, and other related factors), and possession of household assets (e.g., television, refrigerator, car, and other similar aspects) (IIPS and ICF 2017) were obtained using a structured questionnaire. Age was further subdivided into three age groups viz. young (18–34 years), middle-aged (35–49 years), and old (50 years and older) based on an adaptation of a prior study that utilized finer age categories (e.g., 18–34, 35–49, 50–64, 65–74, and 75 and older) (Elgaddal et al. 2024). However, in the present study, the sample sizes in the older age groups were relatively small, particularly in individuals aged 65 years and above. To ensure sufficient sample sizes within each group and maintain statistical power for the analyses, the age categories were consolidated into three broader groups. Education level was further categorized into five levels: having no formal education, primary (had education between classes 1–4), secondary (had education between classes 5 and 10), higher secondary (had education between classes 11 and 12), and graduation and above (had education up to graduation level and beyond). Following the Demographic and Health Surveys (the DHS program), a wealth index was constructed for each participant based on their respective household assets and characteristics using a principal component analysis with varimax rotation (Rutstein 2008). The first principal component (PC) (eigenvalue > 1), which was able to explain the largest proportion of the total variance (33.22%), was taken to represent the wealth index. Further, the factor scores of the first PC were divided into three equal segments. Participants scoring below the 33rd percentile were categorized in the lower stratum; those scoring between the 34th and 66th percentile were placed in the middle stratum; and those scoring above the 66th percentile were assigned to the upper stratum of socioeconomic class.
A digital pressure algometer (Model: ALGO-DS, Orchid Scientific, India) was used to measure the pain threshold and tolerance levels of the participants. The instrument has a 1 cm2 rounded, blunt metal tip. Pain threshold levels were assessed on eight muscles bilaterally, including the right extensor carpi radialis, right biceps brachii, right triceps brachii, right upper trapezius, left extensor carpi radialis, left biceps brachii, left triceps brachii, and left upper trapezius muscles (Walton et al. 2011; Duan et al. 2014; Georgoudis et al. 2014). The participants were asked to sit comfortably on a chair with a straight back and relaxed arms, and the instrument was placed perpendicularly with its tip on the muscle points. After holding the instrument properly, pressure was gradually increased at a constant rate. They were asked to say ‘stop’ or ‘pain’ when they sensed the applied pressure as painful for the first time. The instrument was removed immediately from the muscle point, and the value (in kg) was recorded as the pain threshold level. The same protocol was followed for every threshold measurement. The pain tolerance level was measured at only one muscle point (flexor carpi radialis) on the right forearm. While measuring it, the participants were asked to report ‘stop’ or ‘pain’ when they were no longer able to withstand the pain, and the value was (in kg) taken as their pain tolerance level. Every measurement was taken with an interval of approximately two minutes.
SPSS version 24.0 (IBM Corporation, Armonk, NY, USA) was utilized for statistical analyses. Descriptive statistics (frequency and percentage, and mean and standard deviation) were employed to summarize the socio-demographic and pain threshold and tolerance data. 𝜒2 test was performed to compare categorical variables. Two-way ANOVA was implemented to evaluate both the main effects and interaction effects of age and sex on every pain threshold and tolerance level, considering age and sex as independent variables and the pain measurements as dependent variables. Further, post hoc pairwise comparisons with Bonferroni adjustments were performed to compare the mean difference across groups upon receiving significant main effects or interaction effects. Partial Eta squared values (denoted as η2) represent the effect size, i.e., the magnitude of variability in dependent variables explained by independent variability. Partial η2 values of 0.01, 0.06, and 0.14 indicate low, medium, and large effects, respectively (Cohen 1988). A p value of ≤0.05 was considered statistically significant.
Table 1 shows the socio-demographic characteristics of the study participants. A significantly higher proportion of female participants belonged to the “middle-aged” group, whereas the distribution of males across the three age categories was quite similar. The majority of the participants were married, but the frequency of widowed/separated/divorced individuals was found to be considerably greater in females. Notably, a significant difference existed in educational attainment between the sexes, with nearly 30% of the males having completed their education up to the graduation level or above, while a substantial number of females lacked formal education. Regarding working status, although over half of the males and females were working, a significantly greater number of males were found to be employed when compared with the females. No significant difference was noted in the distribution of participants based on their respective wealth indexes.
| Characteristics | Male | Female | 𝜒2 value (p value) |
| n (%) | n (%) | ||
| Age groups | |||
| Young (18–34 years) | 66 (32.51) | 98 (34.88) | 6.18 (0.05) |
| Middle-aged (35–49 years) | 66 (32.51) | 113 (40.21) | |
| Old (50 years and older) | 71 (34.98) | 70 (24.91) | |
| Marital status | |||
| Unmarried | 41 (20.20) | 26 (9.25) | 29.03 (<0.001) |
| Married | 158 (77.83) | 216 (76.87) | |
| Widowed/Separated/Divorced | 4 (1.97) | 39 (13.88) | |
| Educational attainment | |||
| No formal education | 36 (17.73) | 99 (35.23) | 25.44 (<0.001) |
| Primary | 26 (12.81) | 29 (10.32) | |
| Secondary | 50 (24.63) | 78 (27.76) | |
| Higher secondary | 34 (16.75) | 30 (10.68) | |
| Graduation and above | 57 (28.08) | 45 (16.01) | |
| Working status | |||
| Non-working | 59 (29.06) | 125 (44.48) | 11.89 (<0.001) |
| Working | 144 (70.94) | 156 (55.52) | |
| Wealth index | |||
| Lower | 67 (33.00) | 104 (37.01) | 0.88 (0.65) |
| Middle | 69 (33.99) | 92 (32.74) | |
| Upper | 67 (33.00) | 85 (30.25) | |
The descriptive statistics of pain threshold and tolerance levels measured on different muscle points of the body are presented in Table 2. It shows that males had relatively higher mean values for every threshold and tolerance level than those of the females.
| Muscle points | Male | Female |
| Mean (SD) | Mean (SD) | |
| For pain threshold (kg) | ||
| Right extensor carpi radialis | 3.62 (1.22) | 2.73 (0.88) |
| Right biceps brachii | 3.17 (1.10) | 2.47 (0.88) |
| Right triceps brachii | 3.87 (1.33) | 2.79 (0.91) |
| Right upper trapezius | 3.84 (1.44) | 2.90 (0.91) |
| Left extensor carpi radialis | 3.40 (1.34) | 2.61 (0.82) |
| Left biceps brachii | 3.08 (1.12) | 2.52 (0.86) |
| Left triceps brachii | 3.57 (1.32) | 2.65 (0.87) |
| Left upper trapezius | 3.68 (1.52) | 2.80 (0.89) |
| For pain tolerance (kg) | ||
| Right flexor carpi radialis | 9.67 (3.22) | 7.10 (1.81) |
The age group-wise distribution of pain threshold and tolerance values is portrayed in Table 3. Both the pain threshold and tolerance values show inconsistent values across all age groups.
| Muscle points | Young | Middle-aged | Old |
| Mean (SD) | Mean (SD) | Mean (SD) | |
| For pain threshold (kg) | |||
| Right extensor carpi radialis | 3.07 (1.12) | 3.19 (1.15) | 3.02 (1.09) |
| Right biceps brachii | 2.79 (0.99) | 2.86 (1.12) | 2.62 (0.97) |
| Right triceps brachii | 3.19 (1.17) | 3.35 (1.27) | 3.17 (1.22) |
| Right upper trapezius | 3.13 (1.01) | 3.43 (1.28) | 3.30 (1.44) |
| Left extensor carpi radialis | 2.93 (1.10) | 3.00 (1.26) | 2.88 (1.02) |
| Left biceps brachii | 2.80 (1.02) | 2.81 (1.03) | 2.63 (0.98) |
| Left triceps brachii | 3.05 (1.16) | 3.11 (1.25) | 2.94 (1.08) |
| Left upper trapezius | 3.03 (1.04) | 3.28 (1.32) | 3.19 (1.44) |
| For pain tolerance (kg) | |||
| Right flexor carpi radialis | 8.75 (2.96) | 8.36 (2.92) | 7.28 (2.18) |
The results of two-way ANOVA are shown in Table 4. It is observed that except for two values taken on the left extensor carpi radialis and left upper trapezius muscle points, age had a significant main effect on all the pain threshold levels measured on the right extensor carpi radialis, right biceps brachii, right triceps brachii, right upper trapezius, left biceps brachii, and left triceps brachii muscle points. However, the partial η2 values exhibited a small effect of age on pain threshold levels. In the case of pain tolerance level, age also exhibited a significant main effect with a medium effect size. Regarding the main effects of sex, at every threshold and tolerance level, sex was found to have a significant main effect. Here, partial η2 indicated a medium-to-high effect of sex. Furthermore, the table indicates that there was a significant interaction effect of age and sex on the given pain tolerance level but not on any of the pain threshold levels. Overall, the findings suggest that males had significantly higher pain threshold and tolerance levels compared to females; pain tolerance as well as the majority of the pain threshold values considered in this study differed across the age groups; and the age-related changes in the pain tolerance levels varied between the sexes.
| Source | Muscle points | Type III sum of squares | df | F | pvalue | Partial η2 |
| Main effect of age | For pain threshold | |||||
| Right extensor carpi radialis | 6.30 | 2 | 2.96 | 0.05 | 0.01 | |
| Right biceps brachii | 9.08 | 2 | 4.79 | 0.01 | 0.02 | |
| Right triceps brachii | 8.17 | 2 | 3.38 | 0.03 | 0.01 | |
| Right upper trapezius | 10.56 | 2 | 3.97 | 0.02 | 0.02 | |
| Left extensor carpi radialis | 3.83 | 2 | 1.68 | 0.19 | 0.01 | |
| Left biceps brachii | 6.08 | 2 | 3.20 | 0.04 | 0.01 | |
| Left triceps brachii | 7.04 | 2 | 3.02 | 0.05 | 0.01 | |
| Left upper trapezius | 7.92 | 2 | 2.79 | 0.06 | 0.01 | |
| For pain tolerance | ||||||
| Right flexor carpi radialis | 277.61 | 2 | 25.08 | <0.001 | 0.09 | |
| Main effect of sex | For pain threshold | |||||
| Right extensor carpi radialis | 96.92 | 1 | 91.15 | <0.001 | 0.16 | |
| Right biceps brachii | 61.43 | 1 | 64.90 | <0.001 | 0.12 | |
| Right triceps brachii | 143.02 | 1 | 118.26 | <0.001 | 0.20 | |
| Right upper trapezius | 108.38 | 1 | 81.56 | <0.001 | 0.15 | |
| Left extensor carpi radialis | 74.78 | 1 | 65.46 | <0.001 | 0.12 | |
| Left biceps brachii | 38.53 | 1 | 40.56 | <0.001 | 0.08 | |
| Left triceps brachii | 104.64 | 1 | 89.86 | <0.001 | 0.16 | |
| Left upper trapezius | 94.94 | 1 | 66.74 | <0.001 | 0.12 | |
| For pain tolerance | ||||||
| Right flexor carpi radialis | 821.57 | 1 | 148.45 | <0.001 | 0.24 | |
| Interaction effects of age and sex | For pain threshold | |||||
| Right extensor carpi radialis | 0.44 | 2 | 0.21 | 0.81 | 0.00 | |
| Right biceps brachii | 1.15 | 2 | 0.61 | 0.55 | 0.00 | |
| Right triceps brachii | 0.00 | 2 | 0.00 | 1.00 | 0.00 | |
| Right upper trapezius | 3.03 | 2 | 1.14 | 0.32 | 0.00 | |
| Left extensor carpi radialis | 2.66 | 2 | 1.16 | 0.31 | 0.00 | |
| Left biceps brachii | 0.14 | 2 | 0.07 | 0.93 | 0.00 | |
| Left triceps brachii | 0.12 | 2 | 0.05 | 0.95 | 0.00 | |
| Left upper trapezius | 1.41 | 2 | 0.50 | 0.61 | 0.00 | |
| For pain tolerance | ||||||
| Right flexor carpi radialis | 101.68 | 2 | 9.19 | <0.001 | 0.04 | |
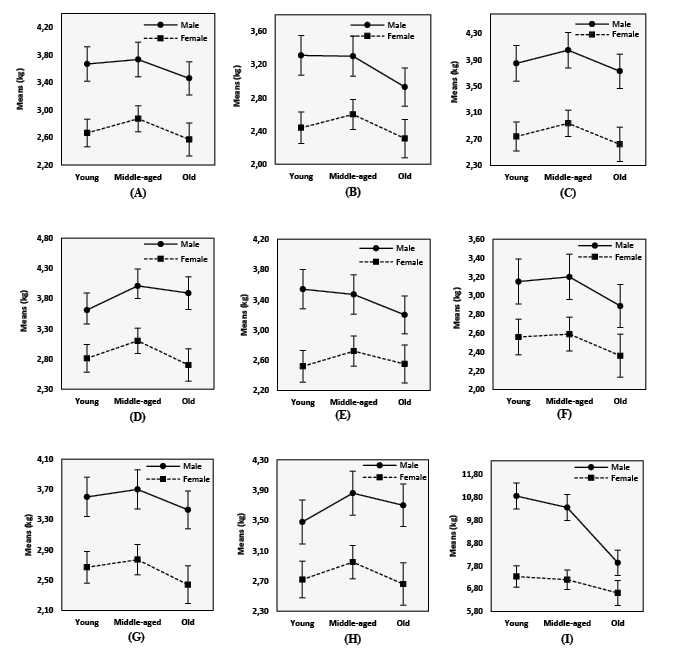
The pairwise comparison of pain threshold and tolerance levels with Bonferroni adjustment between different age groups (presented in Table 5) illustrates that the old group reported the lowest pain threshold values compared to the young and middle-aged groups. Moreover, Figure 1 demonstrates that the middle-aged individuals experienced increased pain threshold levels, and the values declined thereafter. The trend was similar for both sexes. Additionally, the findings highlight a declining trend in the pain tolerance level with the advancement of age.
| Muscle points | Age groups | Mean difference (I-J) | SE | p value | 95% confidence interval | ||
| (I) | (J) | Lower bound | Upper bound | ||||
| For pain threshold | |||||||
| Right extensor carpi radialis | Young | Middle-aged | -0.14 | 0.11 | 0.71 | -0.41 | 0.14 |
| Young | Old | 0.15 | 0.12 | 0.62 | -0.14 | 0.44 | |
| Middle-aged | Old | 0.29 | 0.12 | 0.05 | 0.00 | 0.57 | |
| Right biceps brachii | Young | Middle-aged | -0.07 | 0.11 | 1.00 | -0.33 | 0.19 |
| Young | Old | 0.26 | 0.11 | 0.07 | -0.01 | 0.53 | |
| Middle-aged | Old | 0.33 | 0.11 | 0.01 | 0.06 | 0.60 | |
| Right triceps brachii | Young | Middle-aged | -0.20 | 0.12 | 0.32 | -0.49 | 0.10 |
| Young | Old | 0.12 | 0.13 | 0.99 | -0.18 | 0.43 | |
| Middle-aged | Old | 0.32 | 0.13 | 0.03 | 0.02 | 0.62 | |
| Right upper trapezius | Young | Middle-aged | -0.35 | 0.13 | 0.02 | -0.65 | -0.04 |
| Young | Old | -0.08 | 0.13 | 1.00 | -0.41 | 0.24 | |
| Middle-aged | Old | 0.26 | 0.13 | 0.14 | -0.06 | 0.58 | |
| Left biceps brachii | Young | Middle-aged | -0.04 | 0.11 | 1.00 | -0.30 | 0.22 |
| Young | Old | 0.23 | 0.11 | 0.13 | -0.04 | 0.50 | |
| Middle-aged | Old | 0.26 | 0.11 | 0.05 | 0.00 | 0.53 | |
| Left triceps brachii | Young | Middle-aged | -0.10 | 0.12 | 1.00 | -0.39 | 0.19 |
| Young | Old | 0.20 | 0.13 | 0.33 | -0.10 | 0.50 | |
| Middle-aged | Old | 0.30 | 0.12 | 0.05 | 0.00 | 0.60 | |
| For pain tolerance | |||||||
| Right flexor carpi radialis | Young | Middle-aged | 0.32 | 0.26 | 0.67 | -0.31 | 0.95 |
| Young | Old | 1.82 | 0.27 | <0.001 | 1.16 | 2.47 | |
| Middle-aged | Old | 1.50 | 0.27 | <0.001 | 0.85 | 2.15 | |
| Male | ||||||
| Age groups | Mean difference (I-J) | SE | p value | 95% confidence interval | ||
| (I) | (J) | Lower Bound | Upper Bound | |||
| Young | Middle-aged | 0.50 | 0.41 | 0.68 | -0.49 | 1.48 |
| Young | Old | 2.92 | 0.40 | <0.001 | 1.95 | 3.88 |
| Middle-aged | Old | 2.42 | 0.40 | <0.001 | 1.45 | 3.38 |
| Female | ||||||
| Age groups | Mean difference | SE | p value | 95% confidence interval | ||
| (I) | (J) | Lower bound | Upper bound | |||
| Young | Middle-aged | 0.14 | 0.32 | 1.00 | -0.64 | 0.92 |
| Young | Old | 0.72 | 0.37 | 0.15 | -0.16 | 1.61 |
| Middle-aged | Old | 0.58 | 0.36 | 0.31 | -0.28 | 1.44 |
Table 6 and Figure 1 show that males and females exhibited differences in the age-associated changes in pain tolerance levels. The males had a sharp decline in pain tolerance level along with increasing age. The females also had a similar trend but failed to show a statistically significant difference in mean pain tolerance values across various age groups.
Figure 1. Results of two-way ANOVA with means and 95% confidence intervals for the pain threshold and tolerance levels taken on different muscle points among males and females of different age groups (A) Pain threshold on right extensor carpi radialis, (B) Pain threshold on right biceps brachii, (C) Pain threshold on right triceps brachii, (D) Pain threshold on right upper trapezius, (E) Pain threshold on left extensor carpi radialis, (F) Pain threshold on left biceps brachii, (G) Pain threshold on left triceps brachii, (H) Pain threshold on left upper trapezius, (I) Pain tolerance on right flexor carpi radialis
To date, research on pain thresholds has been equivocal, with several studies indicating that the pain threshold either rises, declines, or remains unchanged with the aging process. Several investigations undertaken among diverse populations recognized a trend of elevated pain thresholds linked to aging, with older people found to have reduced pain sensitivity irrespective of sex (Bek et al. 2002; González-Roldán et al. 2020). The age-related neurobiological changes result in diminishing functional capability, which in turn affects pain sensitivity as well (Yezierski 2012). The aging process is related to a decline in functionality, structures, nerve conduction velocity, and density of both myelinated and unmyelinated nerve fibers, which are primarily responsible for carrying pain signals (Yezierski 2012). In addition, degeneration of the dorsal horn in the spinal cord and alterations in certain regions of the brain that are particularly specialized in nociception processing, including the prefrontal cortex, primary and secondary somatosensory cortex, anterior cingulate, hippocampus, thalamus, and insula, are associated with aging (El Tumi and Tashani 2017). Also, there is evidence regarding the decreased amount of substance P in elderly people (Gibson and Farrell 2004). All of these age-associated physiological and structural alterations are hallmarks of reduced pain sensitivity in older individuals (El Tumi and Tashani 2017). Contrary to the above-described findings, the present study found lower pain threshold levels in older participants, indicating heightened pain sensitivity among them. However, studies conducted by Pickering et al. (2002), Lautenbacher et al. (2005), and Petrini et al. (2015) validated this contradictory finding. Considerable arguments have been proposed regarding these inconsistent results, among which the utilization of different modalities to evoke pain in human subjects is notable. Generally, studies using heat pain stimulus yielded an age-associated increase in pain threshold (Edwards and Fillingim 2001; Helme et al. 2004), whereas the use of pressure pain stimulus resulted in a trend of decreasing pain threshold along with increasing age in multiple studies (Pickering et al. 2002; Lautenbacher et al. 2005; Cole et al. 2010). According to Lautenbacher and colleagues (2005), the nociception processing in the spinal cord is not similar for pressure and heat pain stimulation. Both deep tissues and superficial tissues are involved when pressure pain is applied, while in heat pain stimulation, superficial tissues are predominantly activated. The descending inhibitory control appears to exert greater influence on spinal input from deep tissue nociception when compared to superficial tissues. As a result of this, the age-associated reduction in endogenous pain inhibition may act more effectively on pressure pain nociception, leading to a decline in age-related endogenous pain inhibition for pressure pain. This ultimately may cause a lower threshold level as well as enhanced pain sensitivity in the elderly (Edwards et al. 2003; Lautenbacher et al. 2005; Cole et al. 2010). In contrast to previous research findings, this study showed that, regardless of sex, middle-aged adults exhibited slightly elevated pain threshold levels compared to younger adults, although the age-related differences in pain threshold were non-significant. However, these levels declined in older age groups, aligning with established trends. A recent meta-analysis concluded that, compared to older adults, younger adults exhibited better pain inhibition, and a decline in pain inhibitory capacity may begin in middle age (Hackett et al. 2020). The different results found in our study may be due to the classification of age groups, since the age categories used in studies are varied. Moreover, the use of different pain modalities and locations to induce pain is not similar.
This study showed that older participants demonstrated a lower mean tolerance value when compared to younger age groups, signifying a decrease in pain tolerance levels with advancing age. The results of other studies correspond with this pattern (Bek et al. 2002; Petrini et al. 2015). It is noteworthy that age-related alterations in pain threshold and pain tolerance manifest bi-directionally, with pain threshold levels tending to increase and pain tolerance levels showing a tendency to decrease with age (Lautenbacher et al. 2017). However, the mechanisms underpinning age-related changes in pain tolerance remain relatively underexplored. One possible explanation could be the diminished capacity to activate the endogenous pain modulatory system in older individuals (Bodnar et al. 1988; Bek et al. 2002). Nonetheless, certain theoretical frameworks regarding pain tolerance posit that pain tolerance levels are significantly influenced by cumulative experience; as individuals age, their exposure to and experience of pain may contribute to enhanced pain tolerance (Anderson and Losin 2016). However, the findings of our current study among the tribal population contradict these studies, as pain tolerance appears to decrease with advancing age in this specific population. This disparity denotes that the pain tolerance levels in this particular population may be impacted more by biology than culture.
This study revealed a significant sex disparity in both pain threshold and pain tolerance levels, with females displaying greater sensitivity to pain compared to males. This finding is aligned with a number of previous investigations (Bek et al. 2002; Pelfort et al. 2015; Lue et al. 2018). Numerous biological mechanisms have been suggested to justify the increased sensitivity observed in females, including the influence of sex hormones and endogenous pain modulation. Enhanced levels of the female gonadal hormone progesterone are linked with decreased pain threshold, whereas estrogen levels are linked to nociceptive modulation (Bartley and Fillingim, 2013; Archey et al. 2019). On the other hand, the testosterone hormone’s role in decrementing pain sensitivity has been reported previously (Bartley et al. 2015). A less effective endogenous pain inhibitory capacity in females is one mechanism that has been suggested as an explanation for why females are less sensitive to pain than males (Bulls et al. 2015). Besides these, social factors, such as gender roles and psychological-cognitive variables also contribute largely to this disparity (Belfer 2013). It is essential to recognize that social models and early learning experiences influenced by family and culture play a distinct role in shaping gender-related behaviors (Koutantji et al. 1998). For instance, societal expectations often encourage women to be more aware of pain and express it openly, potentially leading to a greater willingness among women to report pain and, as a result, lowering their pain threshold. Conversely, men are often encouraged to adopt a stoic demeanor, suppressing their pain expression, potentially leading to an increase in their pain threshold (Defrin et al. 2009). It seems that this tribal community also upholds this gender-stereotype perspective towards pain.
In the present study, the interaction effects of age and sex on the pain threshold were non-significant. The insignificant interaction effect of age and sex implies that the trend of an age-associated decrease in pain threshold level is similar in both males and females, even when considering the notable hormonal changes that occur in females during different reproductive events and as they age. While some prior studies (Pickering et al. 2002; Petrini et al. 2015) contradicted this observation by suggesting that age-related changes in pain threshold levels were more pronounced in males than females, a study by Lautenbacher and colleagues (2005) supports this result. Additionally, Lautenbacher et al. (2005) noted that the small sample size of their study might have influenced their findings. However, this proposition doesn’t seem significant in light of the large sample size used in the current research. Furthermore, while hormones like estrogen influence pain sensitivity, their impact might be complex and vary across individuals. Other factors might play a more dominant role in age-related pain changes. The similarity in age-related changes in pain threshold levels between males and females can be attributed to shared neurobiological mechanisms governing pain perception. The aging process appears to impact these common mechanisms similarly across genders, resulting in a parallel decline in pain threshold values. This underscores the overriding influence of age-related neurobiological changes on pain sensitivity, transcending sex-specific differences. Further research into the specific neurobiological pathways affected by aging could enhance our understanding of this convergence.
The male participants of this present study exhibited a sharp declining trend in pain tolerance with increasing age, while the females also indicated a similar trend, but no marked difference across the age groups of the females was observed. This finding aligns with the studies by Woodrow et al. (1972) and McEntarfer et al. (2005), indicating that the decline in pain tolerance with age was evident in males but not in females. This finding may be attributed to not considering the menstrual cycle phase in the study for female participants. It is likely that some young and middle-aged females were assessed during lower estrogen phases, possibly increasing pain sensitivity. Inclusion of these women may have lowered average pain tolerance in their respective groups, narrowing the difference in pain tolerance across the three age groups (McEntarfer et al. 2005).
The present study has several limitations. The cross-sectional design employed in the study lacks the capacity to capture individual changes in pain threshold and tolerance with age. Restricting the assessment of pain to a single method (pressure pain) introduces challenges in drawing robust inferences from the study. Furthermore, the observed alterations in pain threshold and tolerance levels are confined to specific muscle points, impeding generalization to other anatomical regions. The current study did not control for the menstrual cycle phases of the female participants. Self-reported pain unpleasantness was not assessed, which could give a better insight. Additionally, variables, such as gender role expectations of pain, the role of family, and participants’ upbringing, which could potentially influence pain perception, were not accounted for.
Our research on pain perception among the Santal people revealed substantial effects of age and sex on pain threshold and tolerance levels. Specifically, males exhibited significantly higher pain threshold and tolerance values compared to females. Furthermore, a notable age-related decline in pain threshold and tolerance levels was observed. The interaction effect of age and sex was insignificant for pain threshold levels; however, the interaction effect of age and sex was significant for pain tolerance levels, indicating that the decline in pain tolerance with age was marked in males but not in females. This research primarily underscores the influence of biological factors and, to some extent, socio-cultural factors on pain perception within the Santal tribal community. These findings highlight the importance of considering both age and sex factors when assessing pain perception among the Santal population. In a clinical context, these insights can guide healthcare professionals in tailoring pain management strategies that consider sex and age-specific variations, enhancing the effectiveness of interventions, and contributing to more personalized and culturally sensitive healthcare practices.
Ethics approval and consent to participate
The study is ethically approved by the Review Committee for Protection of Research Risks to Humans, Indian Statistical Institute (ISI Ethics Clearance No.: ISI-IEC/2022/02/03). Written informed consent was obtained from all individual participants included in the study.
Acknowledgements
The authors are indebted to the study participants for taking part in this research. The authors are also thankful to the University Grants Commission for funding this research.
Funding
The University Grants Commission (UGC) funded the research [UGC reference ID: 809/(NET-NOV2017)].
Conflict of interests
There is no competing interest to declare.
Authors’ contribution
Both AS and SKR conceptualized the study. Data collection, analysis and interpretation were done by AS. Both SKR and MG reviewed the first draft of the manuscript. The final draft was reviewed by AS, SKR, MG and DC.
Authors’ statement
The article has not been previously published or concurrently submitted to an editorial office of another journal, and it has also been approved by all authors and the institutions where it was developed.
Anderson SR, Losin EAR. 2017. A sociocultural neuroscience approach to pain. Culture and Brain 5:14–35. https://doi.org/10.1007/s40167-016-0037-4
Archey M, Goldey K, Crockett E, Boyette-Davis J. 2019. An Investigation of the Effects of Testosterone and Behavioral Expressions of Pain on Sex/Gender Differences in Pain Perception. Psychol Rep 122:826–840. https://doi.org/10.1177/0033294118781320
Bartley EJ, Fillingim RB. 2013. Sex differences in pain: a brief review of clinical and experimental findings. Br J Anaesth 111:52–58. https://doi.org/10.1093/bja/aet127
Bartley EJ, Palit S, Kuhn BL, Kerr KL, Terry EL, DelVentura JL, et al. 2015. Natural variation in testosterone is associated with hypoalgesia in healthy women. Clin J Pain 31:730–739. https://doi.org/10.1097/AJP.0000000000000153
Bek N, Uygur F, Bayar B, Armutlu K. 2002. Analysis of age and gender related differences in pressure pain threshold and pressure pain tolerance levels. Pain Clinic 14:309–314. https://doi.org/10.1163/15685690260494843
Belfer I. 2013. Nature and nurture of human pain. Scientifica 2013:415279. https://doi.org/10.1155/2013/415279
Bodnar RJ, Romero MT, Kramer E. 1988. Organismic variables and pain inhibition: roles of gender and aging. Brain Res Bull 21:947–953. https://doi.org/10.1016/0361-9230(88)90032-9
Boro B, Saikia N. 2020. A qualitative study of the barriers to utilizing healthcare services among the tribal population in Assam. PLoS One 15:e0240096. https://doi.org/10.1371/journal.pone.0240096
Bulls HW, Freeman EL, Anderson AJ, Robbins MT, Ness TJ, Goodin BR. 2015. Sex differences in experimental measures of pain sensitivity and endogenous pain inhibition. J Pain Res 8:311–320. https://doi.org/10.2147/JPR.S84607
Burger HG, Hale GE, Robertson DM, Dennerstein L. 2007. A review of hormonal changes during the menopausal transition: focus on findings from the Melbourne Women’s Midlife Health Project. Hum Reprod Update 13:559–565. https://doi.org/10.1093/humupd/dmm020
Cámara RJA, Gharbo RK, Egloff N. 2020. Age and Gender as Factors of Pressure Sensitivity of Pain-Free Persons: Are They Meaningful? J Pain Res 13:1849–1859. https://doi.org/10.2147/JPR.S248664
Cimpean A, David D. 2019. The mechanisms of pain tolerance and pain-related anxiety in acute pain. Health Psychol Open 6:2055102919865161. https://doi.org/10.1177/2055102919865161
Cohen J. 1988. Statistical Power Analysis for the Behavioral Sciences. New York: Routledge Academic.
Cole LJ, Farrell MJ, Gibson SJ, Egan, GF. 2010. Age-related differences in pain sensitivity and regional brain activity evoked by noxious pressure. Neurobiol Aging 31:494–503. https://doi.org/10.1016/j.neurobiolaging.2008.04.012
Defrin R, Shramm L, Eli I. 2009. Gender role expectations of pain is associated with pain tolerance limit but not with pain threshold. Pain 145:230–236. https://doi.org/10.1016/j.pain.2009.06.028
DiMatteo MR, Martin LR. 2002. Health Psychology. Boston: Allyn and Bacon.
Domenichiello AF, Ramsden CE. 2019. The silent epidemic of chronic pain in older adults. Prog Neuropsychopharmacol Biol Psychiatry 93:284–290. https://doi.org/10.1016/j.pnpbp.2019.04.006
Duan G, Xiang G, Zhang X, Guo S, Zhang Y. 2014. An improvement of mechanical pain sensitivity measurement method: the smaller sized probes may detect heterogeneous sensory threshold in healthy male subjects. Pain Med 15:272–280. https://doi.org/10.1111/pme.12245
Edwards RR, Fillingim RB. 2001. Age-associated differences in responses to noxious stimuli. J Gerontol 56:M180–185. https://doi.org/10.1093/gerona/56.3.m180
Edwards RR, Fillingim RB, Ness TJ. 2003. Age-related differences in endogenous pain modulation: a comparison of diffuse noxious inhibitory controls in healthy older and younger adults. Pain 101:155–165. https://doi.org/10.1016/s0304-3959(02)00324-x
El Tumi HG, Tashani OA. 2017. Effect of age, sex and gender on pain sensitivity: a narrative review. The Open Pain J 10:44–55. https://doi.org/10.2174/1876386301710010044
Elgaddal N, Kramarow EA, Weeks JD, Reuben C. 2024. Arthritis in Adults Age 18 and Older: United States, 2022. US Department of Health and Human Services, Centers for Disease Control and Prevention, National Center for Health Statistics. https://stacks.cdc.gov/view/cdc/145594
Failla MD, Beach PA, Atalla S, Dietrich MS, Bruehl S, Cowan RL, et al. 2024. Gender Differences in Pain Threshold, Unpleasantness, and Descending Pain Modulatory Activation Across the Adult Life Span: A Cross Sectional Study. J Pain 25:1059–1069. https://doi.org/10.1016/j.jpain.2023.10.027
Ferreira SA, Kokubun E, Gobbi S, Fernandes RA, Queiróga MR. 2015. Musculoskeletal pain perception and hypertension. Revista Dor 16:43–47. https://doi.org/10.5935/1806-0013.20150009
Fillingim RB, Maixner W, Girdler SS, Light KC, Harris MB, Sheps DS, et al. 1997. Ischemic but not thermal pain sensitivity varies across the menstrual cycle. Psychosom Med 59:512–520. https://doi.org/10.1097/00006842-199709000-00008
Gazerani P, Aloisi AM, Ueda H. 2021. Editorial: Differences in Pain Biology, Perception, and Coping Strategies: Towards Sex and Gender Specific Treatments. Front Neurosci 15:697285. https://doi.org/10.3389/fnins.2021.697285
Georgoudis G, Oldham J, Watson PJ, Grammatopoulou E. 2014. Reliability measures of subcutaneous pressure pain threshold measurements: a proposed method of assessing painful musculoskeletal disorders. J Nov Physiother 4:1–8.
Gibson SJ. 2003. Pain and aging: The pain experience over the adult life span. In: JO Dostrovsky, DB Carr, M Koltzenburg, editors. Proceedings of the 10th world congress on pain, progress in pain research and management. Volume 24. Seattle: IASP Press. 767–790.
Gibson SJ, Farrell M. 2004. A review of age differences in the neurophysiology of nociception and the perceptual experience of pain. Clin J Pain 20:227–239. https://doi.org/10.1097/00002508-200407000-00004
González-Roldán AM, Terrasa JL, Sitges C, van der Meulen M, Anton F, Montoya P. 2020. Age-Related Changes in Pain Perception Are Associated With Altered Functional Connectivity During Resting State. Front Aging Neurosci 12:116. https://doi.org/10.3389/fnagi.2020.00116
Hackett J, Naugle KE, Naugle KM. 2020. The Decline of Endogenous Pain Modulation With Aging: A Meta-Analysis of Temporal Summation and Conditioned Pain Modulation. J Pain 21:514–528. https://doi.org/10.1016/j.jpain.2019.09.005
Helme RD, Meliala A, Gibson SJ. 2004. Methodologic factors which contribute to variations in experimental pain threshold reported for older people. Neurosci Lett 361:144–146. https://doi.org/10.1016/j.neulet.2003.12.014
International Institute of Population Science (IIPS) and ICF. 2017. National Family Health Survey (NFHS-4) 2015–16, India (Mumbai: IIPS).
Koutantji M, Pearce SA, Oakley DA. 1998. The relationship between gender and family history of pain with current pain experience and awareness of pain in others. Pain 77:25–31. https://doi.org/10.1016/S0304-3959(98)00075-X
Lautenbacher S, Kunz M, Strate P, Nielsen J, Arendt-Nielsen L. 2005. Age effects on pain thresholds, temporal summation and spatial summation of heat and pressure pain. Pain 115:410–418. https://doi.org/10.1016/j.pain.2005.03.025
Lautenbacher S, Peters JH, Heesen M, Scheel J, Kunz M. 2017. Age changes in pain perception: A systematic-review and meta-analysis of age effects on pain and tolerance thresholds. Neurosci Biobehav Rev 75:104–113. https://doi.org/10.1016/j.neubiorev.2017.01.039
Lorusso L, Salerno M, Sessa F, Nicolosi D, Longhitano L, Loreto C, et al. 2018. Autoalgometry: An Important Tool for Pressure Pain Threshold Evaluation. J Clin Med 7:273. https://doi.org/10.3390/jcm7090273
Lue YJ, Wang HH, Cheng KI, Chen CH, Lu YM. 2018. Thermal pain tolerance and pain rating in normal subjects: Gender and age effects. Eur J Pain 22:1035–1042. https://doi.org/10.1002/ejp.1188
McEntarfer C, DiPirro J, Page D. 2005. The Effects of Gender and Aging on Pain Perception. Psi Chi J Psychol Res 10:145–149.
Meriggiola MC, Nanni M, Bachiocco V, Vodo S, Aloisi AM. 2012. Menopause affects pain depending on pain type and characteristics. Menopause 19:517–523. https://doi.org/10.1097/gme.0b013e318240fe3d
Moore AR, Clinch D. 2004. Underlying mechanisms of impaired visceral pain perception in older people. J Am Geriatr Soc 52:132–136. https://doi.org/10.1111/j.1532-5415.2004.52023.x
Nikolov V, Petkova M. 2010. Pain sensitivity among women with low estrogen levels. Procedia Soc Behav Sci 5:289–293. https://doi.org/10.1016/j.sbspro.2010.07.090
Overstreet DS, Strath LJ, Jordan M, Jordan, IA, Hobson JM, Owens MA, et al. 2023. A Brief Overview: Sex Differences in Prevalent Chronic Musculoskeletal Conditions. Int J Environ Res Public Health 20:4521. https://doi.org/10.3390/ijerph20054521
Pelfort X, Torres-Claramunt R, Sánchez-Soler JF, Hinarejos P, Leal-Blanquet J, Valverde D, et al. 2015. Pressure algometry is a useful tool to quantify pain in the medial part of the knee: an intra- and inter-reliability study in healthy subjects. Orthop Traumatol Surg Res 101:559–563. https://doi.org/10.1016/j.otsr.2015.03.016
Petrini L, Matthiesen ST, Arendt-Nielsen L. 2015. The effect of age and gender on pressure pain thresholds and suprathreshold stimuli. Perception 44:587–596. https://doi.org/10.1068/p7847
Pickering G, Jourdan D, Eschalier A, Dubray C. 2002. Impact of age, gender and cognitive functioning on pain perception. Gerontology 48:112–118. https://doi.org/10.1159/000048937
Racine M, Tousignant-Laflamme Y, Kloda LA, Dion D, Dupuis G, Choinière M. 2012. A systematic literature review of 10 years of research on sex/gender and experimental pain perception - part 1: are there really differences between women and men? Pain 153:602–618. https://doi.org/10.1016/j.pain.2011.11.025
Roy SK, Kar Chakraborty S, Mozumdar A. 2013. Health: Cognition and threshold among the Oraon tea garden labourers of Jalpaiguri District, West Bengal. J Anthropol 2013:987584. https://doi.org/10.1155/2013/987584
Rutstein SO. 2008. DHS working papers. The DHS Wealth Index: Approaches for Rural and Urban Areas. Macro International, USA.
Santra A, Roy SK, Goswami M, Chatterjee D. 2024. An exploratory study on sex differences in musculoskeletal pain and its associated factors among the Santal indigenous people of West Bengal, India. Discov Soc Sci Health 4:67. https://doi.org/10.1007/s44155-024-00123-y
Schmitz AK, Vierhaus M, Lohaus A. 2013. Pain tolerance in children and adolescents: sex differences and psychosocial influences on pain threshold and endurance. Eur J Pain 17:124–131. https://doi.org/10.1002/j.1532-2149.2012.00169.x
Shipton EA. 2013. The pain experience and sociocultural factors. N Z Med J 126:7–9.
Singh V, Singh M. 2017. Dynamic Concept of Tribes in India: A Historical Excursion. International Journal of Economic Perspectives 11:160–168.
Stevens B. 2021. Revisions to the IASP definition of pain-What does this mean for children? Paediatr Neonatal Pain 3:101–105. https://doi.org/10.1002/pne2.12047
Swift A. 2018. Understanding pain and the human body’s response to it. Nurs Times 114:22–26.
Vincent K, Tracey I. 2008. Hormones and their Interaction with the Pain Experience. Rev Pain 2:20–24. https://doi.org/10.1177/204946370800200206
Walton DM, Macdermid JC, Nielson W, Teasell RW, Nailer T, Maheu P. 2011. A descriptive study of pressure pain threshold at 2 standardized sites in people with acute or subacute neck pain. J Orthop Sports Phys Ther 41:651–657. https://doi.org/10.2519/jospt.2011.3667
Woodrow KM, Friedman GD, Siegelaub AB, Collen MF. 1972. Pain tolerance: differences according to age, sex and race. Psychosom Med 34:548–556. https://doi.org/10.1097/00006842-197211000-00007
Yağci N, Duymaz T, Cavlak U. 2014. How does pain localization affect physical functioning, emotional status and independency in older adults with chronic musculoskeletal pain? J Phys Ther Sci 26:1189–1192. https://doi.org/10.1589/jpts.26.1189
Yezierski RP. 2012. The effects of age on pain sensitivity: preclinical studies. Pain Med 13 Suppl 2:S27-36. https://doi.org/10.1111/j.1526-4637.2011.01311.x

