 https://orcid.org/0000-0003-1907-554X
Introduction
The temporal muscle is the largest and strongest muscle of the mastication apparatus, placed in the temporal fossa. Its main role is to elevate the jaw associated with the chewing and biting process. This muscle is fan-shaped, consisting of numerous fibers running in three different directions (the anterior fibers run almost vertically, the medial fibers run obliquely, and the posterior fibers run horizontally). These fibers start at the inferior temporal line and descend inferiorly into the tendon, which includes the coronoid process of the mandible (also attaches to the retro-molar fossa) (e.g., Tolhurst et al. 1991). After birth, this muscle grows only through the hypertrophy of its fibers (Rowe and Goldspink1969; Pearson 1990). Based on data obtained from the 3D CT scans of their skulls, it has been established that in human children occurs an age-related expansion of the area of the attachment of the temporal muscle (the bony origin) in two directions (vertical and horizontal) which is not explained only by the covariation of the growth of the temporal muscle and braincase (Moltoni et al. 2021). It has been suggested that the main cause of this phenomenon might be a response to a more solid diet through the age-related changes in the chewing pattern (e.g., Kamegai et al. 2005) that requires an increase in the strength of this muscle (Moltoni et al. 2021). Given the above, it could be hypothesized that individuals who consumed harder food during childhood should have a more developed and stronger temporal muscle in relation to the size of their braincase. They should also exhibit more massive supraorbital area of the frontal bone, especially its most lateral region located closest to the anterior area of attachment of this muscle. The stresses generated during functioning of the temporal muscles acting during the growth of the skulls could affect the morphology of the skulls and the formation of the massiveness of the supraorbital area of the frontal bone.
So far, the reasons for the variability in the massiveness of the supraorbital area of the frontal bone observed in representatives of Homo sapiens populations derived from different geographical areas of the world have not been fully understood (e.g., Lahr 1996; Lahr and Wright 1996; Baab et al. 2010; Nowaczewska et al. 2015). This variability concerns the degree of development of the massiveness of the following regions of the frontal bone, such as the glabella (the region located between the two superciliary arches), the superciliary arches and the so-called trigonum (the most lateral structural element of the supraorbital region) (Figure 1a) (Cunningham 1908). These three structural areas may show a very different degree of expression from extremely high, often occurring in, for instance, Patagonians, Australians or former inhabitants of Tasmania, through a moderate degree of development in European populations, to weak, often occurring in Africans (Lahr 1996; Lahr and Wright 1996). Among various factors potentially influencing the massiveness of the above-mentioned regions of the skull (apart from the basic sex factor related to the influence of sex hormones (e.g., Buikstra and Ubelaker 1994; White and Folkens 2000)), the biomechanical impact on the growing facial skeleton through the stresses generated during the functioning of the mastication apparatus has been discussed (e.g. Endo 1970; Russell 1985). In the case of this factor, significant developmental plasticity and epigenetic influence have been suggested as mechanisms explaining this relationship (Lieberman 2011; Von Cramon-Taubadel 2014; Katz et al. 2017). According to the localized masticatory stress hypothesis, greater masticatory stress can contribute to greater facial skeleton massiveness during the period of its formation in the regions influenced by its action (Lahr 1996; Lahr and Wright 1996). Based on the results of experiments carried out on mammals, the formation of stronger stresses caused by eating harder food, the chewing of which required generation of greater forces by the mastication apparatus, has been suggested to be associated with the development of a larger size of facial skeleton and its massiveness in humans (Lieberman et al. 2004; Ravosa et al. 2010; Lieberman 2011). This has been further supported by the experimental studies concerning the reduction in the functioning of the mastication apparatus (e.g., in rats Watt and Williams 1951; Beecher and Corruccini 1981; Bresin et al. 1994), along with the latest study on the consequences of the soft food consumption (short-term and multi-generational) reflected in the changes in the craniofacial morphology of mice (Hassan et al. 2020).
The results of the examinations of the skulls of archaeological human populations concerning the analysis of their morphology indicated differences in their massiveness and shape between populations (maintaining regional and genetic continuity) that changed their lifestyle from a hunter-gatherer to a sedentary (agricultural) lifestyle, associated with a change to a more processed and soft diet – farmers’ skulls showed a reduction in the massiveness and size of the facial skeleton and a more short and rounded braincase compared to hunter-gatherer skulls (Carlson and Van Gerven 1977; Larsen 1995; Sardi et al. 2006). However, this phenomenon has not yet been fully explained. The occurrence of larger sizes (e.g., height, length) of the attachment area of the temporal muscles as elements of the mastication apparatus have been suggested to be associated with the generation of greater biomechanical stresses during the mastication (chewing) process acting on the human skull (Lahr 1996; Noback and Harvati 2015; Toro-Ibacachea et al. 2016).
It has been also suggested that one of the reasons for the differences observed in the neurocranial shape (its breadth and length) between human populations could be changes in the type of diet associated with reduction of the size and strength of the temporal muscles causing reduction of the stress acting on the lateral parts of the neurocranium (more globular braincases exhibited less robust temporal muscles) (e.g. Hylander 1977; Perez and Monteiro 2009; Paschetta et al. 2010; Perez et al. 2011). It is worth pointing out that the reduction of the size of the temporal muscle is not considered as the basic factor explaining the observed variation in the neurocranial shape as the main importance of genetic factors has been commonly suggested (Roseman 2004; Harvati and Weaver 2006; Smith et al. 2007; Von Cramon-Taubadel 2011; Matsumura et al. 2022). However, in the light of the presented above information, the role of the temporal muscle activity as an additional factor influencing the shape of the braincase during its growth can be considered as probable. A relationship between the traits of the temporal muscle and the shape of the braincase has been also suggested based on the fact that, due to the location of this muscle attachment on the lateral wall of the vault of the braincase, the development and growth of this muscle (a large part of it) cooccurs with the growth of the braincase. Its size is also largely determined by the capacity of the braincase (Lieberman 2011; Noback and Harvati 2015). The importance of the shape of the skull for the formation of the massiveness of the human facial skeleton (including the supraorbital area) was suggested by Lahr and Wright (1996) and Nowaczewska et al. (2015). Baab et al. (2010) showed a significant relationship between the shape of the skull and inter-population differences in cranial robusticity.
Only a few studies have focused on the assessment of the meaning of the traits of the temporal muscle for the formation of the massiveness of the supraorbital region of the facial skeleton. For instance, the relationship between these features and the massiveness of this area was suggested by Lahr (1996), Lahr and Wright (1996). Lahr (1996), based on the results of a study concerning a sample of adult human skulls from different geographical areas, suggested a relationship between the metric traits of the mastication apparatus (including temporal muscles) with the massiveness of the supraorbital areas. However, in her study, the differences in the values of these features related to the differences in the size of the facial skeleton of the examined skulls and the potential influence of the shape of the braincase on the features of the temporal muscle were not considered. Thus, further studies exploring this topic are needed.
The first aim of this study is to determine whether in the examined sample of adult male skulls there are relationships between the features of the temporal muscle (its height and length) standardized to the size of the braincase and the degree of massiveness of the glabella, superciliary arch and trigonum standardized to the size of the facial skeleton. It is worth noting that in this study the male skulls of Africans and Australians were examined together as one sample of male Homo sapiens skulls. Australian skulls are commonly considered as the most robust and the African skulls as more gracile compared to other adult human skulls (e.g., Lahr 1996). By including Australian and African crania in one sample, we obtained a greater variability of the examined traits and, therefore, a greater chance of detecting the relationship between the examined traits compared to samples that include crania exhibiting a low degree of diversity of the examined traits.
Given the potential influence of the neurocranial shape on the analyzed traits and the meaning of the biomechanical stresses transmitted by the permanent upper molars during mastication into the facial bones influencing the development of the massiveness of the supraorbital region during facial growth (see Nowaczewska et al. 2023), the second (main) aim of this study is to determine whether there is a significant relationship between analyzed traits of the temporal muscle and the degree of the massiveness of the supraorbital region with the exclusion of the influence of the neurocranial shape and the size of the occlusal surface of the permanent upper molars (first and second). The last of these traits was included because the results of the study of Nowaczewska et al. (2023) regarding the Homo sapiens cranial sample indicated the presence of a positive relationship between the area of occlusal surface of permanent upper molars and the degree of massiveness of trigonum independent of the influence of the size of the facial skeleton.
The second stage of our research (i.e., on the exclusion of the potential influence of the above-mentioned traits on the assessed relationships) has been carried out only for the degree of the massiveness of the supraorbital area related to the traits of the temporal muscle. The supraorbital area, which is located closest to the place of the temporal muscle attachment, has been suggested to be considerably predisposed during the growth of the skull to the impact of mastication stress generated by the working temporal muscle (Mitteroecker et al. 2012; Noback and Harvati 2015).
The results of these analyses will allow to establish which of the features (including the relative height and length of the temporal muscle, the shape of the braincase or the relative size of the first or second molar occlusal area) show the strongest relationship with the degree of the massiveness of the supraorbital region of the human skulls.
Material and methods
Sample
The sample of adult male skulls (from the 19th century) including 29 belonging to Africans and 15 belonging to Australians were used (Milicerowa 1955; Górny 1957). The African and Australian skulls were parts of two human cranial collections – first housed at the Department of Anthropology of the Hirszfeld Institute of Immunology and Experimental Therapy, Polish Academy of Sciences (Wrocław, Poland) and the second housed at the Department of Human Biology of the University of Wrocław (Poland). To exclude the influence of sex on the development of the cranial traits (degree of the robusticity of the areas of the supraorbital part of the facial skeleton (Rosas and Bastir 2002; Garvin and Ruff 2012)) and the size of the crown of the upper molars (Hillson 1996; Dempsey and Townsend 2001), only male crania were examined. Data regarding sex of the Australian specimens was obtained from literature (Milicerowa 1955). Sex of the African specimens was established based on the assessment of the expression of the qualitative cranial traits according to the methodology described by Ferembach et al. (1980), with the exclusion of the supraorbital part of the facial skeleton (to avoid the problem of circularity). There was a lack of postcranial bones for most of the examined African specimens, thus their traits could not be included in the assessment of sex. The adult specimens were selected based on the standard criteria including the presence of the fully fused spheno-occipital synchondrosis, the third molar and/or advanced degree of obliteration of the cranial sutures (Buikstra and Ubelaker 1994; White and Folkens 2000).
Traits
All traits used in this study are described in Table 1. The criterion of the presence of the data for all of the analysed traits for each of the skulls substantially affected the size of the finally selected cranial sample (n = 44), all of these skulls exhibited the preserved two types of upper molars (first – M1 and second – M2) embedded in the alveolar process (n = 88).
Two traits of the temporal muscle attachment area were used in this study: height (H-TM) and length (L-TM) (Figure 1b). Both of these traits were collected from the left side of the cranial vaults (exceptionally on the right side only when the external surface of the cranial bones in the region of the inferior temporal line presence did not exhibit a sufficiently good state of preservation – the inferior temporal line was not visible) and indicated appropriate repeatability (Table 2). The metric traits of the braincase and facial skeleton were collected by one of the authors (WN) using a standard sliding calliper and spreading calliper with an accuracy of 0.5 mm, except for the height and length of the temporal muscle, which were collected using a digital sliding calliper with an accuracy of 0.01 mm. The raw data on metric and qualitative traits of facial skeleton was used as the part of database (prepared earlier by WN) that was also used in the other study indicating their high repeatability (Nowaczewska et al. 2023). The traits of the temporal muscle were standardized to the neurocranial size (NC-S) to eliminate the problem of the differences in their values caused by differences in the neurocranial size in examined skulls. By analogy, the degree of the massiveness of the three supraorbital areas of the frontal bone including the glabella (G), supraorbital ridge (S) and trigonum (T) (Figure 1a) were standardized to the size of the facial skeleton (FS-S). The metric traits of the mandibles were not included in the measure of the facial size because of the lack of mandibles in a good state of preservation in most of the examined crania. The geometric mean of the chosen metric facial and neurocranial traits was used as the measure of facial size and neurocranial size, respectively. This method of size assessment of the cranial modules has been commonly used in other studies (e.g., Lieberman et al. 2002; Sardi et al. 2006; Nowaczewska et al. 2023).
*These traits were not analysed separately: FS-S and NC-S were used only to calculate the other traits included in the statistical analyses; the measurements used to calculate two traits above-mentioned were taken according to Martin’s definitions (Bräuer, 1988) except the one in the case of which the point hormion (ho) was localised on the sphenoid bone in the point of the intersection of midsagittal line of the cranium (at right angle) with line passing through the most posterior point on the ala vomeris; the abbreviations of the anthropometric points presented in this Table: eu – euryon; g – glabella; op – opisthocranion; b – bregma; ba – basion; n – nasion; ns – nasospinale; fmt - frontomalare temporale; zm – zygomaxillare.
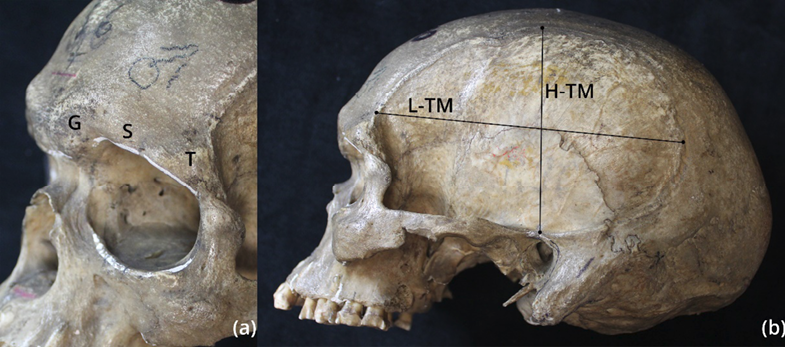
Fig. 1. The three regions of the supraorbital part of the frontal bone for which the degree of the massiveness was assessed (a: G – glabella; S – supraorbital ridge; T – trigonum) and the two measurements of the temporal muscle size (b: L-TM – length of the temporal muscle, H-TM – height of the temporal muscle)
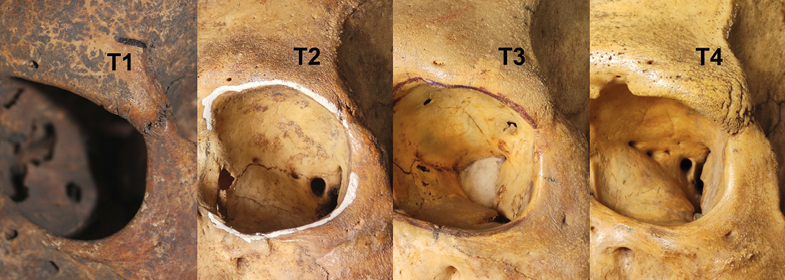
Fig. 2. Four-stage scale of development of the trigonum (T) massiveness: from the weakest formation (T1) to the strongest (T4)
| Measurements of temporal muscle | T-test (T, paired-test)/or Wilcoxon (W) test* statistic | p – value |
| H-TM | W = 0.019 | 0.985 |
| L-TM | T = 1.738 | 0.089 |
p < 0.05; W* - non-parametric equivalent of T-test (paired test) using when the condition of normality of the distribution of the differences between the first measurement of H-TM and the second measurement of H-TM is not met.
To obtain data on the size of the occlusal surface of the examined molars (M1s and M2s) the methodology described by Górka et al. (2015, 2016) was used. The values of this trait were collected by one of the authors (KG) from photos of the occlusal surface of their crown (300 dpi). These photos were taken using the Canon EOS 600 D camera. The camera was attached to a stand (the focal distance = 0.5 m). A linear scale for later calibration was placed parallel to the camera lens and at the same height as the upper (occlusal) surface of each examined tooth. Images were calibrated and processed with the use of the ImageJ software (Abràmoff et al. 2004). The total occlusal area (TOA) was calculated from the outline of the perimeter of the occlusal surface. It was possible by using the polygon tool. A minimum of 30 points were recorded for the crown outline (Figure 3). The examined teeth were always orientated in such a way that the occlusal surface of each tooth was placed parallel to the camera lens. The right molars were examined only when the left molars were not present or did not exhibit a good state of crown preservation. The molars with a severe degree of crown wear were not included in the analysis. The raw data of the TOA of M1s and M2s was used in this study as a part of the database including these traits of the African and Australian males and females (collected by KG) which was used earlier in other research indicating that the method of the TOA collection was reliable and precise (Nowaczewska et al. 2023).
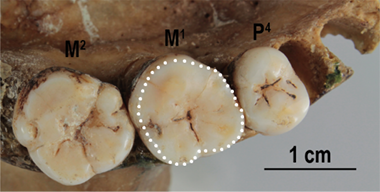
Fig. 3. The total occlusal area of the examined M1 marked with white points according to the methodology used in this study (cranium of adult Australian male)
Statistical analyses
Statistical analysis was performed using the “Paleontological Statistics software package for education and data analysis” - PAST version 4.10–4.12 (Hammer et al. 2001). In the first stage of the analysis, to establish whether significant correlations occurred between the metric traits of the temporal muscle (its height, H-TM and length, L-TM) and the degrees of the massiveness of the three supraorbital areas of the frontal bone (G, S and T), Spearman’s rank correlation analysis was performed. To determine whether the cranial size influenced the analysed relationships, Spearman’s rank correlation analyses were performed to establish the presence of a significant correlations between two traits of the temporal muscle standardized to the neurocranial size (relative height H-TM/NC-S and relative length L-TM/NC-S) and the degrees of massiveness of the three supraorbital areas standardized to facial size (G/FS-S, S/FS-S, T/FS-S). In the second stage of the analysis regarding the degree of the relative massiveness of the examined supraorbital area, for which a significant correlation with the relative length and/or relative height of the temporal muscle was established, a partial rank correlation was performed. These types of analyses included the models encompassing two additional features (the shape of the braincase - XCB/GOL x 100) and the relative size of the occlusal area of the upper molars (the TOA of M1s/FS-S or the TOA of M2s/FS-S). Due to the differences in the time of development of the crown of the permanent first molar in relation to the second (Hillson 1996), the influence of various factors on these two types of teeth and other structural conditions of the skull during their development the analyses including the occlusal area of these teeth was conducted separately. Two types of models were used: first included, among the other traits, the TOA of M1s/FS-S and the second included the TOA of M2s/FS-S. A partial rank correlation analysis was used to determine the relationship between the examined traits with the exclusion of the potential influence of the other traits included in the models. These analyses were performed to determine whether there was a significant relationship, independent of neurocranial shape and relative size of the occlusal area of upper molars, between the examined trait/traits of the supraorbital region of the frontal bone and the traits of the temporal muscle. The results of the correlation analyses were considered significant when p < 0.05.
Results
The summary statistics of the quantitative traits used in this study and the percentage of the observed degrees of massiveness of the examined supraorbital areas of the facial skeleton are presented in Table 3 and Table 4, respectively.
| Traitsa (n = 44) | Mean | Minimum | Maximum | SD |
| H-TM [mm] | 77.23 | 64.12 | 91.54 | 6.35 |
| L-TM [mm] | 112.19 | 90.72 | 127.23 | 8.56 |
| NC-S [mm] | 145.98 | 137.40 | 153.44 | 4.14 |
| L-TM/NC-S [without units] | 0.77 | 0.65 | 0.87 | 0.05 |
| H-TM/NC-S [without units] | 0.53 | 0.45 | 0.63 | 0.04 |
| XCB/GOL × 100 [without units] | 71.35 | 62.90 | 77.84 | 3.30 |
| TOA M1 [mm2] | 99.92 | 75.22 | 126.52 | 11.73 |
| TOA M2 [mm2] | 92.43 | 65.13 | 121.33 | 12.49 |
| FS-S [mm] | 64.68 | 58.15 | 68.36 | 2.52 |
| TOA M1/FS-S [mm] | 1.54 | 1.20 | 1.99 | 0.16 |
| TOA M2/FS-S [mm] | 1.43 | 1.09 | 1.80 | 0.17 |
a abbreviations of all of these traits are explained in Table 1.
| Qualitative trait | Degree 1 | Degree 2 | Degree 3 | Degree 4 | Degree 5 |
| G | 36.4% | 31.8% | 18.2% | 6.8% | 6.8% |
| S | 22.7% | 36.4% | 18.2% | 22.7% | |
| T | 50% | 27.3% | 18.2% | 4.5% |
Note: examined cranial sample includes 44 crania = 100%
The obtained results of Spearman’s rank correlation analyses concerning the traits non-standardized to the cranial size indicated the presence of a significant and positive correlation between the two traits of the temporal muscle (H-TM and L-TM) and the degree of the massiveness of S (weak in the case of both metric traits) and T (moderate and weak, respectively) (Table 5). In the case of the standardized cranial traits, the results showed the occurrence of a significant (positive, weak) correlation between the traits of the temporal muscle (H-TM/NC-S and L-TM/NC-S) and T/FS-S (Table 5). There were no other relationships between these traits and other traits of the supraorbital region (Table 5).
Taking into account the results presented above, the partial rank correlations (PRCs) analyses included only T/FS-S from all three standardized traits of supraorbital robusticity. There were no significant partial correlations between the two traits of the temporal muscle (H-TM/NC-S and L-TM/NC-S) and T/FS-S in both types of models (Tables 6 and 7). The results of the PRCs concerning the first model indicated the presence of a significant (negative, moderate) partial correlation of T/FS-S with only the index of the neurocranial shape (XCB/GOL x 100) (Table 6). In the case of the second model the first of these traits showed a significant (negative, moderate) partial correlation with the same trait and a significant (positive, weak) partial correlation with the TOA of M2s/FS-S (Table 7).
It is worth noting that the results of the additional Spearman’s rank correlation analyses concerning the traits included in the two above-mentioned models indicated a significant correlation between T/FS-S and three traits: the index of the neurocranial shape (negative, strong), the TOA of M1s/FS-S (positive, weak) and the TOA of M2s/FS-S (positive, moderate) (Tables 6 and 7).
| Traitsa | H-TM rs |
p | L-TM rs |
p |
| G | rs = 0.228 | 0.137 | rs = 0.164 | 0.286 |
| S | rs = 0.373 | 0.013* | rs = 0.317 | 0.036* |
| T | rs = 0.400 | 0.007* | rs = 0.354 | 0.018* |
| Traitsa | H-TM/NC-S rs |
p | L-TM/NC-S rs |
p |
| G/FS-S | rs = 0.147 | 0.342 | rs = 0.143 | 0.350 |
| S/FS-S | rs = 0.271 | 0.075 | rs = 0.196 | 0.202 |
| T/FS-S | rs = 0.335 | 0.026* | rs = 0.304 | 0.045* |
a,abbreviations of all these traits are explained in Table 1; rs – Spearman’s rank correlation coefficient; * p < 0.05.
| Traitsa | T/FS-S (p) | H-TM/NC-S (p) | L-TM/NC-S (p) | XCB/GOL x 100 (p) | TOA M1/FS-S (p) |
| T/FS-S | - | -0.603 (0.000)* | 0.363 (0.016)* | ||
| H-TM/NC-S | 0.092 (0.568) | - | 0.642 (0.000)* | -0.470 (0.001)* | 0.076 (0.625) |
| L-TM/NC-S | -0.106 (0.510) | 0.575 (0.000)* | - | -0.489 (0.001)* | 0.187 (0.224) |
| XCB/GOL x 100 | -0.588 (0.000)* | -0.209 (0.190) | -0.231 (0.146) | - | -0.302 (0.046)* |
| TOA M1/FS-S | 0.301 (0.056) | -0.119 (0.458) | 0.060 (0.708) | -0.015 (0.926) | - |
a,abbreviations of all these traits are explained in Table 1; * p < 0.05.
| Traitsa | T/FS-S (p) | H-TM/NC-S (p) | L-TM/NC-S (p) | XCB/GOL x 100 (p) | TOA M2/FS-S (p) |
| T/FS-S | - | 0.412 (0.006)* | |||
| H-TM/NC-S | 0.076 (0.635) | - | 0.164 (0.289) | ||
| L-TM/NC-S | -0.126 (0.432) | 0.576 (0.000)* | - | 0.233 (0.128) | |
| XCB/GOL x 100 | -0.568 (0.000)* | -0.212 (0.183) | -0.221 (0.164) | - | -0.354 (0.019)* |
| TOA M2/FS-S | 0.312 (0.048)* | -0.065 (0.686) | 0.127 (0.430) | -0.069 (0.669) | - |
aabbreviations of all these traits are explained in Table 1; * p < 0.05.
Discussion
The results of the first stage of this study showed a positive relationship between the analyzed traits of the temporal muscle (its height and length) and the degree of massiveness of two supraorbital areas (the superciliary arch and the trigonum). It shows that the examined crania with the higher and longer area of attachment of this muscle exhibited a more robust superciliary arch and trigonum compared to that with a lower and shorter area of the attachment of this muscle. However, the obtained results of the analysis of the correlations between the traits above-mentioned standardized to the neurocranial size and the facial skeleton size (respectively) showed that only the degree of massiveness of the trigonum was significantly correlated to the features of the temporal muscle independently of the size of the examined cranial modules. This shows that the greater the relative height and relative length of the temporal muscle, the higher the relative degree of trigonum robusticity. It suggests that the relationship between the two traits of the temporal muscle and the degree of superciliary arch robusticity described above was only a by-product of the influence of the cranial size. According to the authors’ prediction, the obtained results indicated a lack of importance of the examined features of the temporal muscle for the formation of the massiveness of the glabella as the trait concerning the area located at the greatest distance in relation to these muscles in comparison to other examined supraorbital traits. The strong covariation of the cranial traits that are closely located to each other was also suggested by other authors (e.g., Mitteroecker et al. 2012; Noback and Harvati 2015).
It has been shown by Lahr (1996) that the development of the massiveness of the supraorbital region of the human facial skeleton is related to the activity of the temporal muscle. It has been suggested by her that the development of the superstructures of this region (such as the supraorbital ridge/torus and the zygomatic trigone) is at least partially dependent on the functional mechanisms concerning the masticatory apparatus based on the presence of a significant relationship between the degree of development of these superstructures and the traits of this apparatus (Lahr 1996). It has been indicated by her that the crania of adult representatives of Homo sapiens with larger dimensions of the temporal muscle (e.g., its height, and length) exhibited more pronounced robusticity of the supraorbital ridge (Lahr 1996). The Lahr (1996) study also demonstrated the significance of the height of the temporal muscle and the length of the temporal fossa in predicting the degree of development of the zygomatic trigone. It is worth stressing that the results obtained in our study are only partially congruent with those presented by Lahr (1996) mostly because of the lack of a significant correlation between the relative degree of the superciliary arch massiveness and the relative height and length of the temporal muscle in the examined cranial sample. However, Lahr (1996) analyzed supraorbital traits which, as opposed to our study, were not standardized to cranial size, and examined skulls of adult males and females together. The definitions of the traits of the supraorbital region used by Lahr (1996) were also different from those used in our study (i.e., the degree of the expression of the supraorbital ridge encompassed the glabella and superciliary arch, and the zygomatic trigone included the trigonum and the upper part of the zygomatic bone). These differences in the methodology used by Lahr (1996) in comparison to that used in this study can explain the incongruence described above.
The second stage of our study (concerning the partial rank correlation) showed a lack of a relationship between the relative degree of massiveness of the trigonum and the relative height and length of the temporal muscle, when the influence of the other analysed traits (such as the index of neurocranial shape and the relative occlusal area of the molars – M1s and M2s) on these relationships was excluded. It suggests that the correlations established in the earlier stage of this study between the above-mentioned traits could result from the association of these traits (or one of them) with the shape of the braincase and/or the relative occlusal area of the molars, or with other features that were not included in the analysis. Thus, the relationship between the two traits of the temporal muscle (i.e., standardized to neurocranial size) and the relative degree of the robusticity of the trigonum (i.e., standardized to the size of the facial skeleton) in the examined male cranial sample can be interpreted as examples of covariances of these traits – not as the “true relationship” in the sense of cause and effect. This can be interpreted as a lack of a direct effect of the first type of these traits on the trait concerning the trigonum in the sense of the influence of the forces generated by the temporal muscle with greater height and length of the area of its attachment during the mastication of food on the formation of the robusticity of the trigonum area during the period of facial growth. Further research is needed using a larger sample of adult human crania or living individuals (e.g. using cone beam computed tomography – see Maskos et al. 2022; Merema et al. 2022) including also other features of the temporal muscle such as the assessment of the cross-sectional area of this muscle and the total area of the attachment of this muscle to confirm the results obtained in our study and also to establish if there is no true relationship (in the sense described above) between these traits and the degree of the robusticity of the lateral supraorbital areas of the facial skeleton. Among these traits, the size of the infratemporal fossa was suggested as a good measure of the cross-sectional area of this muscle (Demes and Creel 1988; Noback and Harvati 2015). Taking into account the observation that the force of the muscle is proportional to its whole cross-sectional area (including all fibers) (e.g., Maughan et al. 1983; Weijs and Hillen 1984) inclusion of this trait in future analysis would be very important.
Although there was no significant partial correlation between the index of the shape of the braincase and the relative height and length of the temporal muscle, there were significant, negative and moderate Spearman’s rank correlations between these traits (i.e., the relatively higher and longer temporal muscle was observed in skulls with a narrower and longer neurocranium in comparison to those with a wider and shorter braincase). These correlations could probably have resulted from the presence of the influence of other features that were not included in the models analyzed in this study. It should be stressed that the pattern of interactions of individual structural cranial modules (including structural parts as the sub-modules) during their development and growth has not been fully understood so far, therefore further research is needed that involve a larger number of human skulls and features (Bastir and Rosas 2005; Singh et al. 2012). Noback and Harvati (2015) indicated the presence of covariation between the shape of the temporal muscle and the general shape of the human skulls, explaining this as a result of the localization of the main attachment area of this muscle on the lateral surface of the braincase, suggesting an influence of the shape of the neurocranium on this muscle and vice versa. Thus, this explanation is also most probable in the case of the presence of the above-mentioned negative correlation concerning the analyzed traits of the temporal muscle.
In the case of the index of the shape of the braincase, our results indicated the presence of the strongest partial correlation of this trait with the relative degree of the massiveness of the trigonum (i.e., the narrower the braincase in relation to its length, the greater the relative degree of trigonum robusticity when the influence of the other traits included in the analysis was excluded). The meaning of the shape of the human neurocranium for the formation of the robusticity of the cranial superstructures was suggested by Lahr and Wright (1996), Baab et al. (2010), Nowaczewska et al. (2015, 2022). Thus, the results of this study are congruent with those obtained in other studies. However, Nowaczewska et al. (2015, 2022) included in their analysis only the degree of the massiveness of the glabella and supraorbital arch, not the trigonum, while Baab et al. (2010) and Lahr and Wright (1996) assessed the degree of development of the trigonum with the upper part of the zygomatic bone as the zygomatic trigone. The relationship between cranial robusticity and cranial vault breadth was shown by Lahr and Wright (1996) in the case of Australian crania – the more robust crania indicated the narrower vaults. Thus, our results are congruent with those obtained by them.
In addition, the obtained results showed also a positive and weak correlation between the relative degree of the massiveness of the trigonum and the relative occlusal area of M1s and M2s (i.e., the greater the relative robusticity of the trigonum occurred in the skulls with the larger occlusal surface of the above-mentioned molars, standardized to the size of the facial skeleton, than in those with lower values of these traits). However, there was a significant partial rank correlation between the relative degree of robusticity of the trigonum and only the relative occlusal area of one of these two types of molars – M2s. This suggests that there was a positive relationship between these traits also when the influence of the other traits analyzed in this study, such as the shape of the braincase and the relative height and length of the temporal muscle, was excluded. It also suggests the presence of a “true relationship” between these traits, supporting the localized stress hypothesis concerning, in this case, the meaning of the mastication stresses transmitted through the upper second molars towards the most lateral part of the supraorbital area for the formation of its robusticity. However, it is worth noting that the above-mentioned relationship was weak, and the p-value was close to a non-significance level (p = 0.048). Thus, further study is needed, encompassing a larger sample of human skulls with permanent molars, to confirm this interpretation.
According to the currently dominant view based mainly on the results of studies of living primates (Hylander et al. 1991) regarding the action of the stresses generated during mastication on various areas of their facial skeletons, a weak impact of these forces on the upper (supraorbital) area of their facial skeleton was found. In our study the type of diet, in terms of hardness and composition of the food, such as the amount of animal proteins, was not taken into account as one of the potential factors (Demes and Creel 1988; Von Cramon-Taubadel 2014; Noback and Harvati 2015; Katz et al. 2017). The latter could influence the size of the facial skeleton, the size of the temporal muscles and the degree of massiveness of the trigonum. Although the examined traits of the facial skeleton were standardized to its size and the above-mentioned factor could be more important in terms of the cross-sectional area of temporal muscle compared to the examined traits, the type of diet of the examined groups of humans to which belonged the examined crania should be included in any further studies including more human populations.
Given that the shape of the human braincase and the size of the molar crowns are strongly genetically determined (as was indicated in the case of the first of these traits in other studies concerning cranial dimensions and those concerning the presence of the differences in craniofacial shape between human populations at the early stages of cranial ontogeny (see Gonzalez et al. 2010; Viðarsdóttir et al. 2002; Viðarsdóttir and Cobb 2004)) and in the case of the second of these traits (see e.g. Hillson 1996; Dempsey and Townsend 2001; Townsend et al. 2012), the obtained results suggest a greater importance of genetic factors for the formation of the massiveness of the trigonum in the examined sample of adult male skulls compared to masticatory stress. However, the results of this study suggest also that biomechanical forces concerning the function of the mastication apparatus could influence the massiveness of the trigonum, but to a much lesser degree.
Conclusions
The positive and weak relationships established in this study of the relative height and length of the temporal muscle with only the relative massiveness of the trigonum (from all three examined traits of the supraorbital cranial region) are most probably an example of covariance of these traits, not a “cause-effect” relationship. The obtained results also indicated the greatest importance of the shape of the braincase for the formation of the relative massiveness of the trigonum among the other analyzed features - independent of their potential influence. However, further research is needed to confirm these interpretations in a larger sample of human skulls or leaving individuals using the cone beam computed tomography including other features of the temporal muscle.
Acknowledgements
We would like to thank S. Kozieł and B. Pawłowski for access to human cranial collections and K. Książkiewicz for his help in preparing presented figures and for taking the pictures of the examined teeth.
Conflict of interest
The authors declare no conflict of interest.
Author’s contributions
WN: conceptualization, methodology, investigation, formal analysis, software, validation, interpretation of the data and results, writing of the original draft, project administration, data curation; KG: methodology, investigation, software, writing of the original draft; AC: interpretation of the data; MP: interpretation of the data; UZ-D: interpretation of the data; all authors reviewed and edited the manuscript.
* Corresponding author: Wioletta Nowaczewska, Department of Human Biology, University of Wrocław, S. Przybyszewskiego 63, 51-148, Wrocław, Poland, phone: 665 567 213, e-mail: wioletta.nowaczewska@uwr.edu.pl

