Introduction
Human physical appearance is characterised by a substantial variation in different physiognomic facial features, such as height, skin colour as well as shape of nose, ear, lips. This variation has been explained in terms of biological adaptation, genetic fluctuation, environmental differences and sexual selection. Although it is widely believed that all humans belong to a single species, a considerable variation in various human physical features is observed among individuals belonging to different populations. Investigating this variation has remained a major topic in physical anthropology. Based on the differences and similarities in morphological and physical features, physical anthropologists have divided humans into distinctive ethnic groups. Documenting the vast range of human variability in the historical as well as present populations and identifying the evolutionary and environmental forces responsible for such variation among geographic populations has remained a major objective in many anthropological studies. Wade (2014) suggested that populations of each continent have adapted to their regional environment, and therefore, have developed independently of each other. Thus, human evolutionary history has led to a development of distinctive groups of people exhibiting diverse morphological features around the globe.
Human physiognomic variation, which varies from place to place due to the multiple geographical, genetic and nutritional factors (John 2003), has remained one of the most fascinating research topics in anthropology. The Homo sapiens species comprises several varieties of population groups that inhabit different geographical niches around the globe. Human morphology and its diversity is determined by a collective influence of different genetic processes (mutation, isolation, hybridization) as well as environmental, social, climate and nutritional factors. The adaptive fitness attributed to some genetic traits and their interactions with specific environmental factors determines, to a great extent, the morphological features of an individual. For example, skin colour is an adaptation to a specific environment. Human morphological variation helps to better understand an intricate relationship between structural forms and functions of various parts of the human body. The literature search has revealed that the interest in human biological and cultural variation arose in the 18th and 19th century, following colonial expansion during which Europeans intermixed with non-European populations around the globe (Sundquist 2008).
Somatoscopy is a visual, systematic and cumulative observation of the morphological features of an individual. The external physical characteristics are phenotypically visible variables which are mostly adaptive, but the internal physical characteristics are genotypic characters, which are strictly hereditary and non- adaptive (Jurmain et al. 2013). Historically, individuals of different world populations have been identified on the basis of pigmentation (such as colour of skin, hair, and eyes), shape of the skull, stature, nose and other morphological characteristics. The variation in the colour of hair, skin, and eyes is mainly due to differences in the amount and distribution of melanin pigment. The content of melanin pigment is comparatively more common amongst individuals inhabiting regions near the equator and less common among those living away from equator. The skin pigmentation shows a strong correlation with the ultraviolet radiations intensity, suggesting that the differences in skin pigmentation may result from an adaptation to a particular level of ultraviolet radiation through natural selection (Blum 1961; Loomis 1967; Walter 1971; Branda and Eaton 1978; Kollias et al. 1991; Jablonski and Chaplin 2000).
Skin colour is the primary characteristic that attributes individuals of different ethnic and geographical groups to a certain specific area. Skin colour is not uniform even all over the body of an individual due to various physiological (e.g., arterial or the venous blood supply) and environmental (e.g., exposure to the sunlight) factors that relate to the expression of skin colour. Human ear is also an amazing feature of the face and its size and shape are influenced by age, sex and ethnic origin of an individual (Kalla 1973; Aoki 2002). The shape, size, and orientation of the ear pinna are as unique as fingerprints, and it has been found that men tend to have a larger ear compared to women. The shape of an ear also varies with age as its size increases in both its length and breadth with advancing age; ear size also differs depending on the ethnic group that an individual belongs to (Alexander et al. 2011). Kalcioglu et al. (2003) studied the growth patterns of external ear in different ethnic groups and concluded that growth patterns of the ear are influenced by environmental, genetic and nutritional factors. An ear is an important feature that facilitates identification in forensic anthropology (Neimitz et al. 2007). Human ear is the most defining feature of a face as no two individuals are believed to have identical ear features (Bertillion 1893). Many studies that have used different ear landmarks, such as the length and the breath of ear, concha length, lobule height and attachment of the ear lobule to the external ear, have been quantified with varied accuracy levels and used for human identification (Snell 2004; Standing et al. 2008; Moore and Dalley 2006, 1999). Probably due to the unique variance among individuals, left ear prints are commonly found on the doors, window and glasses (Champod et al. 2001; Egan 1999; Hoogstrate et al. 2001; Lammi 2003; Moenssens 1995).
Ladakh is located at latitude of 32° 15’ to 36° 0’ North and 75° 15’ to 80° 15’ east longitude, and covers 2/3rd area of erstwhile state of Jammu and Kashmir. Kargil is a mountainous region of Ladakh, UT (India), situated at a height of 8780 feet above the sea level with a latitude of 34°33’N and 76°33’E longitude. Ladakh receives very low levels of rainfall, with an average rainfall of 15 inches, and it experiences severe cold in winters. Ladakh, the land of high passes and genetic heterogeneity, is a high altitude desert located at the western tip of Tibetan plateau (more than 3000 meters, on average), and is wedged between two mountain ranges i.e., the Kunlun in the north and the Himalayas in the south (Jina 1996). The Union Territory of Ladakh (in northernmost part of India) presents a unique geographic territory with a wide variety of landscapes ranging from plains to high altitudes. The Union Territory of Ladakh represents a conglomerate of multiple human physical features, cultures, languages and genetic diversity (Singh et al. 2020; Rowold et al. 2016). The population of Ladakh offers a unique human laboratory to study the demographic anthropological history as well as genetic diversity contemporary human population groups in India (Singh et al. 2020). Ladakh inhabitants are exposed to very harsh weather conditions throughout the year and it is considered one of the last region inhabited by prehistoric humans. Genetic studies (based on the patrilineal markers of Y-STRs and Y-SNPs) have found Ladakh population as a diverse genetic mosaic, owing to multiple contributors from the past migratory events. Singh et al. (2020) studied the mitochondrial genome of Ladhakis based on controlled region analysis and revealed that ‘M9’ haplogroup was the most abundant mitochondrial marker. Though both of the studied population groups (the Brokpa and the Purigpa) share a common geographic affinity/territory; their ancestral origins, migration history and settlement in India are vastly different, probably due to the differential demographic movements (Rowold et al. 2016). Because Ladakh is located in a strategic location in the Himalayan region, it has been used as a corridor for the historical trade routes, such as the ancient silk route (UNESCO 2010; Sharma et al. 2018). Nevertheless, Ladakh remains under-represented in the phylogenetic literature. Anthropologically, Ladakh is of a great importance and many scholars feel that Ladakh was a separate entity and was settled by the Mons and Dards of the Aryan race (Tsering 2012). The people of Ladakh consist of various ethnic groups, such as the Brokpa or Dard, the Balti, the Purigpa, the Beda, the Mon, the Garra, the Changpa and the Boto, which are mixture of Indo-Aryan and Tibetan-Mongoloid races (Jina 1996). These ethnics groups are considered as schedule tribes under Article 342 in The Constitution of India, and schedule tribe order of Jammu and Kashmir constitution (1982).
The Ladakhi language has both Mongolian and Indo-Iranian components (Jina 2001; Wirth et al. 2004). It has been argued that the original population of Ladakhi may have been Dard who colonised the western Himalayas via the Indus valley (Jina 2001). However, over 1000 years ago the Dard culture was overwhelmed by immigration of shepherds and nomads from Tibet. In the present day Ladakh, the majority of Muslims are the descendants of Sufi masters from Pakistan who settled in Ladakh after 14th century while the Buddhists are primarily the descendants of Mongolians who bear a close affinity with the Tibetans (Kaul and Kaul 1992; Srinivas 1998).
The main aim of this study is to determine differences and similarities in morpho-facial features of the two tribes that inhabit the same geographical region and are exposed to similar environmental conditions (since last many generations when their ancestors supposedly coming from different routes settled here). To our knowledge, so far there has been no study looking at the affinity in morphological features of the inhabitants. Therefore, this study aims to contribute to the demographic anthropological data for Indian populations.
Material and methods
The present study was conducted on 800 adults (>25years) belonging to two tribes of Kargil (Ladakh) namely the Brokpas and the Purigpas. Four hundred (N=400) healthy individuals from each tribe (221 males and 179 females of the Brokpa and 210 males and 190 females of the Purigpa) were examined and from whom 14 morphological features, using a pre-defined set of observations (Supplementary Table), were measured. Data was collected from two regions of Kargil namely the Suru valley (the Purigpas) and the Batalik sector (the Brokpas) using convenient and snowball sampling methods. The majority of study participants included in the study belonged to the age-group of 30–50 years. Somatoscopic data were collected based on observation by the naked eye with the help of a pre-defined proforma. The morphological observation techniques used in the study were based on the Fischer-Saller Scale (Sharma and Sharma 1997) and the Martin and Schultz eye colour chart (Glinka et al. 2008; Fitzpatrick 1988). Because no standards were available from the literature for other morphological features, the considered in the present study traits and the results were based on direct observations of the participants and were classified arbitrarily for convenience of the investigator. Because morphological features are affected by environment, nutrition and genetic factors, skin colour was measured on the forehead on each study participant, which was covered under the hairs and therefore not affected by sunlight (Fitzpatrick 1975). Before starting data collection, a well-informed written consent was obtained from each study participant, informing the participants about the aims, objectives, and purpose of the study. It was hypothesized that there were no differences in terms of the morphological features between the Brokpas and the Purigpas or between the two sexes of the two tribes independently or combinedly as they were inhabiting the same geographical inhabitation, environment, nutrition and occupations (though their ancestors came from different places/routes to settle here). To test these hypotheses, Pearson correlation coefficient was calculated using the IBM SPSS software (version 21.0) to find any correlation between the frequency distribution of occurrence of different facial features among the Brokpas and the Purigpas. The χ2test was applied to estimate the level of significance of differences in frequency distribution of different studied features between the Brokpas and the Purigpas as well as between males and females of individual tribal groups or in combined (irrespective of sex) population of two groups, using non-parametric tests of the IBM SPSS software (version 21.0).
Ethical clearance was obtained to conduct this study from Panjab the University Institutional Ethics Committee (PUIEC) vide letter no. PUIEC/2017/66/R/06/02 dated: 21/02/2018, and “No Objection Certificate” (NOC) was obtained from the Directorate of Tribal Affairs, Government of Jammu and Kashmir, vide letter no: DTA/ESTT/2016/2043, Dated: 27/2/2017 and District Magistrate, Kargil (J&K) vide letter no: DMK/JC-Misc./2016, Dated: 03/08/2016
Results
The following observations were recorded regarding the morpho-facial physical features of two tribal groups of Kargil (Ladakh, India):
(i) Skin Colour
Individuals of the studied tribal groups (i.e., the Brokpas and the Purigpas) exhibited different skin colour; the dominant skin colour was yellowish (40.75%) and yellowish-white (38.5%) in the Brokpas and the Purigpas, respectively. The differential distribution of various skin colour shades in the two studied groups have been graphically represented in Figure 1. The Brokpas had higher percentage of light-yellowish (19.5%) and light-brown (16.0%) and reddish-brown (14.5%) skin colouration whereas the Purigpas had more prevalence of light-brown (29.75%) or whitish-yellow (21.25%) skin colour pigmentations; such differences in different shades of skin colour between individuals of two groups were statistically significant (χ2 = 208.05; p<0.001), as well as between two sexes of the two tribes (p<0.001).
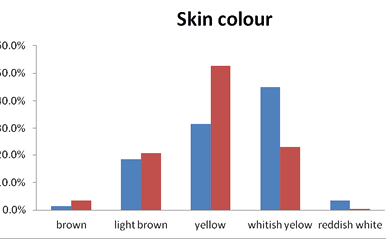
Fig. 1. Frequencies of skin colour shades among the studied Kargil population
(ii) Eye colour
Eye colour varied from black to many other shades among the studied population sub-groups of Kargil (Ladakh, UT). The most dominant eye colour was light-brown, with a frequency of 45. 5% in the Brokpas and 48.75% in the Purigpas. The next predominant eye colour was brown, with a frequency of 41.5% in the Brokpas and 26.2% in the Purigpas. In contrast, the black and the blue-brown eye colour were very rare in the Brokpa and the Purigpa individuals, respectively. The dark-brown eye colour was predominately the Purigpa eye feature whereas the blue-brown colour in the Brokpas iris feature (Figure 2). These differences in shades of eye colour were found statistically significant between individuals of the two sexes of the Brokpas (p<0.001) only. The light-brown colour was the most common (47%) among both the Brokpas and the Purigpas, followed by brown (33.8%) and dark-brown (11.4%) respectively.
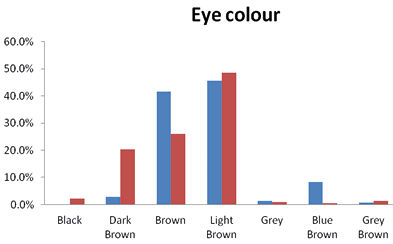
Fig. 2. Frequencies of eye colour among Brokpa and Purigpa
(iii) Hair Form
A substantial variation was found in hair forms among the Brokpas and the Purigpas. A low-waved hair was dominant in the Ladakhi individuals of both the studied population sub-groups (53.6%), followed by straight hair (33.0%), deep-waved (12.4%) and curly (1.0%) hair. The Brokpas had predominately deep-waved hairs (58.75%), followed by straight hair (31.5%) and deep-waved hair (9.75%); no curly hair has been found among the Brokpas. Hair among the Purigpas varied from straight to curly. More than 48.5% of the Purigpas had low-waved hair, followed by straight hair in 34.5%, deep-waved in 15.0% and curly in 2.0% (Figure 3). Thus, the Brokpas had predominately deep-waved hair whereas the Purigpas had more of low-waved hair while curly hair types were found only in the Purigpas. The differences in hair type were found highly significant (p<0.001) between individuals of two sexes of the studied Kargil tribes. The Brokpas had mostly thick beard and moustaches (69.9%), followed by medium (30.9.0%) or scanty beard and moustache. The majority of the Purigpas had sparsely distributed (57.6%) facial hair, followed by thick (23.3%) and scanty (19.1%) facial hair. When individuals of both tribes were considered together, it was revealed that the majority individuals had thick (46.2%) bread and moustaches, followed by medium (43.6%) and scanty (10.2%) facial hair outgrowths. The differences in beard and moustache frequencies among the Brokpas and the Purigpas were found to be statistically significant (p<0.001). The Brokpas had thickly distributed facial hairs compared to the medium facial hair among the Purigpas.
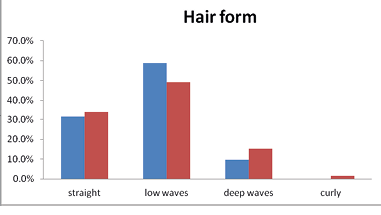
Fig. 3. Frequencies of hair forms among Brokpa and Purigpa
(iv) Nasal forms and septa
In the Brokpas, more than 47.5% participants had downward nasal septum, followed by the horizontal (44.75%) and upward 7.75%. Similarly, 65.3% of the Purigpas had a horizontal type of nasal septum, followed by the downwards (24.2%) or upwards nasal (10%) septa. These differences were statistically significant (χ2= 47.475**). Horizontal was the most predominant form of the nasal septum in the combined Kargil sample of the Brokpas and the Purigpas, followed by 35.8% individuals having downwards nasal septum (Figure 4). Only the Brokpas exhibited statistically significant sex differences in the shapes of nasal septum (p<0.002). The Brokpas had predominately sharper nasal tips (46.0%), compared to 31.2% sharp nasal tips of the Purigpas. When the two groups were combined, the majority of individuals had a medium form of nasal tip (52.6%) followed by the sharp (38.5%) nasal tips.
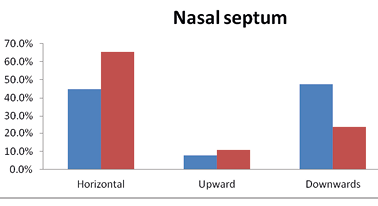
Fig. 4. Frequency distribution of nasal septum among Brokpa and Purigpa
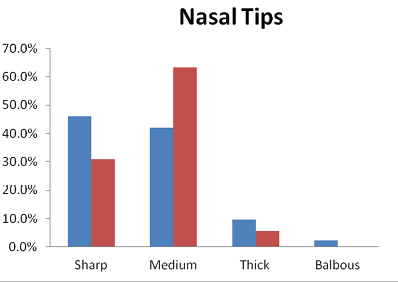
Fig. 5. Occurrence of nasal tips among Brokpa and Purigpa
(v) Lip and Chin forms
A variety of lip forms were observed in the studied population of Kargil. The thin lips were predominately noticed among the Brokpas (98.5%) and the Purigpas (73.25%) when both the males and females were considered collectively, the differences in lip forms between two tribes were found statistically significant (χ2=103.007; p<0.001). Overall, 85.9% of the studied Kargil people had thin lips, followed by the medium (11.0%), everted (2.2%) and inverted (0.9%) lips (Figure 6).
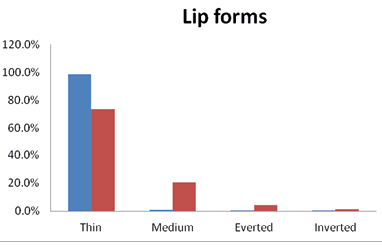
Fig. 6. Frequencies of lip forms among the studied Kargil population
When sex-specific differences were analysed among the individuals of the two tribal groups, no significant sex differences were observed in the lip forms. The chin forms were used to assess morphologic physiognomic facial features of the studied Kargil groups. When individuals of the two sexes were considered jointly, 32% of the Brokpas had a squarish chin, followed by roundish (29.75%), pointed or triangular (16.75%), oval (9.75%), elliptical (4.0%) or rectangular (7.75%) chin forms. Similarly, the majority of the Purigpas had a roundish chin shape (56.0%), followed by oblong (18.75%), oval (15.0%), squarish (9.5%) or rectangular (0.75%) chin forms. The differences in chin forms between the Brokpas and the Purigpas were statistically significant (p<0.001). Squarish chin shapes were found only in the Purigpas. In the combined studied sample, 42.9% of Ladakhis had a roundish chin, followed by squarish (20.7%), oval (12.4%), oblong (11.4%), triangular (8.4%) or rectangular (4.2%) chin forms.
(vi) Epicanthic Eye fold
The presence of the epicanthic eye fold varied greatly among the Brokpas and the Purigpas, probably due to admixture of different ethnic groups/elements in the Ladakh population. About half of the Brokpas (47.5%) had a partial epicanthic fold and 9.0% had a complete epicanthic fold, while the remaining had no presence of any such fold on their eyes. On the other hand, 43% of the Purigpas had a complete epicanthic fold, while 41.75% had a partial fold (Figure 7).
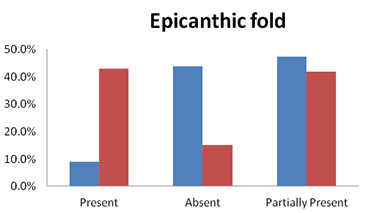
Fig. 7. Occurrence of epicanthic fold among Kargil population
Thus, the Brokpas had predominantly a partial skinfold whereas most of the Purigpas had a complete epicanthic fold. The differences in the frequency distribution of epicanthic fold between the Brokpas and the Purigpas were statistically significant (χ2 = 145.043; p<0.001). When the individuals of two sexes of both the Brokpas and the Purigpas were considered jointly, a complete epicanthic fold was present only in 26.0% of the Kargil individuals, partial fold in 44.5%, and about 29.5% of study participants were lacking an epicanthic fold; thus a distinct predominance of partial epicanthic fold in the studied tribes. Sex-specific differences in the frequency of eye-folds were statistically significant (χ2 = 13.230; p<0.01) in the Brokpas only.
(vii) Prognathism
The Brokpas and the Purigpas showed three stages of prognathism i.e., marked, medium or slight prognathism. Majority of the Brokpas had marked (57.5%) or medium (39.25%) form of prognathism; 54% prognathism in a lower jaw and 46% in an upper jaw. Similarly, 35.0% of the Purigpas had a marked protrusion of the jaw, followed by 57.75% having medium or slight (7.25%) degree of prognathism (Figure 8). The upper jaw was more prognathic (60.75%) in the Purigpas than the prevalence of the lower jaw (39.25%) in the Brokpas; thus, mandibular prognathism was a Brokpa and maxillary prognathism a Purigpa characteristic. The Brokpas had comparatively a more prognathic face compared to the Purigpas; the differences in the degrees of prognathism between two tribes were statistically significant (χ2= 41.64; p<0.001). The differences in the degrees of prognathism relative to the jaw (upper and lower) were also statistically significant. In the combined sample (i.e., when the individuals of both sexes of two population groups were considered jointly), the majority of the Ladakhi had medium prognathism (48.5%), followed by marked (46.25%) prognathism. In addition, maxillary prognathism (53.4%) was more frequent than the mandibular prognathism (46.6%) in the combined population of two sexes of two tribes. Statistically significant sexual differences were found in prognathic features of the Brokpas and the Purigpas (p<0.001).
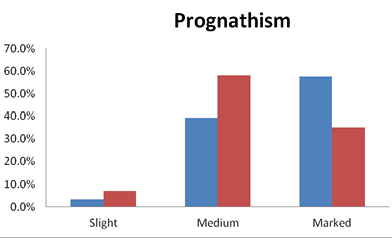
Fig. 8. Occurrence of prognathism among Kargil population
(viii) Ear Lobules
The Brokpas had a higher frequency of free ear lobule (72%) compared to the Purigpas (33.5%) and such differences were statistically significant (p<0.001). In the Brokpas, the predominant shape of the lobule was roundish (43.0%,) followed by tongue shaped (25.75%), arched (25.5%), triangular (5.25%) and rectangular (0.5%) ear lobes in combined sample of both the sexes. The tongue-shaped ear lobe was predominant in the Purigpas (38.25%,) followed by the arched (22.75%), triangular (19.75%) and round (19.25%) shaped ear lobes in both the Purigpas males and females (Figure 9). When all individuals of both the sub-population group were considered jointly, the majority of study participants exhibited tongue shaped ear lobes (32.0%), followed by round (31.13%), arched (24.12%), triangular (12.5%) and rectangular (0.25%). When chi-square test was applied to determine whether ear lobe shape differed between the two sexes of the Brokpas and the Purigpas, these differences were statistically insignificant (for Brokpas, χ2=4.777; p=0.311, and for Purigpas, χ2=2.028; p=0.731).
Ear attachment is also one of the defining features of the face and occurrence of this ethnic trait vary among different population groups. In this study, it was found that the majority of the Brokpa individuals had free or detached ear lobe (66.5%) and it was attached in the rest (33.5%) individuals of both the sexes. Similarly, 61.3% of the Purigpas had attached ear-lobe and in 38.7% individuals it was free or detached in the joint sample of both ethnic groups regardless of sex. When the individuals of both sexes of the Brokpas and the Purigpas were analysed together, it was found that 52.63% of study participants had free or detached and 47.37% had attached ear lobes in individuals of both the sexes. Statistically significant sexual differences were found in attachment or detachment of ear-lobe in the Purigpas and no such differences were found among the Brokpas.
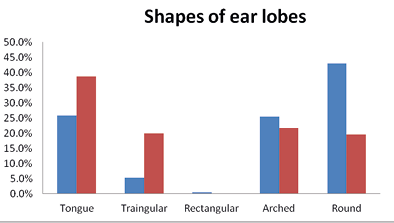
Fig. 9. Shapes of ear lobes among Kargil population
(ix) Darwin Tubercle and Adam’s Apple
The majority of the Brokpas (94.3%) did not have the Darwin tubercle whereas the 34.9% of the Purigpas had this trait. Thus, more Purigpas were having Darwin tubercle than the Brokpas. In the combined population of two tribes, only 20.1% of individuals had this trait and remaining 79.9% were not having this trait and such differences in frequency distribution of Darwin tubercle between the two tribal groups were statistically significant (χ2=104.828; p<0.001). The differences in frequency distribution of Darwin tubercle between two sexes of the Brokpas and the Purigpas were not statistically significant (Figure 10). The Adam apple was found distinctly visible in 40% of the Brokpas and 20.5% of the Purigpas, and it was mildly visible in 39% of the Brokpas and 32% of the Purigpas. A higher percentage of Purigpas had a complete absence of this morphological trait compared to the Brokpas. In the total population of both the tribes, it was distinctly visible among 30.25% individuals, mildly present among 35.5% and was absent in 34.25% individuals (Figure 11). Statistically significant differences were found in the occurrence of Adam’s apple between the Brokpas and the Purigpas (χ2 =70.214’ p<0.001) as well as between two sexes of each Kargil tribe considered (χ2=168.961 for the Brokpas and χ2=76.964 for the Purigpas; p<0.001).
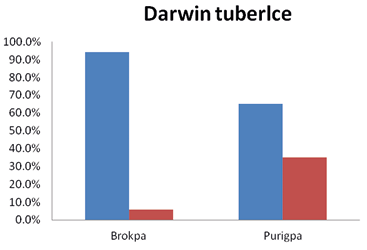
Fig. 10. Occurrence of Darwin tubercle among Brokpa and Purigpa
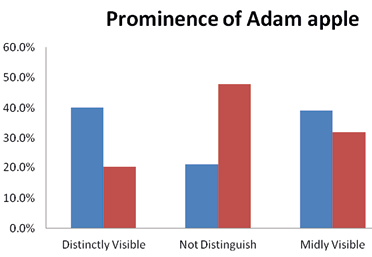
Fig. 11. Frequency distribution of Adam apple among Brokpa and Purigpa
(x) Auricular scaphoid shape
Our results show that the Brokpas and the Purigpas had different shapes and sizes of auricle (Figure 12). Majority of the Brokpa individuals (60%) had scaphoid shaped auricle, followed by long (36.8%) and knob shaped (3.3%) auricle when individuals of both sexes were considered jointly. Among the Purigpas, the majority of individuals had round-shaped auricle (60%), followed by long-shaped (28.8%) and knob-shaped (11.1%) auricular scaphoid in both sexes taken together. In total, the Kargil population of both the tribal groups, the 59.75% of study participants had round-shaped auricular scaphoid, followed by long 28.9% and knob-shaped 11.1% auricle in both the sexes (Figure 13). The differences in frequency distribution of shape of auricular scaphoid were found statistically significant between two population groups (χ2=61.48; p<0.001) and Brokpas males and females only (χ2=9.338; p<0.009).

Fig. 12. Shape of auricular scaphoid among Brokpas (i–ii) and Purigpas (a–b)
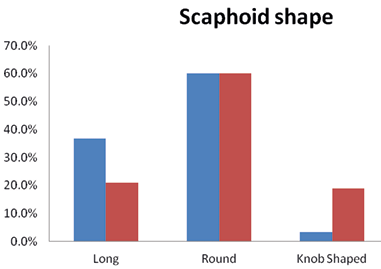
Fig. 13. Occurrence of auricle shape among Brokpa and Purigpa
(xi) Facial shape
Our results show that different facial shapes exist among the Brokpas and the Purigpas (Figure 14). The majority of the Brokpas had long facial shape (60%), followed by oblong (36.5%), rectangular (2.25%) and oval (1.25%) profiles when both the sexes were considered jointly. Among the Purigpas, the majority of individuals had round facial shape (57.75%), followed by long (36.0%), rectangular (5%) and oval (1.25%) shapes when individuals of both the males and females were considered jointly. In total, the Kargil population of both the tribes, the majority of study participants had long facial profile (48.0%), followed by round facial profile (47.1%, rectangular (3.6%) and oval (1.3%) facial contour when both sexes were considered jointly (Figure 15). Highly significant statistical differences were found in the frequency distribution of facial shapes between the Brokpas and the Purigpas (χ2=48.55; p<0.001) as well as between two sexes among the Brokpas (χ2=65.139; p<0.001) and the Purigpas (χ2=8.347; p<0.039).

Fig. 14. Facial shapes in (i) Brokpas and (ii) Purigpas
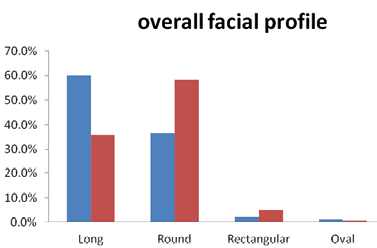
Fig. 15. Overall facial shape/profile among Brokpa and Purigpa
Table 1 shows the output of the Pearson correlation coefficients which highlight the degree of significance of differences in frequency distribution of various non metric variables in studied Kargil population.
| Non-metric traits | Correlation | Skin colour | Hair form | Eye colour | Epicanthic fold | Chin shape | Prognathism | Ear lobe | Ear size | Darwin’s tubercle | Prominence of Adam’s apple | Overall facial profile | Beard and moustache. |
| Skin colour | Pearson Correlation | 1 | |||||||||||
| Sig. (2-tailed) | |||||||||||||
| N | 800 | ||||||||||||
| Hair form | Pearson Correlation | -.047 | 1 | ||||||||||
| Sig. (2-tailed) | .182 | ||||||||||||
| N | 800 | 800 | |||||||||||
| Eye colour | Pearson Correlation | .181** | -.078* | 1 | |||||||||
| Sig. (2-tailed) | .000 | .027 | |||||||||||
| N | 800 | 800 | 800 | ||||||||||
| Epicanthic fold | Pearson Correlation | .126** | -.001 | .105** | 1 | ||||||||
| Sig. (2-tailed) | .000 | .972 | .003 | ||||||||||
| N | 799 | 799 | 799 | 799 | |||||||||
| Chin shape | Pearson Correlation | .130** | -.077* | .080* | .050 | 1 | |||||||
| Sig. (2-tailed) | .000 | .029 | .024 | .157 | |||||||||
| N | 800 | 800 | 800 | 799 | 800 | ||||||||
| Prognathism | Pearson Correlation | -.017 | .011 | -.008 | -.018 | -.054 | 1 | ||||||
| Sig. (2-tailed) | .632 | .764 | .828 | .606 | .128 | ||||||||
| N | 800 | 800 | 800 | 799 | 800 | 800 | |||||||
| Ear lobe | Pearson Correlation | -.032 | .076* | -.116** | -.090* | -.109** | .106** | 1 | |||||
| Sig. (2-tailed) | .360 | .031 | .001 | .011 | .002 | .003 | |||||||
| N | 800 | 800 | 800 | 799 | 800 | 800 | 800 | ||||||
| Ear size | Pearson Correlation | -.082* | -.062 | -.110** | -.061 | -.047 | .067 | .087* | 1 | ||||
| Sig. (2-tailed) | .021 | .078 | .002 | .084 | .185 | .060 | .014 | ||||||
| N | 799 | 799 | 799 | 798 | 799 | 799 | 799 | 799 | |||||
| Darwin’s tubercle | Pearson Correlation | -.051 | .041 | -.112** | -.079* | -.138** | .068 | .322** | -.042 | 1 | |||
| Sig. (2-tailed) | .153 | .243 | .001 | .026 | .000 | .053 | .000 | .234 | |||||
| N | 799 | 799 | 799 | 798 | 799 | 799 | 799 | 798 | 799 | ||||
| Prominence of Adam’s apple | Pearson Correlation | -.024 | -.028 | -.058 | -.049 | -.127** | -.143** | .020 | .153** | .021 | 1 | ||
| Sig. (2-tailed) | .500 | .429 | .100 | .169 | .000 | .000 | .572 | .000 | .561 | ||||
| N | 800 | 800 | 800 | 799 | 800 | 800 | 800 | 799 | 799 | 800 | |||
|
Overall facial profile |
Pearson Correlation | -.109** | .056 | -.124** | -.147** | -.162** | -.013 | .024 | .112** | .073* | .139** | 1 | |
| Sig. (2-tailed) | .002 | .111 | .000 | .000 | .000 | .723 | .492 | .001 | .038 | .000 | |||
| N | 800 | 800 | 800 | 799 | 800 | 800 | 800 | 799 | 799 | 800 | 800 | ||
| Beard and moustache | Pearson Correlation | -.019 | .194** | .100** | .135** | .031 | .194** | .032 | -.146** | -.024 | -.283** | -.262** | 1 |
| Sig. (2-tailed) | .598 | .000 | .005 | .000 | .380 | .000 | .365 | .000 | .506 | .000 | .000 | ||
| N | 800 | 800 | 800 | 799 | 800 | 800 | 800 | 799 | 799 | 800 | 800 | 800 | |
Discussions
Various waves of migration and invasions have resulted in a high cultural, social and genomic diversity observed in India’s population (Bhasin and Nag 2002; Tamang and Thangaraj 2012). Owing to its geographical location, over many millenniums Ladakh has witnessed several ancient migrations and dispersals to and from the mainland India, Northeast Asia, Eurasia and Africa (Bhattacharyya and De 2009; Majumdar 2010; UNESCO 2010). The enormous diversity in cultural, religious and food practices in the Ladakh population may result from congruence of different ancestral groups (Rowold et al. 2016). It is believed that the earliest inhabitants of Ladakh were the ‘Mons’ of Indian descent and the ‘Dards’ from Iran resulting in a composite Indo-Aryan heritage (Jina 1996; Kuzmina et al. 2007). Researches have indicated that the paternal ancestry of Ladakh is genetically diverse and mosaic which have been laid down in multiple time intervals from different sources. (Rowold et al. 2016). The morpho-genetic heterogeneity of different sub-groups of Ladakh may be due to the multi-layered accumulation of demographic episodes (nomadic migration, foreign invasions, seasonal pastoral movements, military campaigns, refugee immigrations and trade) (Gayden et al. 2007). Each of these episodes have left its genetic imprints and somatoscopic signatures spread over the millennia of occupation (Rowold et al. 2016).
It is believed that a single species of Homo sapiens comprises of several varieties of ethnic groups inhabiting different geographical locations around the globe. Human morphology and its diverse characterization is a complex process and its manifestation is determined by the role of multiple genetic (mutation, isolation, hybridization), environmental, cultural, climatic and nutritional factors. The adaptive fitness of some genes/traits and their interactions with environmental factors determine the morphological features of an individual. Hence the population group, such as skin colour, are adaptive and have selected value. The amount of the melanin pigment determines the colour of human skin, eyes and hair. Skin colour in humans has resulted from biological adaptations in response to the environmental conditions in which our ancestors have lived. Fer example, people with fairer skin represent a lineage from ancestors who lived for many generations in colder climates. The processes underlying genetic influence in creating various phenotype/morphological facial features, such as skin, hair and eye pigmentations have been explained by multiple studies (e.g. Kwon et al. 1987; Rinchik et al. 1993; Sturm et al. 2001). However, no such descriptions could be traced for the present study population. Our results show that in the study population the dark hair colour types vary from various shades of brown to black. Microscopic studies on the thickness of hair shaft have shown that coarse hair has the widest diameter while very fine hair has the narrowest. It has been shown that gene P2RY5 gene determines woolly hair (Shimomera et al. 2009). The white-skinned people have average hair shaft diameter less than 70µ, whereas people of Asian origin have thickness between 90 and 100 µ.
Skin colour is a complex biological trait characterized by different shades in diverse population groups inhabiting different parts of the globe. The variation of skin colour is due to the differential distribution of the melanin pigment among individuals of different populations, influenced by various biological, environmental, and genetic factors (Simon et al. 2009). People inhabiting near the equatorial region are exposed to more amount of sunlight and intense ultraviolet light rays producing blackish brown to yellowish-brown skin coloration as skin colour have some adaptive value (Blum 1961; Walter 1971). Hourblin et al. (2014) studied skin colouration patterns among different Indian ethnic groups and found that skin complexion ranges from whitish to brown and fairer in North Indians and, darker in South Indians, probably because heterogenic Indian population possesses different genetic polymorphism for skin colour. Indian studies revealed that measures of skin colour are based on certain classic methods, such as those based on visual observations or comparisons with chart having different shades of skin colour (Buchi 1957; Jaswal 1979). Skin pigmentation is also influenced by sex differences; North Indian Arora and Khatri females were found to have less facultative or inducible pigmentation compared to their male counterparts, probably due to the differences in tanning of skin colour (i.e., due to sun exposure or sunbathing) among the females (Kalla 1968). Lasker (1954) reported that skin colour also varies according to seasonal variations. In the present study, about 41% of the Purigpas had yellowish skin colour whereas 38.5% the Brokpas had whitish-yellow skin colour, followed by light-brown skin colour observed in 39.8% of the Purigpas, 19.5% of the Brokpas had a yellowish colour and about 10.5% of the Brokpas had reddish-brown skin colour. The studied area is located at a high altitude away from tropics with an intense cold season almost throughout the year. Therefore, Kargil individuals have yellowish or reddish-brown skin colour shades quite different from other Indian populations residing in plain areas.
Along with skin colour, hair and its structural features can contribute towards attribution of an individual to any of three major sub-divisions of mankind. The hair shape, texture, quantity, and colour have been used as reliable visual characteristics to classify an individual to a specific ethnic group by different researchers (Kirk 1940; Banerjee 1963). The hair forms may be straight (leiotrichous), wavy (cymotrichous) and curly (ulotrichous). In the present study, more than 56% males and about 62% females among the Brokpas and, 54.1% among the Purigpa males and 42.4% of the Purigpa females had low-waved hair, followed by the straight hair observed among 28.8% male and 34.8% female of the Brokpas in comparison to 23.9% males and 46.6% females of the Purigpa. No curly hair form was found among the Brokpa tribe; however, 2.9% of the Purigpa males had curly hairs, probably due to their biological affinity to the East Asians. Datta and Banerjee (1987) reported the hair form, texture, and hair quality among various population groups of North Eastern Indian population, and found that among the Purum hair varies from wide wavy (5.0%) to shallow-wavy (68.3%), texture varies from fine to coarse (1.7%–95%). They also found that quantity of hair varies from scanty to thick (1.7%–95%). In the Nagas, hair form varied from straight to curly while in the Kacharis from narrow-wavy (6.0%) to smooth (60%).
Eye colour is another useful human morphological trait used by the anthropologists for human differentiations and it varies from population to population due to certain genetic and environmental adaptive conditions affecting the amount of pigmentation present in the iris. It is well known that the European and the West Asians or the Americans have light-brown to blue-eye colour. Family pedigrees analyses have revealed that brown eye colour is dominant over blue among Europeans or White populations (Davenport and Gertrude 1910). Due to the higher amount of pigmentation in the iris of the Africans, their eyes appear to be brown in colour. The East Asians have a medium amount of melanin pigment which imparts light-brown to greyish-brown colour to their eyes. In the present study, eye colour in the studied population groups of Kargil varied from light-brown to blue-brown. The light-brown was the dominant eye colour present in both the studied ethnic groups. The Brokpas had a significantly higher frequency of brown eyes than the Purigpas. Gulati (1990) studied eye colour among six endogamous groups of Tamil Nadu and found that 90% of the Iyers had dark-brown eye colour, followed by 8% brown eye colouration, similarly 68% of the Naidus had dark-brown eye colour, followed by 19% individuals with brown eyes. Among present study individuals, although eye colour varied from light-blue to dark-brown in the combined population groups considered here, the brown eye colour was found dominant, which corresponds to results found among the Iyers and the Naidus of Tamilnadu (Gulati 1990). Among the tribal populations residing in the Himalayas of India, black eye colour was homogenously distributed, although it was heterogeneously distributed among non-tribal individuals of the area. In the present study, the Brokpas had a significantly higher frequency of brown eyes than the Purigpas. On the whole, the Kargil people had brown eye colours of different shades. Compared to darker eyes, blue eyes are better adapted for vision in regions where there is reduced light, as they let in more light. As such, the underlying genetic and environmental factors may be responsible for variations in the eye colour among individuals of the two studied tribal groups of Kargil (India).
We found that there is a significant positive correlation between skin colour and eye colour among both the two tribes. Skin colour also showed a significant correlation with epicanthic fold and chin shape. Another significant positive correlation was found between prominence of Adam apple and chin shape, as well as between beard and moustache with prognathism, beard and moustache with epicanthic fold in males of both tribes and over all facial profile with prominence of Adam apple. Negative correlation was found between eye colour and ear lobe as well as eye colour and Darwin tubercle (Table 1).
The physical features and the metric parameters of the external ear vary in different individuals of two sexes, different ages and ethnic groups (Meijerman et al. 2007). Various morphological characteristics of the human ear, such as size, attachment of lobes, shape of ear lobes, presence of Darwin tubercles, were observed in this study. Various studies have reported variation among the human external ears features and this variation has been used by anthropologists enabling human identification for forensic purposes (Feenstra and Lugi 2000). In some medico-legal context, the body of the deceased victim is recovered in dismembered conditions where the shape, size and morphological features of the ear/s may reveal the identity of the deceased. Also, ear prints left by the human ear on the doors, windows or other substrates can be lifted and developed using advanced techniques in forensic sciences. Ear lobe and its shape have been found to be associated with the geographical and genetic affiliation of a person and it has been found that the Africans have a small ear with little or no ear lobe when compared with other ethnic groups (Sharma 2017). Different shapes and sizes of ear lobes can be found among the different ethnic groups around the globe. The degree of attachment of the ear lobe differs from individual to individual. Many researchers have stated only two types of ear lobes: free and attached (Powell and Whitney 1937). Gabel (1958), on the other hand, classified ear lobe into intermediate, free and attached one. Many studies revealed that the free ear lobe is an autosomally dominant feature (Malhotra and Kanhere 1975; Winchester 1958; Guha 1935). Free ear lobes are mostly found among the European populations. Ear lobe attachment or detachments are features that can be used to investigate the variations among different ethnic groups and it is considered one of the important features of the human face used for recognition or forensic facial reconstruction purposes. Many researchers have reported that differences in ear morphology are due to certain genetic factors that are transmitted from parents to their offspring (Azaria et al. 2003). Some researchers have stressed that ear parameters can also be used for assessing familial relationships as the morphology of ears tends to be hereditary (Imhofer 1906).
Datta and Banerjee (1987) studied the ear lobe presence and its frequency among Indian population and revealed that frequency of free ear lobes varies from 70 to 95% and the free ear lobes tend to increase in Northern and North-eastern individuals, although it tends to decrease in Southern and Eastern Indians. When compared to Chattopadhyay (1968); Dutta and Ganguly (1965) studies the frequency of attached ear lobe in Delhi Jat (18.5%), Brahmins (63.9%) and Muslims (25.49%), and found comparatively much higher in the present study individuals of both the ethnic groups.
A study on North-west Indians found that the shape of the attached ear lobe was squarish in the majority of study participants, followed by the free pendulous ear lobe (Sharma et al. 2007). Similar findings were reported by Munir et al. (2015) on the Quetta population of Pakistan, which revealed that 58.2% of females and 41.8% of males had free ear lobe whereas 61.4% that 50.4% of Tibetans had attached ear lobe. These findings have been supported by the present study which revealed that the Purigpas had higher prevalence of the attached ear lobe compared to the Brokpas. The Brokpas are the Dard people who have an affinity to the Indo-Aryan population and belonged to European ancestry. On the other hand, the Purigpas are the descendants of the Tibeto-Mongoloid population (Rizvi 1996). Among the Newars of Nepal, the frequency of the attached ear lobe was 43.20% and 5.29% of the Newars did not have ear lobule (Bhasin 1969). The prevalence of free ear lobes is higher in the Brokpas than the Purigpas. Similarly, data collected in Manipur showed that individuals of a specific religion had higher frequencies of free ear lobe and they are thought to be European in origin (Shah et al. 2012). Among the Mongoloid-Japanese population, the frequency of the attached ear lobe was found higher (67.1%) in and (64.3%). Dharap and Than (1995) reported that 44.7% of Malaysians were having attached ear lobe which supported the notion that the frequency of attached ear lobes is comparatively higher among Asians compared to European and African populations. The findings of the present study also support the observations that the frequency of the attached ear lobe is highest among the East Asians. In the present study, about 43% of the Brokpas had roundish-oval ear lobe, followed by 25.8% tongue-shaped, 25.5% arched and the least frequency of ear lobe was rectangular (0.5%) in shape. Among the Purigpas, the tongue-shaped ear lobe was predominantly present in 38.7% of study participants, followed by the arched-shaped (22.8%) and the round-shaped (19.5%) ear lobes.
Darwin tubercle is also a unique heritable feature present on the posterior helix of the auricle (Millard and Pickard 1970; Donald 2011). It is thought to be a vestigial trait in modern humans. In the present study, only 8.1% of the Brokpa males and 6.2% of the Brokpas females had Darwin tubercle, whereas among the Purigpas, 37.8% males and 33.5% of females had Darwin tubercle. Thus, the Purigpas had much higher frequencies of Darwin tubercle than the Brokpas. A similar study conducted by Singh and Purkait (2009) on a central Indian population reported that 54–62% of people had Darwin tubercle present in node shape on helix of the auricle, although 54–60% of study participants of central Indian population lacked Darwin tubercle, such as in the present study 60–90% of the Kargil individuals did not have Darwin tubercle. The occurrence of Darwin tubercle varies among different population groups (Loh and Cohen 2016; Tiffany and Cohen 2016). The presence and absence of Darwin tubercle have some evolutionary and anthropological significance regarding studying different morphological features in different ethnic groups (Loh and Cohen 2016; Tiffany and Cohen 2016). Darwin’s tubercle is a benign but unique helical feature which may contribute to the individuality of human ears and may help in personal identification (Tiffany and Cohen 2016). Dharap and Then (1995) reported that among Malaysian males, 17.5% exhibited Darwin tubercle in the right ear and 17.2% in the left ear. In females, on the other hand, 5.5% exhibited Darwin tubercle in the right and 4.1% in the left ear, although no explanation has been given for the right/left asymmetry in the occurrence of Darwin tubercle. Overall, frequency has been reported and an individual having this trait in both side ears was considered as a single case. Among the tribal population of Taiwan, the incidence of Darwin tubercle was 12.8% in females, and it was lesser in males (Chai 1967). The frequency of Darwin tubercle among the Malaysian population is comparatively lower than in the present study of the Purigpas and other Indian studies.
The nose shape and size is also considered as one of the useful criteria used for attributions of individuals to a specific group as it varies among different population groups, between two sexes, and among different age-groups. A long and narrow nose, by facilitating more efficient counter current systems, helps in heat conservation in cold climates. On the other hand, in warmer climates a short and broad nose, by discharging of water vapours, reduces body temperature. People living in cold but dry climates generally have smaller, longer and narrower noses that helps moisten and warm the incoming cold air. The nasal septum of the nose may be upwards, horizontal and downwards. The nasal root may be depressed or otherwise shallow, medium or deep. It has been found that these nasal features depicting the shape and size of the nose show significant sex differences due to significant natural selection pressures and the varied climatic conditions (Van Doom et al. 2009; Zaidi et al. 2018). Nasal tip is also a useful character for the somatoscopic observation of nose, commonly used for classification of major subdivisions in humans. Different types of nose tips have been reported in different populations which are adapted to different and varied climatic conditions (Zaidi et al. 2018). Therefore, the observed differences in nose shapes among individuals of different populations may be due to climatic adaptations and not simply due to genetic drift. Among the Indo-European population, sharp nasal tips are prominent as they have narrower noses compared to Africans and East Asians. Africans mostly has thick and bulbous nasal tip whereas, in East Asians, the nasal tip is medium shaped. A nasal tip among different populations varies and in the present study, 47.5% of the Brokpas had downwards nasal septum, followed by 44.8% horizontal and the remaining 7.8% had upwards nasal tips. In the Purigpas, 65.3% of study participants had a horizontal nasal septum, followed by 24.2% downwards, and 10.6% as downwards nasal tips. Among the Iranians population, horizontal nasal tips were prominently present in 94.3% of individuals, followed by 3.1% downwards and the rest 2.5% downwards nasal tips (Zolbin et al. 2015). Thus, the Brokpas and Purigpas were having different nasal shapes (Figure 16).

Fig. 16. Nasal shapes among (i–ii) Brokpas and (a–b) Purigpas
Lip form, which refers to the thickness of lips, ranges from thin, thick, inverted and diverted or puffy types. It is an important morphoscopic characteristic used in classifying individuals to certain groups. Individuals adapted to different environmental conditions have different lip forms to help facilitate heat balance in a particular environment. In a hot environment, thick or everted forms of lips help in heat loss due to its increased surface area, such as in people of African origin. Thin lips help to conserve body heat due to its decreased surface area in the colder environment, such as among Europeans. In the present study, 98.6% of males and 98.3% of females of the Purigpas, and 72.2% of males and 74.9% of females of the Brokpas, had thin lips, thus showing their affinity toward western Europeans. Bindal et al. (2015) reported that 40% of males and 40% of North Indians females had medium lip from, followed by 24% and 36.67% thin lip forms in males and females respectively; no puffy lips were reported in the present study. The shape of lips has become a famous beautification characteristic and lip enhancement has become a common practice in many western countries.
Epicanthic fold, i.e., a deposition of fat around the eyeball, is a characteristic of Siberian Asians, Inuits, and others those living at the arctic. Epicanthic fold is one of the biological characteristics of the Asian population in which the skin fold hangs over the free edges of the entire upper lid and conceals it thoroughly and extends from the outer corner to the inner corner (Haddon 1924). In East Asians, the shape of the epicanthic fold varies from partial to complete fold. This fold helps in adaptation to cold climates and fats deposited around the eye give insulation to eyeball and sinuses as well as prevent eyeball from sharp glare of ultraviolet radiations reflected from snow blindness, and freezing winds (Coon et al. 1950; Blackburn 2000). In the present study, 43% of the Purigpas had distinct epicanthic fold; however, majority of the Brokpas had partial epicanthic fold (47.3%). A similar study on the double eyelid in Malays and Chinese by Lu et al. (2017) reported that 81.3% of Chinese and 70.1% of Malays exhibited double eyelids, which is also called Mongolian-fold or epicanthic fold. These findings are supported by our study showing that among Mongolian fold was predominantly present at the Purigpas, which is considered as Tibetan descendent tribal group; while lower in the Brokpas whose ethnicity has been traced from Indo-Aryan Western European descendants (Francke 2008). The epicanthic fold is an adaptation for protecting the eyes from the hard driving snow or snow glare.
Pattern, density, and distribution of beard and body hairs vary in different ethnic groups (Loussouarn et al. 2005). It is well known that the Western Europeans and the West Asians have abounded beards on their faces, and the East Asians have very scanty or no beards on their faces which might have been affected by their genetic as well as geographical conditions or androgenic factors. In the present study, 68.4% of the Brokpa males had thick beards and moustaches, followed by medium 30.2% beards. However, 57.8% of the Purigpa males had medium beards and moustaches on their face, followed by thick beard types among 22.9% individuals; thus, the Brokpas had more thick facial hairs.
Conclusions
Studying human physical and genetical variations along with their environmental influences have remained the major focus in anthropological research. People inhabiting high mountains show a variety of biological adaptations in response to the adverse environmental conditions. Though human physical characteristics are determined by genetics, sufficiently long periods of inhabiting specific climatic conditions provided selective pressure to develop particular characteristics within populations inhabiting different geographic parts of the world. In present study, statistically significant differences occurred between the Brokpas and the Purigpas of Kargil (UT, India) with respect to the frequencies of their skin colour, hair form, facial contour/profile, nasal types and presence/absence of epicanthic fold, prognathism, Darwin’s tubercle, Adam’s apple, scaphoid, attached ear lobe. The whitish yellow skin colour, thick beards and moustache, downwards nasal septum, sharp nasal tip, squarish facial contour, partial epicanthic fold, distinctly marked mandibular prognathism, free ear lobe, round scaphoid, prominent Adam’s apple, were the Brokpa morphological traits. On the other hand, the rounded facial form, complete epicanthic fold, maxillary prognathism, and attached ear lobe were the most predominant morphological traits among the Purigpa. Significant sexual differences were found regarding skin colour, eye colour, hair form, nasal septum, nasal tip, epicanthic fold, ear lobe, and Adam apple among the Brokpas and for skin colour, eye colour, ear lobe attachment, hair form, and prognathism among the Purigpas. Individuals of two tribes occupy almost similar geographical terrain (mountainous region) and have been exposed to similar climatic and nutritional factors since many generations. Therefore, the reasons behind the observed morphological differences may reflect differences in genetics as they trace their affinity origins separately to two different ancient populations. The Brokpas are considered Dard people who link their affinity to the Indo-Aryan population of Western European ethnicity whereas the Purigpas are believed to be the descendants of the Tibeto-Mongoloid population (Rizvi 1996). The majority of the morphological traits of the Brokpas and the Purigpas endorse the Western European and East Asian ethnic relationships respectively. which needs to be supplemented with a larger and compressive study with regards to their genetic characteristics. Our study results of the morphological features of Ladakhi individuals will add to the existing literature about the anthropological characteristics of different ethnic groups of India.
Acknowledgement
Authors are highly thankful to all the participants for taking part in this study. The corresponding author is highly thankful to DST-SERB, New Delhi for the financial supports in the form of ‘Core Research Grant’ (Animal Sciences) vide Grant No SERB/F/4790/2018-2019, which helped in conceptualization and designing of present study. Second author is thankful to UGC-BSR, New Delhi for providing funds to collect data in the form of BSR fellowships (no. f.25-1/2014-15 (BSR)/3-15/2001).
Conflict of interests
There is/are no potential conflicts of interest for publication of this manuscript.
Authors’ contribution
JSS conceptualized the concept, analysed and interpreted the data/results, drafted, prepared and edited the manuscript, responded to and incorporated the reviewers’ and Editor comments/suggestions in final manuscript, communicated with the journal.
MA collected raw data from the field, tabulated data, got statistics applied to data, helped in drafting and preparing preliminary version of manuscript.
* Corresponding author: Dr. J.S. Sehrawat, PhD, PGDFS, Assistant Professor, Department of Anthropology, Panjab University, Chandigarh, India 160014, e-mail: jagminder@pu.ac.in
 https://orcid.org/0000-0001-7333-9118
