 https://orcid.org/0000-0002-9686-0907
Introduction
All around the world, humans have striking variations in body sizes. In terms of an evolutionary and biogeographical context, the variation in human body size results from the worldwide distribution of human populations, exposure to multiple environments, evolutionary forces, and from complex forms of cultural behavior (Little 2020). The population of indigenous people is estimated to be only about 400 million people worldwide, but represents an extraordinary cultural diversity (Funk et al. 2020). As a very diverse country, Indonesia has different ethnic groups, who can be classified as indigenous peoples. The population census by the Central Statistics Agency in 2010 revealed that Indonesia has around 1,300 ethnic groups, as reported in the official website of the Ministry of State Secretariat (Central Statistics Agency 2021). These ethnic groups not only show differences in daily customs, but also have distinctive morphological characteristics.
There are many ethnic groups living in Eastern Indonesia, particularly in the islands of Sulawesi, Nusa Tenggara (including Bali), Maluku and Papua, and those who live across the Wallace line. The Wallace line runs through an area between the Sunda and Sahul plains, where the islands of Sulawesi, Nusa Tenggara and Maluku lie. This area is geographically unstable and is bounded by the deep sea with the two landmasses. Given its geographical location, this area serves as a faunal boundary of the two landmasses. Therefore, the Wallace line, plays a crucial role in the migration of Indonesian fauna between Sunda and Sahul landmasses. It also influenced the spread of humans. Indonesian territory is inhabited by two kinds of people namely the Australomelanesoid and the Mongoloid (Jacob 1967; 1974). The first live mostly in eastern Indonesia, the second reside in the western and northern parts of Indonesia. However, there is a mixture that blurs of the boundary between the two types, particularly in the area of the Wallace line, that serves as a central turning point between eastern and western Indonesia.
Research on human variation in the Southeast Asian islands (including the Wallacea area) has long been the subject of various strategies of scientific inquiry that urged researches in natural history, medicine, physical anthropology and genetics in the 19th and 20th centuries to explain variations in human types (Sysling 2019). The history of Western anthropologists research in the Wallace line region, namely in Nusa Tenggara (Timor, Flores and Sumba Islands) aimed to find out whether the Wallace line can more accurately define the measurements of human body. This research began in 1891 when the Dutch anthropologist Herman ten Kate conducted research on Flores and its surrounding islands (Semau, Roti, Sawu, Sumba, Solor and Adonara). Anthropometric measurements were conducted on 1,318 people at that time and revealed the characteristics of the Negro in the highlanders of Flores Island, despite the strong heterogeneity (the presence of other racial characteristics, such as Hindus and American Indians) and prominent differences with Sumbanese. After two decades, Hendrik Bijlmer, Doeke Brouwer and Wilhelmina Keers began studying the body size of humans living all over the Timor islands. Bijlmer measured hundreds of people in eight different places in Timor, Flores and Sumba and discovered Melanesian elements in the people of Timor and Flores, while Melanesian influence was absent in Sumbanese, as was found earlier by ten Kate. In the 1930s, Doeke Brouwer, a military doctor residing on the island of Alor, east of Flores, studied the people of Alor and Pantar. Brouwer classified them in general as Melanesians with mostly Papuan characteristics and those with pre-Malay influences summarized (Sysling 2019). From these studies, Sysling (2019) concluded that there was still an unclear marker that can accurately measure the differences between Melanesian (Papuan) and Malay elements in the region. Hence, it is necessary to conduct research on the bodily characteristics of people in the Wallace Region to explain their variation.
This paper aims to present and discuss anthropometric characteristics of four indigenous populations or ethnic groups known as isolates living in Wallacea including the following: Naulu, Tana Ai, Bugis, and Rampasasa. Naulu live in the Rouhua hamlet, Sepa village, Masohi district, Central Maluku on the island of Seram, Maluku. Tana Ai live in the Tuabao hamlet area, Natarmage village, Talibura sub-district, Sikka Regency, East Nusa Tenggara. Bugis live in the hamlet of Salimbongan, Ulusaddang village, Lembang sub-district, Pinrang district, South Sulawesi, while Rampasasa people live in the Rampasasa hamlet, Waerii district, Waemulu villa, Manggarai regency on Flores Island.
Anthropometric characteristics are the easiest element to observe in individuals. Their variation is attributed to many factors including genetics and the environment, diet, physical activity, geography, lifestyle, disease and socioeconomic conditions (Lin et al. 2004; Yusof et al. 2007; Ashizawa et al. 2009; Iseri and Arslan 2009; Chuan et al. 2010; Karmegam et al. 2011; Luo et al. 2019; Funk et al. 2020). Several studies highlighted significant variations in several body dimensions in different nations, and ethnicities. Lin et al. (2004) compared 33 body dimensions and 31 body proportions in 4 different ethnicities in East Asia, namely the Chinese, Japanese, Korean and Taiwanese populations. The research shows that there are ethnic differences in the variation of body dimensions and proportions. Likewise, Khadem and Islam (2014) in their study of the male Bangladeshi population found significant differences in the body shape of male populations in different countries, such as India, Sri Lanka, Singapore, Portugal, and the Netherlands. However, Iseri and Arslan (2009) in their research on the Turkish population from 7 different geographical areas found that despite their relatively close ethnicity and substantially different cultures and social conditions, there were no considerable differences in the 36 anthropometric measurements taken, except for very significant weight differences. Meanwhile, in the Indonesian population, a study conducted by Wibowo et al. (2012) on Javanese and Madurese showed that the average body of Javanese and Madurese male farmers were smaller than those of Indian and Thai male farmers. Chuan et al. (2010) compared 37 body dimensions between Indonesians and Singaporeans and disclosed that there were significant differences between the 37 body dimensions in both populations.
Regional variations in anthropometric measurements are always present, even among people within an ethnic group. Widyanti et al. (2015) measured 38 body dimensions in 3 major ethnicities in Indonesia, namely the Minangkabau, Sudanese (West Java), and Javanese (Central Java and East Java) and identified significant differences in several body dimensions and proportions between these populations. This research supports the ethnic differences in anthropometric data in Indonesia. Currently, there are still few ethnic anthropometric databases in Indonesia because there are only few studies on anthropometry concerning ethnicity and indigenous people. This condition highlights the need to study the anthropometric characteristics of the four indigenous populations namely the Naulu, Tana Ai, Bugis and Rampasasa, who live in the Wallace line area, as a way to complement the need for ethnic anthropometric data in Indonesia. It is expected that this database can serve as a reference for ethnic anthropometric data in Indonesia in tracing the ancestors of eastern Indonesians, as well as comparison to ethnic groups in other countries.
Materials and methods
The research was conducted in four areas of East Indonesia in 2005 (Figure 1). The research subjects were 484 indigenous peoples consisting of 219 males and 265 females, aged between 18 and 80 years. They were divided into 4 samples:
- The Naulu consisting of 62 males and 53 females.
- The Tana Ai consisting of 54 males and 70 females.
- The Bugis consisting of 65 males and 99 females.
- The Rampasasa consisting of 38 males and 43 females.
The Naulu population lives in Amahai Regency in Seram Island, Central Maluku, the population of Tana Ai in Sikka, East Nusa Tenggara, the Bugis population in Pinrang Regency, South Sulawesi, and the Rampasasa population in Waerii Waemulu village, Manggarai Regency of West Flores.
Anthropometric measurements
Anthropometric measurements of all subjects were taken by including height (vertical distance from the vertex to the floor with the subject standing upright, using an anthropometer with an accuracy of 1 mm), body weight (body mass measured when the subject was standing using a body weight scale with an accuracy of 0.1 kg), sitting height (vertical distance from the vertex to the seat with the subject sitting using an anthropometer with an accuracy of 1 mm), biacromial width (horizontal distance between the right and left acromial with the subject standing upright using a spreading caliper with an accuracy of 1 mm) and bicristal width (horizontal distance between right and left iliocristale with the subject standing upright using a spreading caliper with an accuracy of 1 mm), trunk length (vertical distance from the suprasternale point to the symphision point with the subject standing upright, using an anthropometer with an accuracy of 1 mm), and leg length (vertical distance from trochanterion point to floor with the subject standing upright, using an anthropometer with an accuracy of 1 mm). Anthropometric measurements were conducted according to the measurement instructions of Norton and Olds (2004). The anthropometric indices were calculated, including the cormic index, trunk index, biacromial index, bicristal index and acromio-iliac index (Olivier 1969), and body mass index (BMI) according to the World Health Organization (WHO) classification (2007). The study has been approved by the Research Ethics Committee, Faculty of Medicine, Public Health and Nursing Universitas Gadjah Mada.
| Variables | Naulu (62) | Tana Ai (54) | Bugis (65) | Rampasasa (38) |
| Means ± SD | Means ± SD | Means ± SD | Means ± SD | |
| Age (years)a*, b**, f** | 35.3 ± 13.2h | 41.6 ± 12.6g | 46.6 ± 13.2h | 38.9 ± 14.8 |
| Weight (kg)a**, c**, d**, f** | 52.6 ± 5.3h | 45.6 ± 6.1h | 51.6 ± 6.8h | 44.6 ± 4.9h |
| Standing height (cm)b**, c**, d*, e**, f** | 158.9 ± 4.9h | 157.9 ± 6.8h | 155.8 ± 6.6h | 150.1 ± 3.3h |
| Sitting height (cm)a**, b*, c**, d**, f** | 81.2 ± 2.8h | 77.9 ± 3.1h | 79.7 ± 3.8h | 76.9 ± 3.4 |
| Shoulder breadth (cm)a**, c**, d**, e**, f** | 35.4 ± 1.9h | 31.4 ± 1.9h | 36.2 ± 3.8h | 33.6 ± 1.6h |
| Hip breadth (cm)b**, d** | 23.9 ± 1.5 | 23.7 ± 1.8 | 24.8 ± 1.9h | 24.5 ± 1.8h |
| Trunk Length (cm)d* | 50.9 ± 3.3h | 51.2 ± 4.2h | 49.8 ± 3.4h | 50.7 ± 3.4h |
| Leg Length (cm) b**, c**, d**, e**, f** | 85.5 ± 4.1h | 85.4 ± 4.3h | 83.4 ± 4.3g | 78.1 ± 3.1h |
| BMI (kg/m2) a**, c**, d**, e**, f** | 20.8 ± 1.7 | 18.2 ± 1.9 | 21.2 ± 1.9 | 19.6 ± 1.8 |
| Cormic Index (%) a**, d**, e** | 51.1 ± 1.4 | 49.4 ± 1.7h | 51.2 ± 1.6h | 50.9 ± 1.6h |
| Trunk Index (%)c**, e**, f** | 32.0 ± 1.8h | 32.4 ± 2.0h | 32.0 ± 1.7h | 33.6 ± 1.9h |
| Acromial Index (%) a**, b**, d**, e**, f** | 22.3 ± 1.0h | 19.9 ± 1.2h | 23.3 ± 1.5 | 22.2 ± 1.0h |
| Iliocristal Index (%) b**, c**, d**, e** | 15.0 ± 0.9h | 15.0 ± 1.1g | 15.9 ± 1.2h | 16.2 ± 1.1h |
| Acromiocristale Index (%) a**, c**, d**, e**, f** | 67.7 ± 5.5h | 75.6 ± 5.6h | 68.9 ± 5.2 | 73.2 ± 6.7h |
*p<0.05; **p<0.01; adifference between Naulu and Tana Ai; bdifference between Naulu and Bugis; cdifference between Naulu and Rampasasa; ddifference between Tana Ai and Bugis; edifference between Tana Ai and Rampasasa; fdifference between Bugis and Rampasa; BMI: Body mass index; gp<0.05 difference between male and female; hp<0.01 difference between males and females
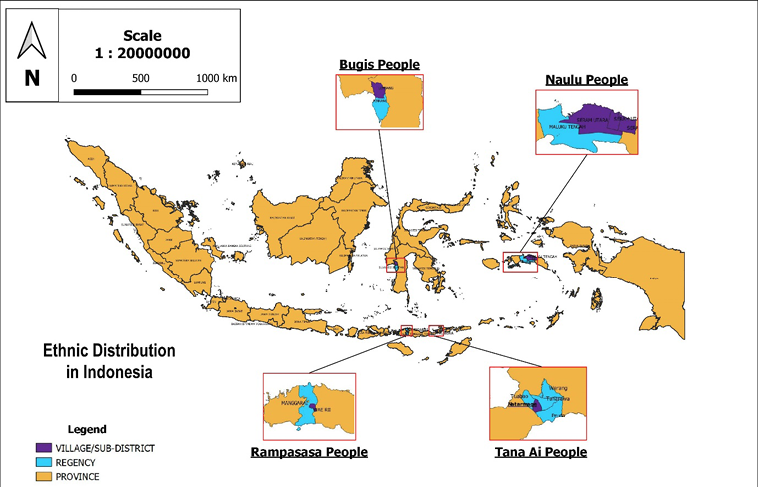
Fig. 1. Map of Indonesia
The one-way ANOVA was used for the statistical analysis with the LSD post hoc test to compare anthropometric characteristics between populations and the independent T-test to determine differences between the sexes in the population, with a significance value of p <0.05.
Results
Descriptive statistical anthropometric data for the Naulu, Tana Ai, Bugis and Rampasasa tribes are listed in Tables 1 and 2, while the anthropometric indices data are shown in Tables 3 and 4. Of the 4 indigenous peoples, it was observed that the Tana Ai and Bugis males weighed significantly more (p<0.001) than the Naulu and Rampasasa males. The Naulu males had the average height (158.9 cm), while the Rampasasa males had the lowest measurements in terms of weight and height (44.6 kg and 150.1 cm), sitting height (76.9 cm), and leg length (78.1 cm). The smallest shoulder size (31.4 cm) was found in the Tana Ai males, while Naulu males had the largest sitting height measurement (81.2 cm). The male BMI category in the 4 populations showed normal nutritional status ranging from 18.2 to 21.2. At this point, it can be concluded that Naulu males have the largest body size, while Rampasasa males are the smallest (Table 1).
| Variables | Naulu (53) | Tana Ai (70) | Bugis (99) | Rampasasa (43) |
| Means ± SD | Means ± SD | Means ± SD | Means ± SD | |
| Age (years)a*, b**, c** | 26.3 ± 6.3 | 35.8 ± 14.0 | 38.2 ± 13.2 | 40.0 ± 19.0 |
| Weight (kg)a**, c**, d**, f** | 47.3 ± 6.9 | 39.6 ± 6.4 | 48.4 ± 7.7 | 40.4 ± 6.5 |
| Standing height (cm)c**, e**, f** | 148.5 ± 3.9 | 148.3 ± 4.5 | 148.5 ± 5.2 | 143.4 ± 5.4 |
| Sitting height (cm)a**, b*, d**, f** | 76.5 ± 2.7 | 74.9 ± 2.4 | 77.3 ± 3.1 | 75.8 ± 4.2 |
| Shoulder breadth (cm)a**, c**, d**, e**, f* | 31.4 ± 1.6 | 27.9 ± 1.9 | 30.9 ± 2.0 | 30.2 ± 1.7 |
| Hip breadth (cm) a*, b*, d**, e**, f** | 23.8 ± 1.8 | 23.0 ± 2.0 | 23.1 ± 2.1 | 25.9 ± 1.8 |
| Trunk Length (cm) a**, b**, c**, e**, f** | 41.8 ± 2.1 | 45.4 ± 2.9 | 47.8 ± 3.3 | 44.6 ± 3.6 |
| Leg Length (cm) a*, c**, e**, f** | 82.9 ± 2.8 | 81.4 ± 3.6 | 82.1 ± 3.3 | 75.7 ± 3.3 |
| BMI (kg/m2) a**, c**, d**, e**, f** | 21.4 ± 3.0 | 17.9 ± 2.5 | 21.9 ± 3.2 | 19.6 ± 2.6 |
| Cormic Index (%) a**, c**, d**, e**, f** | 51.5 ± 1.4 | 50.6 ± 1.5 | 52.0 ± 1.3 | 52.8 ± 1.8 |
| Trunk Index (%) a**, b**, c**, e**, f** | 28.2 ± 1.3 | 30.6 ± 1.7 | 32.2 ± 1.8 | 31.1 ± 1.9 |
| Acromial Index (%) a**, d**, e** | 21.1 ± 1.0 | 18.9 ± 1.1 | 20.8 ± 1.2 | 21.1 ± 1.1 |
| Iliocristal Index (%) a*, b*, c** | 16.1 ± 1.2 | 15.5 ± 1.3 | 15.6 ± 1.4 | 18.1 ± 1.2 |
| Acromiocristale Index (%) a**, c**, d**, e**, f** | 76.1 ± 4.9 | 82.6 ± 7.7 | 74.8 ± 6.7 | 86.0 ± 6.4 |
*p<0.05; **p<0.01; adifference between Naulu and Tana Ai; bdifference between Naulu and Bugis; cdifference between Naulu and Rampasasa; ddifference between Tana Ai and Bugis; edifference between Tana Ai and Rampasasa; fdifference between Bugis and Rampasa; BMI: Body mass index; gp<0.05 difference between male and female; hp<0.01 difference between males and females
The anthropometric data for the female group in these four populations indicate that the Rampasasa females had the shortest height (143.4 cm) and leg length (75.7 cm), but had the widest hip size (25.9 cm). The smallest shoulder size was found in the Tana Ai female (27.9 cm), the shortest trunk was in the Naulu female (41.8 cm), while the longest trunk was in the Bugis female (47.8 cm). The BMI category in the females of the four populations showed normal nutritional status, except for the Tana Ai females who were classified in the underweight category (Table 2). At this point, it can be said that the Rampasasa females had the smallest body size, while the Tana Ai females had a poor nutritional status (Table 2).
Sexual dimorphism was evident in every population in this study as seen from the significant differences between males and females from the 4 populations. Significant differences (p<0.01) between males and females in the same population were found in height, weight, sitting height (except for the Rampasasa tribe), shoulder width, hip width (except for the Tana Ai and Naulu tribes), trunk length, leg length, cormic index (except for the Naulu tribe), trunk index (except for the Bugis tribe), acromial index, iliocristalis index (except for the Bugis tribe), and acromiocristalis index (p<0.001).
| Variables | Naulu (62) | Tana Ai (54) | Bugis (65) | Rampasasa (38) |
| N (%) | N (%) | N (%) | N (%) | |
| BMI (kg/m2) | ||||
| Underweight | 4 (6.5%) | 22 (40.7%) | 3 (4.6%) | 8 (21.1%) |
| Normal | 50 (80.6%) | 31 (57.4%) | 50 (76.9%) | 27 (71.1%) |
| Obesity | 8 (12.9%) | 1 (1.9%) | 12 (18.5%) | 3 (7.8%) |
| Cormic Index (%) | ||||
| Brachycorm | 26 (41.9%) | 44 (81.4%) | 30 (46.2%) | 18 (47.4%) |
| Mesocorm | 33 (53.2%) | 9 (16.7%) | 24 (36.9%) | 17 (44.7%) |
| Macrocorm | 3 (4.9%) | 1 (1.9%) | 11 (16.9%) | 3 (7.9%) |
| Trunk Index (%) | ||||
| Short trunk | 1 (1.6%) | 0 | 0 | 0 |
| Medium trunk | 5 (8.1%) | 6 (11.1%) | 7 (10.8%) | 2 (5.3%) |
| Long trunk | 56 (90.3%) | 48 (88.9%) | 58 (89.2%) | 36 (94.7%) |
| Acromial Index (%) | ||||
| Narrow | 22 (35.5%) | 52 (96.3%) | 7 (10.7%) | 12 (31.6%) |
| Medium | 25 (40.3%) | 2 (3.7%) | 20 (30.8%) | 17 (44.7%) |
| Broad | 15 (24.2%) | 0 | 38 (58.5%) | 9 (23.7%) |
| Iliocristal Index (%) | ||||
| Dolichopelvic | 54 (87.1%) | 43 (79.6%) | 32 (49.2%) | 14 (36.8%) |
| Mesopelvic | 8 (12.9%) | 10 (18.5%) | 26 (40.0%) | 23 (60.6%) |
| Brachypelvic | 0 | 1 (1.9%) | 7 (10.8%) | 1 (2.6%) |
| Acromiocristale Index (%) | ||||
| Trapezoidal trunk | 42(67.7%) | 8 (14.8%) | 43 (66.2%) | 6 (15.8%) |
| Intermediate trunk | 15 (24.2%) | 14 (25.9%) | 11 (16.9%) | 15 (39.5%) |
| Rectangular trunk | 5 (8.1%) | 32 (59.2%) | 11 (16.9%) | 17 (44.7%) |
| Variables | Naulu (53) | Tana Ai (70) | Bugis (99) | Rampasasa (43) |
| N (%) | N (%) | N (%) | N (%) | |
| BMI (kg/m2) | ||||
| Underweight | 5 (9.4%0 | 36 (51.4%) | 6 (6.1%) | 12 (27.9%) |
| Normal | 33 (62.3%) | 32 (45.7%) | 63 (63.6%) | 27 (62.8%) |
| Obesity | 15 (28.3%) | 2 (2.9%) | 30 (30.3%) | 4 (9.3%) |
| Cormic Index (%) | ||||
| Brachycorm | 21 (39.6%) | 48 (68.6%) | 27 (27.3%) | 11 (25.6%) |
| Mesocorm | 13(24.5%) | 10 (14.3%) | 24 (24.2%) | 2 (4.6%) |
| Macrocorm | 19 (35.8%) | 12 (17.1%) | 48 (48.5%) | 30 (69.8%) |
| Trunk Index (%) | ||||
| Short trunk | 24 (45.3%) | 1 (1.4%) | 2 (2.0%) | 2 (4.7%) |
| Medium trunk | 26 (49.1%) | 24 (34.3%) | 5 (5.1%) | 8 (18.6%) |
| Long trunk | 3 (5.6%) | 45 (64.3%) | 92 (92.9%) | 33 (76.7%) |
| Acromial Index (%) | ||||
| Narrow | 44 (83.0%) | 70 (100%) | 81 (81.8%) | 33 (76.8%) |
| Medium | 8 (15.1%) | 0 | 14 (14.1%) | 9 (20.9%) |
| Broad | 1 (1.9%) | 0 | 4 (4.1%) | 1 (2.3%) |
| Iliocristal Index (%) | ||||
| Dolichopelvic | 19 (35.8%) | 43 (61.4%) | 62 (62.6%) | 0 |
| Mesopelvic | 34 (64.2%) | 23 (32.9%) | 33 (33.3%) | 18 (41.9%) |
| Brachypelvic | 0 | 4 (5.7%) | 4 (4.1%) | 25 (58.1%) |
| Acromiocristale Index (%) | ||||
| Trapezoidal trunk | 5 (9.4%) | 3 (4.3%) | 22 (22.2%) | 0 |
| Intermediate trunk | 15 (28.3%) | 8 (11.4%) | 30 (30.3%) | 1 (2.3%) |
| Rectangular trunk | 33 (62.3%) | 59 (84.2%) | 47 (47.5%) | 42 (97.7%) |
The anthropometric indices data show that Tana Ai males had the largest percentage of underweight (40.7%) compared to the other 3 tribes, while the highest obesity rate was found in Bugis males (18.5%). The cormic index as the ratio between sitting height and body height, indicated that Tana Ai males had the highest percentage of the brachycorm category (short trunk and long limbs) (81.4%), and the mesocorm category (16.7%) and the least macrocorm (long trunk size, short limbs) (1.9%) compared to the other 3 tribes. The biacromial index, which describes the width of the shoulders, showed that narrow shoulders with the highest percentage were found in Tana Ai males (96.3%), while the wide shoulders were mostly found in Bugis males (58.5%). The iliocristale index, which describes hip width, highlighted that on average men from the 4 populations had a narrow hip category, except for Rampasasa males who had the highest category of medium hips (60.6%). In terms of the shape of the trunk, it can be seen that there was a significant variation in the shape of the trunk between the 4 populations with a similar pattern between Naulu and Bugis males, namely the trapezoidal type, while the trunk shape of the Tana Ai and Rampasasa males was rectangular (Table 3).
Similar to Tana Ai males, it was proven that Tana Ai females had the largest percentage of underweight (51.4%) compared to the other 3 tribes, while the highest obesity rate was found in Bugis females (30.3%), which was also true for Bugis males. The cormic index showed that Tana Ai females had the highest percentage of brachycorm (68.6%), while the highest percentage of macrocorm was found in Rampasasa females (69.8%). Bugis females had the longest trunks (92.9%), while Naulu females had the shortest trunks (45.3%). In the acromial index, most females from the 3 populations had narrow shoulders, except for the Tana Ai tribe, who had narrow shoulders (100%). In terms of hip size or bicristal index, Rampasasa females had the widest hips (58.1%) compared to the other 3 populations. As for the average trunk shape, most of the women in these 4 populations were of the rectangular type (Table 4).
Discussion
Based on the statistical analysis, generally, there were different anthropometric sizes in the four indigenous peoples living in Eastern Indonesia. These differences include height and weight, shoulders and hips, trunk and legs as well as anthropometric indices. In terms of height, the most striking difference was in the height of the Rampasasa people, who were clearly shorter than the other 3 populations. This is understandable because the Rampasasa people in this study belonged to the Pygmy group (Jacob et al. 2008) with an average male height of 150.1 cm, while Rampasasa female had 143.4 cm. Generally, the Pygmy who live in Africa, the Philippines, Malaysia and Papua New Guinea have an average adult height of 150–155 cm, (Ishida et al. 1998; Jacob et al. 2006; Funk et al. 2020). According to Froment (2014) the average height of the Pygmy group varied from 142 cm (Western Congo Basin Efe) to 161 cm (Eastern Twa). Meanwhile, the size of the shoulders and pelvis of the Rampasasa males as compared to the Pygmy males of Western New Guinea (Ponzetta et al. 2013) was smaller.
The Naulu and Tana Ai males had almost the same height and were larger than the Bugis and Rampasasa males. The result of NCD Risk Factor Collaboration study (2016) demonstrated that Indonesian male adults had an average height of around 160 cm. This figure is categorized as short average height. Of the 200 countries whose average height was measured, Indonesians were ranked 188th, below Papua New Guinea, Myanmar and Vietnam. The height of Indonesian people was varied, between 135 and 180 cm. In other words, it ranges from short to tall. The average height may vary slightly between some local populations, but in most cases the differences are insignificant, and the variations in the current Indonesian population can be studied more deeply, because the variations are indeed deemed extraordinary, and are influenced by monogenic and polygenic characteristics, morphological, physiological, serological and biochemical characteristics (Jacob 1974).
Human populations all around the world show marked variations in body size (Little et al. 2020). The differences between the 4 populations can be clearly seen as a description of different geographical conditions. Even though they all live in the Wallace line area, because they are located in different geographical areas, they have different body characteristics. This situation is supported by Sirajuddin et al. (1994) in their research, which stated that geographical factors had a genetic influence on the distinctive features of ethnic groups living in southern India.
The Naulu people mostly live on the coast with farming and fishing as main occupations. Their staple foods are especially cassava, sweet potatoes, bananas and sago, which they consume daily. Meanwhile, the Tana Ai people live in the village, which is known as a forest and hilly area. Apart from farming, they also do gardening as the main source of livelihood. Their main sources of food are rice, corn, peanuts and cassava. The Bugis people live in the hills in the villages. Their main source of livelihood is farming and livestock husbandry (Hidayah 1996). The Rampasasa people live in the hills, their main occupation is farming using crop cultivation systems, such as corn, cassava, sweet potatoes, and red beans. These people eat meat only during traditional ceremonies, festivals and weddings and also during times of mourning (Jacob et al. 2008). In terms of the body dimensions based on sex, it is apparent that the Naulu male had the largest average size of body weight, height, sitting height and leg length compared to the 3 other groups of male tribes. This situation is understandable considering that the Naulu people live on the coast, allowing them to have adequate protein and more abundant food sources than the other 3 populations who all live in hilly and forest areas (Hidayah 1996; Jacob et al. 2008).
The results of this study are in line with several studies, including research by Iseri and Arslan (2009) on the Turkish population, which disclosed that geographical conditions are characterized by ethnic uniqueness with different habits, nutritional intake, and socio-economic conditions. All of these factors significantly affect height and weight. Apart from geographical influences, dietary factors and secular changes also affect anthropometric data, which is in accordance with the statement of Chuan et al. (2010) that nutritional status affected the growth of adult bodies in the population. These findings also parallel the results of research by Ashizawa et al. (2009) showing that there were secular changes that affected the anthropometric differences between the Javanese and Chinese populations.
Naulu females had the widest shoulders and longest legs, while Bugis females had the highest average body weight, sitting height and trunk length compared to females from the other 3 ethnic groups. On the other hand, the Tana Ai females, aside from having the smallest weight and sitting height, also had the narrowest shoulders among the females of the other 3 tribes. When compared with research by Lin et al. (2004), the height, sitting height, shoulder width and hip width of the Naulu, Tana Ai, Bugis and Rampasa people were smaller than those of Taiwan, China, Japan and Korea. There are significant differences as shown by the comparison of the average height of Naulu male (158.9 cm) and the lowest average height of Chinese male (167.8 cm) in Lin et al.’s study (2004). In contrast, the Naulu male had the tallest average height among the 4 ethnic groups in this study. This is also supported by the research results of Glinka et al. (2010) where the anthropometric data of the Palue people (Australomelanesoid) were significantly smaller (p<0.001) compared to the Javanese (Mongoloid). Likewise, when compared with 3 other ethnic groups in Indonesia (Minangkabau, Sundanese and Javanese) who live in the western part of Indonesia (Widyanti et al. 2015), it was clear that on average, both the males and females of the Naulu, Tana Ai, Bugis and Rampasasa people, had smaller body size. This fact proves that genetic factors, economic development, social environment, and type of work affect body size in different ethnicities (Lin et al. 2004; Sysling 2019). In addition, the differences are also attributed to the fact that the 4 populations (Naulu, Tana Ai, Bugis and Rampasasa) live in isolation and inhabit ecosystems with limited food sources, which explains why they have a smaller average body size.
Comparison of anthropometric indices indicates that the 4 populations had long trunks, narrow shoulders and pelvis except for the Bugis, with a trapezoidal trunk except for the Tana Ai and Rampasasa people who mostly had a rectangular type. According to Olivier (1969), the trapezoidal type trunk is usually found in males, while the rectangular type is in females. A person who has a greater height tends to have a smaller index and is therefore more masculine.
In terms of sex differences in the same population, in general, this study showed that the anthropometric dimensions of males are larger and significantly different from females, except for the width of the hips. These results are supported by research by Widyanti et al. (2015) and Chuan et al. (2010), which showed that the dimensions of the male body are larger than the female. In line with this, Gasser et al. (2000), also held that it is commonly known that on average, adult males have a larger physical size than that of the females except for hip width. This is evidenced by studies of sexual dimorphism in height, sitting height, biacromial and bicristal dimensions.
This study contains limitations that are important to acknowledge. In the data collection, only occupation and medical history were used when collecting information from subjects. It is important to collect data on subjects’ nutrition, genetics, physical activity, and culture at a wider scope. Further research is needed to address the aspect of different body sizes considering developments in the field of technology, transportation and large-scale migration, which may affect the demographic and physical characteristics of ethnic groups in Indonesia.
Acknowledgements
We would like to express heartfelt thanks to the Naulu, Tana Ai, Bugis, and Rampasasa people of Wallace in east Indonesia who collaborated on this study.
Conflict of interest
The authors declare that there is no conflict of interest regarding the publication.
Authors’ contribution
NTR was the lead researcher, conceived concept and design, article writing, critical revision of the article for important intellectual content, provision of study materials, data collection; JH performed the statistical analysis, data collection, and wrote the manuscript; RAS performed data collection and compilation, critical revision of the article for important intellectual content. All authors discussed the results and contributed to the final manuscript for publication.

