 https://orcid.org/0000-0003-1436-6700
Introduction
Estimating biological sex of an individual is one of the most important elements in the forensic anthropological examination of skeletal remains of unknown identity as well as historical material. Moreover, the assessment of other biological parameters, such as age at death and stature, often depends on the sex of the individual (Brůžek 2002; Byers 2016).
There are two main approaches to estimating sex based on skeletal features: morphological and metric. The first set of methods is based on the macroscopic evaluation of morphological features of the skull and pelvis, while the latter uses selected bone measurements and statistical analysis (e.g., regression equations, discriminant functions) (Byers 2016; Bidmos et al. 2021). Both approaches are not error-free. For example, in qualitative methods, incorrect sex estimation may be related to subjectivity and insufficient level of relevant research experience. However, such methods are relatively easy to apply and do not require the use of anthropological equipment. Although metric methods are more time-consuming and require specialized instrumentation, they substantially reduce the risk of subjectivity and allow for determining measurement differences that cannot be detected using the macroscopic methods (Christensen et al. 2015; Krishan et al. 2016).
Most dimorphic bones (such as pelvi girlde bones) are often not available for examination due to bad preservation, incomplete or highly fragmented skeletal material. For instance, according to Walker (2005), incomplete preservation occurs in 80–90% of the individuals excavated from historical cemeteries. Thus, in such cases metric methods can be used for biological sex assessment as an alternative. Results obtained by using metric methods can be further processed by applying discriminant functions, regression analysis, and sectioning points methods (Krishan et al. 2016; Ubelaker and DeGaglia 2017). Apart from bones exhibiting the highest degree of sexual dimorphism, such as pelvic and skull bones (İşcan 2005; Walker 2005; Byers 2016), attempts have been also made to evaluate sex based on metric characteristics of other elements of the postcranial skeleton. For example, discriminative equations have been designed by using measurements of the shoulder girdle bones, e.g. scapula (Tormitsu et al. 2016), clavicle (Albanese 2013), upper limbs (Bidmos and Mazengenya 2021), lower limbs, e.g. femur (Kim et al. 2013), as well as chest bones, e.g. sternum (Macaluso 2010), ribs (Macaluso et al. 2012; Kubicka and Piontek 2016), or smaller limb bones such as calcaneus (Dimichele and Spradley 2012), metacarpals, metatarsals and phalanges (Case and Ross 2007; Bidmos et al. 2021).
The femur is one of the skeletal elements used to construct discriminant equations. Not only it is the most massive and least sensitive to mechanical damage and taphonomic changes, but it is often the best-preserved bone in skeletal material excavated from historical cemeteries. Due to the direct contact in the hip joint with the most dimorphic part of the skeleton – the pelvis and the location of the muscle attachments that are crucial in locomotion, sex estimation based on the femur is characterized by high accuracy (86.4–95%.) (Mall et al. 2000; Purkait 2005; Albanese et al. 2008; Kim et al. 2013; Djorojević et al. 2015; Colman et al. 2018).
Metric methods for estimating sex are common, widely applied, and created for different populations. However, there have been only two attempts to obtain population-specific formulae for the Polish population, based on modern samples with a known biological profile and utilizing CT imaging (Tomaszewska et al. 2014; Kubicka and Piontek 2016). Some studies have proposed sectioning points data for archaeological material derived from Poland (e.g. Tomczyk et al. 2017). However, there are no discriminant functions designed for historical Polish population that utilize the measurements of the proximal femur. Some studies have highlighted an important limitation of the metric methods (e.g. Albanese et al. 2008; Anastopoulou et al. 2014; Colman et al. 2018), such as a low accuracy of the discriminant function or regression equations when applied to other than the original population (i.e., the one for which the function was originally designed), mainly due to the high inter-population variability. This limitation is especially important when assessing the biological sex of individuals of unknown identity whose skeletons were excavated from various historical necropolises. Thus, the specific-population equation is needed for the historical Polish populations. However, there are also limitations in deriving sex estimation equations for Polish populations mainly due to the lack of a large skeletal series that provide information regarding sex, age, health, stature, and other physical characteristics that are critical in comparative analysis.
The main purpose of this study is to derive discriminant function equations for the historical Polish population represented by individuals excavated from two historical Polish cemeteries located in Milicz (12th–14th centuries) and Czysty Square (Plac Czysty) in Wrocław (16th–19th centuries), using the measurements of the proximal end of the femur, in order to propose an alternative method for sex estimation.
Materials and methods
The right and left femora of 223 adult individuals from two Polish archaeological sites were examined. The skeletal material is a part of the osteological collection stored at the Department of Anthropology, Hirszfeld Institute of Immunology and Experimental Therapy, Polish Academy of Sciences, in Wroclaw. The data were collected from a) 144 right and 154 left femora from Czysty Square (in Wroclaw), b) 53 right and 53 left femora from Milicz. The sex of the individuals from both sites was unknown.
The Orthodox cemetery near Czysty Square was adjacent to the Salvator Church, situated on the perimeter of Wroclaw (Lower Silesia voivodeship, Poland), which was built in 1568. The cemetery was in use from the year 1541 until the first half of the 19th century. According to Wojtucki (2015) and Sawicki (2015), the majority of people buried at the cemetery came from the nearby poor communities.
The cemetery in Milicz, which was in use between the 12th–14th century, contains remains of an early medieval town community. The cemetery was located on the southwestern part of a farmed hill near the Barycz Valley, 500 m from the buildings of the modern town of Milicz (Wachowski 1969; Kiarszysz and Kolenda 2017).
Femora with visible pathological lesions or in a poor state of preservation were excluded from the study because any form of alteration (e.g., degenerative) might influence the measurements. Another criterion of sample selection was based on the possibility of establishing at least three landmarks. If possible, the measurements were taken both from the right and left femur of an individual. Ability to estimate the sex of an individual based on pelvic morphology was also a critical criterion in sample selection. An individual was excluded from the study if there was not at least one pelvic bone in a state of good preservation available to examine or if the dimorphic features were ambiguous.
The sex of an individual was estimated by JW based on the morphological features of the pelvis, using standard anthropological criteria (Phenice 1969; Buikstra and Ubelaker 1994; Brickley 2004). During the sex evaluation, the following traits were taken into consideration: ventral arc, ischiopubic ramus ridge, subpubic concavity (Phenice 1969), sciatic notch (Buikstra and Ubelaker 1994; Walker 2005), and subpubic angle (Brickley 2004). During the next step, the outcome of the estimation of sex, based on morphological criteria, was also verified with the results of the sex assessment established previously by other authors (Wachowski 1969; Wachowski 1970; Łubocka and Gronkiewicz 2015).
Every bone was measured twice using an electronic caliper by JW. All anthropometric landmarks included in this research were located on the proximal part of the femur (Table 1, Figure 1).
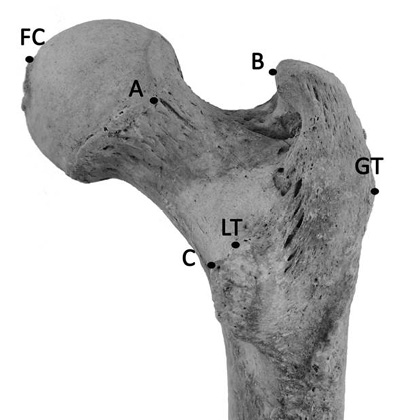
Fig. 1. The landmarks of the proximal femur used in equations (according to Purkait 2005; Albanese et al. 2008)
| Measurement | Definition |
| AB a | The straight distance between the point on the articular margin of head dipping most laterally and the point projecting most medially on the greater trochanter. |
| BC a | The straight distance between the point projecting most medially on the greater trochanter and the highest point on the lesser trochanter. |
| AC a | The straight distance between the point on the articular margin of head dipping most laterally and the point projecting most medially on the highest point on the lesser trochanter. |
| GT-LT b | The straight distance between the most lateral apex on the greater trochanter and the most proximal point on the lesser trochanter. |
| GT-FC b | The straight distance between the most lateral apex on the greater trochanter and the superior margin on the fovea capitis. |
| LT-FC b | The straight distance between the most proximal point on the lesser trochanter and the superior margin on the fovea capitis. |
| FHD c | The maximum diameter of the head of the femur |
Statistical analyses were conducted using SPSS v.25, STATISTICA 13.1, and Microsoft Office Excel 2007. The sexual dimorphism index (SDI) was calculated according to the formula used by Tobias (after Ricklan and Tobias 1986), where Xm is the mean value for males and Xf is for the females:

Inspection of the normal probability (i.e., Q-Q) plots for each of the femur measurements, for males and females, was conducted. The Mann-Whitney U-test was used for the comparison of the measurements of the femora between the Czysty square and Milicz collection. For symmetry examination between the right and left femora, paired-sample t-tests were performed. For the inter-observer error evaluation, the measurements of the two authors were compared. The author, AC, measured 41 femora twice from the original sample. The technical error of measurements (TEM), the relative technical error of measurements (%TEM), and the reliability coefficient (R) were calculated (Ulijaszek and Kerr 1999). For the comparison with the inter-observer error calculated by Albanese et al. (2008), the equation mentioned below was used as well:
Two sample t-tests, as well as simple univariate discriminant analysis and multivariate backward stepwise discriminant function analyses, were conducted to analyze possible sex differences in the proximal femur measurements. Inspection of the normal probability revealed that the data were distributed normally. Results for homogeneity of variances Levene’s test are presented in table 2. For multiple testing (t-tests for determination of sexual dimorphism in n=7 measurements) the significance level was Bonferroni corrected to α = 0.05/7 = 0.007. The sex demarcation points for univariate discriminants analyses were calculated as the grand average of the means for both sexes for each measurement. The sex sectioning point (SP) for the backward stepwise multivariate function analysis was calculated as the average between mean canonical scores for males and females. The Box’s M test showed that the assumption of homogeneity of variance–covariance matrices for the predictor variables in multivariate discriminant analysis were only marginally violated (Box’s M = 44.81; χ2(df:28) = 42.28; p = 0.04). The Czysty square (Wrocław) collection was used as an original sample and the Milicz series as a cross-validation sample. Statistical significance was set at α = 0.05.
Results
In total, there were 81 male and 71 female skeletons from the Czysty Square, and 56 male and 44 female skeletons from the Milicz collection. No significant differences between the average measurement values of femora from the early modern (Czysty square, Wrocław) and medieval (Milicz) anthropological series were found (see Supporting Information Table S1).
The variability of measurements was moderately high (Table 2). The highest reliability coefficient was observed in the case of GT-FC and FHD measurements (R = 0.99). All of the lengths of Purkait’s Triangle (AB, BC, AC) obtained lower reliability (below 0.90). Out of the 14 used measurements (seven on the right and seven on the left femur), six obtained moderately high values of inter- and intra-observer error (four dimensions of the right and two of the left femur).
A series of t-tests showed that except for AC (right and left), all measurements were sexually dimorphic at Bonferroni corrected level α = 0.007. All traits were significantly larger in males. The highest SDI value was calculated for FHD, whereas the lowest was for AC measurement. (Table S3).
| Measurements | Observer 1 | Observer 2 | ||||||||||
| N | Mean | SD | TEM intra | %Error | Mean | SD | TEM intra | %Error | TEM inter | %TEM | R | |
| AB R | 30 | 29.26 | 4.94 | 31.47 | 4.16 | 29.50 | 4.14 | 32.84 | 4.17 | 2.14 | 7.12 | 0.78 |
| AB L | 34 | 30.29 | 4.82 | 23.61 | 2.85 | 32.97 | 4.62 | 34.35 | 3.89 | 1.73 | 5.48 | 0.87 |
| AC R | 30 | 50.39 | 5.76 | 32.91 | 2.45 | 44.04 | 4.63 | 30.47 | 2.68 | 2.11 | 4.48 | 0.83 |
| AC L | 34 | 51.41 | 5.65 | 41.39 | 2.14 | 43.15 | 5.79 | 32.65 | 2.43 | 2.19 | 4.64 | 0.85 |
| BC R | 31 | 57.67 | 4.66 | 26.39 | 2.08 | 52.22 | 3.85 | 44.73 | 2.72 | 2.37 | 4.31 | 0.69 |
| BC L | 35 | 58.89 | 5.52 | 31.29 | 1.88 | 51.68 | 4.56 | 28.15 | 1.81 | 1.70 | 3.08 | 0.89 |
| LT-GT R | 40 | 54.50 | 5.42 | 35.48 | 1.84 | 54.22 | 4.76 | 49.87 | 2.67 | 2.16 | 3.98 | 0.82 |
| LT-GT L | 41 | 53.88 | 8.88 | 38.88 | 1.78 | 55.45 | 5.06 | 36.01 | 1.91 | 1.83 | 3.34 | 0.93 |
| GT-FC R | 41 | 90.28 | 7.25 | 20.67 | 0.67 | 91.69 | 7.58 | 14.70 | 0.41 | 0.87 | 0.96 | 0.99 |
| GT-FC L | 41 | 89.43 | 9.54 | 18.72 | 0.56 | 92.26 | 7.78 | 17.61 | 0.44 | 0.89 | 0.98 | 0.99 |
| FC-LT R | 40 | 66.15 | 6.77 | 24.43 | 1.11 | 69.90 | 6.54 | 32.68 | 1.22 | 1.44 | 2.12 | 0.95 |
| FC-LT L | 41 | 66.27 | 7.40 | 62.89 | 1.95 | 67.62 | 7.20 | 40.38 | 1.63 | 2.58 | 3.82 | 0.88 |
| FHD R | 40 | 44.77 | 3.86 | 10.02 | 0.43 | 45.58 | 4.62 | 7.77 | 0.49 | 0.45 | 0.98 | 0.99 |
| FHD L | 41 | 44.89 | 3.90 | 9.39 | 0.72 | 45.24 | 4.51 | 6.67 | 0.44 | 0.40 | 0.87 | 0.99 |
R- right femur; L-left femur
| Female | Male | t-test | Levene’s test | |||||||||
| Mean | SD | n | Mean | SD | n | t-value(df) | p* | F(1.df) | p | df | SDI | |
| AB R | 29.56 | 4.603 | 51 | 32.30 | 4.811 | 50 | -2.93 | 0.004 | 0.08 | 0.775 | 99 | 8.48 |
| AB L | 30.94 | 4.484 | 52 | 34.26 | 5.779 | 57 | -3.32 | 0.001 | 2.11 | 0.150 | 107 | 9.69 |
| AC R | 43.28 | 4.961 | 57 | 45.38 | 6.595 | 60 | -1.93 | 0.056 | 8.55 | 0.004 | 115 | 4.63 |
| AC L | 42.20 | 4.825 | 57 | 44.53 | 6.500 | 70 | -2.24 | 0.027 | 6.73 | 0.011 | 125 | 5.23 |
| BC R | 49.90 | 4.652 | 52 | 54.30 | 4.790 | 50 | -4.71 | <0.007 | 0.01 | 0.906 | 100 | 8.10 |
| BC L | 49.39 | 4.414 | 52 | 54.18 | 5.560 | 56 | -4.93 | <0.007 | 2.36 | 0.127 | 106 | 8.84 |
| LT-GT R | 51.85 | 3.870 | 62 | 56.86 | 4.023 | 70 | -7.27 | <0.007 | 0.03 | 0.867 | 130 | 8.81 |
| LT-GT L | 52.70 | 4.240 | 63 | 58.36 | 4.371 | 77 | -7.72 | <0.007 | 0.04 | 0.841 | 138 | 9.70 |
| GT-FC R | 87.96 | 5.796 | 62 | 98.24 | 6.348 | 70 | -9.67 | <0.007 | 0.75 | 0.388 | 130 | 10.46 |
| GT-FC L | 88.23 | 5.609 | 63 | 98.33 | 6.336 | 77 | -9.88 | <0.007 | 0.59 | 0.444 | 138 | 10.27 |
| FC-LT R | 67.18 | 5.204 | 62 | 73.44 | 6.854 | 70 | -5.85 | <0.007 | 6.86 | 0.010 | 130 | 8.52 |
| FC-LT L | 64.95 | 4.964 | 63 | 71.16 | 6.649 | 77 | -6.15 | <0.007 | 7.66 | 0.006 | 138 | 8.73 |
| FHD R | 42.86 | 2.774 | 63 | 48.99 | 3.378 | 81 | -11.67 | <0.007 | 1.02 | 0.313 | 142 | 12.51 |
| FHD L | 42.63 | 2.480 | 66 | 48.82 | 3.321 | 88 | -12.72 | <0.007 | 3.24 | 0.074 | 152 | 12.68 |
p* – refers to Bonferroni-corrected significance level; Levene’s test for homogeneity of variances in the compared groups; note that in two cases the assumption is violated.
The means of the measurements were significantly different in four out of seven cases (measurements: GT-FC, LT-FC, AB, and AC) between the right and left bones (Table 4). For this reason, the samples were not combined, and the measurements of each side were analyzed separately. GT-LT and AB measurements took on average higher values on the left side, while LT-FC and AC on the right side.
In order to determine whether males and females differed with respect to the proximal femur measurements, the discriminant function analysis was conducted. Results for the univariate discriminant analyses are presented in Table 5. For the original data, the accuracy for the sex discrimination (combined for males and females) was the highest for FHD R – 83.33%, and FHD L – 85.71%. For the cross-validation data (Milicz collection) the highest accuracy for the sex discrimination (combined for both sexes) was observed also for FHD R – 88.68, FHD L – 86.79%. The multivariate backward stepwise method showed that only FHD (right and left) was a statistically significant measurement that can be included in the discriminant function. The results of the stepwise discriminant function analysis showed a high accuracy in estimating sex when using FHD measurement of both sides and in the case of both: original and cross-validation sample (FHD R: 83.0; 92.3%; FHD L: 88.0; 89.3% respectively) (Table 6).
| Right | Left | 95% CI | ||||||||
| n | x– | SD | x– | SD | t | p | LL | UL | d Cohena | |
| AB | 86 | 30.77 | 4.37 | 32.69 | 5.03 | -4.73 | <0.001 | -2.73 | -1.11 | 0.51 |
| AC | 119 | 44.73 | 5.76 | 43.75 | 6.04 | 2.88 | 0.004 | 0.31 | 1.66 | 0.26 |
| BC | 89 | 51.74 | 5.67 | 51.94 | 5.70 | -0.76 | 0.449 | -0.74 | 0.33 | 0.08 |
| LT-GT | 149 | 54.73 | 4.86 | 55.85 | 5.20 | -5.31 | <0.001 | -1.54 | -0.70 | 0.43 |
| GT-FC | 149 | 93.55 | 7.46 | 93.59 | 7.40 | -0.27 | 0.784 | -0.38 | 0.29 | 0.02 |
| FC-LT | 150 | 70.73 | 6.68 | 68.65 | 6.68 | 8.14 | <0.001 | 1.58 | 2.59 | 0.66 |
| FHD | 183 | 46.36 | 4.60 | 46.30 | 4.65 | 0.92 | 0.356 | -0.07 | 0.19 | 0.07 |
| Original accuracy (%) | Cross-validation accuracy (%) | ||||||
| male | female | total | male | female | total | Demarcation points (mm) | |
| AB R | 64.00 | 60,78 | 62.38 | 55.00 | 57.14 | 55.56 | 1<30,92<0 |
| AC R | 58.33 | 54.39 | 56.41 | 61.54 | 57.14 | 60.61 | 1<44.36<0 |
| BC R | 62.00 | 67.31 | 64.71 | 57.14 | 85.71 | 64.29 | 1<52.05<0 |
| LT-GT R | 77.14 | 69.35 | 73.48 | 82.35 | 69.23 | 78.72 | 1<54.50<0 |
| GT-FC R | 80.00 | 75.81 | 78.03 | 97.06 | 84.62 | 93.62 | 1<93.41<0 |
| FC-LT R | 68.57 | 69.35 | 68.94 | 71.43 | 61.54 | 68.75 | 1<70.50<0 |
| FHD R | 86.42 | 79.37 | 83.33 | 87.18 | 92.86 | 88.68 | 1<46.31<0 |
| AB L | 61.40 | 59.62 | 60.55 | 65.22 | 37.50 | 58.06 | 1<32.68<0 |
| AC L | 74.29 | 31.58 | 55.12 | 74.07 | 12.50 | 60.0 | 1<43.48<0 |
| BC L | 64.29 | 63.46 | 63.89 | 57.14 | 88.89 | 66.67 | 1<51.87<0 |
| LT-GT L | 80.52 | 71.43 | 76.43 | 80.00 | 76.92 | 79.07 | 1<55.81<0 |
| GT-FC L | 83.12 | 74.60 | 79.29 | 90.00 | 76.92 | 86.05 | 1<93.79<0 |
| FC-LT L | 72.73 | 68.25 | 70.71 | 76.67 | 46.15 | 67.44 | 1<68.36<0 |
| FHD L | 85.23 | 86.36 | 85.71 | 89.19 | 81.25 | 86.79 | 1<46.16<0 |
0 – male; 1 – female; R -right; L – left
| Original accuracy (%) | Cross-validation accuracy (%) | |||||||||||
| Variable entered | Exact F | df | p | Wilks’ λ | χ2 | Raw coefficient | male | female | total | male | female | total |
| FHD R | 98.74 | 1, 98 | < 0.001 | 0.50 | 67.95 | 0.3276 | 82.0 | 84.0 | 83.0 | 90.0 | 100.0 | 92.3 |
| Constant | -14.9832 | |||||||||||
| FHD L | 125.04 | 1, 106 | < 0.001 | 0.46 | 82.20 | 0.3467 | 83.9 | 92.3 | 88.0 | 90.5 | 85.7 | 89.3 |
| Constant | -15.8345 | |||||||||||
The sectioning point equals zero. Standard coefficient equals on
The final forms of the discriminant functions were:
For the right measurement:
y = -14.9832 + (FHD R × 0.3276)
Since the sectioning point equals SP = 0 (canonical means: males = 0,994; females = -0,994) positive y-values indicate a male and negative values indicate a female.
and for the left measurement:
y = -15.8345 + (FHD L × 0.3467)
Since the sectioning point equals SP= -0.04 (canonical means: 0 = 1.037; 1 = -1,117) y-values greater than SP indicate a male femur and values lower than SP indicate a female femur.
Discussion
The mean values of the selected proximal femoral measurements did not differ between the medieval and early modern collections. This denotes a similarity between individuals from the two historical periods (medieval and early modern) living in the same geographical area (the distance between cemeteries was approximately 60 km).
Although metric methods of sex assessment developed in other studies (e.g. Purkait 2005; Anastopoulou et al. 2014; Djorojević et al. 2015; Djorojević et al. 2019) had common assumptions and goals, they differed significantly in terms of methodology. For example, because Purkait (2005) and Djorojević et al. (2015) assumed that there were no differences in right-left measurements of the femora, they measured only one femur from each individual without recording which bone was measured. Similarly, in another study Djorojević et al. (2019) originally measured femora from both sides using CT scans, but, having established the symmetry of the femora, the authors decided to use measurements from only one side without reporting which one was measured. In contrast, Anastopoulou et al. (2014) used the metric features of both femora of measured individuals, despite the lack of differences between the average bone measurements, and yielded comparable effectiveness of sex estimation for the right and left bones (77.8%, 75.9%).
In the present study, four out of seven measurements of the right and left femora differed significantly from one another. However, it is not possible to unambiguously determine whether the right or left bone dimensions were on average larger because two of the measurements (LT-FC, AC) point to the right femoral proximal end being larger and two (GT-FC, AB) to the left femoral proximal end being larger. It is also worth noting that LT-FC and AC, as well as GT-FC and AB, are equivalent in Purkait (2005) and Albanese et al. (2008) methods. LT-FC and AC are the distance from the fovea capitis (LT-FC) or posterior margin of the head (AC) to the point located on the lesser trochanter, whereas GT-FC and AB are the distance between the head (fovea capitis – GT-FC, posterior margin of a head – AB) and the most lateral point situated on the greater trochanter. This may suggest that the development of the greater trochanter on the left side was more prominent and the lesser trochanter was strongly marked on the right side. The FHD measurement did not differ between the sides, which contradicts the observations of Plochocki (2004) and Auerbach and Ruff (2006), who recorded higher values of the femoral head measurements of the left limb.
The discriminant function results indicate that using the femoral head diameter measurement (FHD) in a discriminant equation alone has a high accuracy and no additional measurements of the proximal part of the femur are needed. A high SDI value of 12.7–12.9 and a large size effect obtained by the sex comparison test (Table 2) suggest that the FHD measurement is a highly dimorphic feature. In addition, the FHD measurement is easy to perform, thus its precision is higher (the lowest inter- and intra-observer error values) compared to other measurements. As Albanese et al. (2008) suggested that a miscalculation may occur when the % error margin exceeds 2-2.5%, and in this study, the majority of Purkait’s Triangle (AB, BC, AC) dimensions (all measurements of the right femora and two out of three from the left femora) exceed the 2% error margin (Table 3). The lengths proposed by Albanese et al. (2008), only LT-GT was associated with a high risk of measurement inaccuracies (%error = 2.67). Similarly, Albanese et al. (2008) observed the lowest precision of LT-GT (%error = 1.99). Relatively high inter- and intra-observer error values of the measurements reported in the above studies (besides GT-FC and FHD) may indicate difficulties in a precise assessment of some landmarks on the femur and in their reproducibility. The results of the discriminant function and inter- and intra- observer error suggest that a more efficient approach in estimating sex could be one measurement as oppose to applying multiple measurements with more complicated formulae.
The results of the stepwise discriminant function did not support the results of Purkait (2004) and Albanese et al. (2008), whose measurements did not meet the criteria in the stepwise discriminant function when applied to the Polish population. Though, the six measurements (AB, AC, BC, GT-LT, LT-FC, GT-FC) were not included in the deriving functions for the sex estimation. The single measurement FHD used in the discriminant function reached high accuracy of the sex estimation (83.0–92.3%).
In Poland, there is no reference collection that would allow for deriving methods based on known sex. Regarding the historical osteological materials, information on the biological profile of the individuals is usually unknown and the only source of substantial data is a skeleton. Therefore, the sex needs to be estimated using morphological and morphometrical methods. There are no studies on the accuracy of the sex estimation methods based on the morphology of the pelvis regarding historical Polish populations. However, the accuracy of those methods was estimated at 94.5–95.7% (Klales et al. 2012; Inskip et al. 2019).
Deriving the discriminant function based on the measurements of individuals whose sex was estimated using anthropological methods is prone to error. However, this approach is not new and skeletons with unknown sex were used e.g., for the creation of the first sex discrimination function for the Iron Age population from Iran, using dental measurements (Kazzazi and Kranioti 2018) or for calculating formula for late antique East Adriatic coast population (Jerković et al. 2016). The need for metric methods for sex estimation is strong. However, the above-mentioned limitations regarding archaeological material, are often inherent.
When the standard morphologic methods for sex estimation are not available due to the poor preservation of the material (absent or damaged pelvis and skull) and the head of the femur is well preserved, the use of presented equations is recommended for both medieval and early-modern Polish populations.
The methodological approach applied in this study requires further discussion. Some authors recommend using logistic regression over a discriminant function when formulating sex estimating equations, pointing out to the continuity of sex dimorphic features and fewer required assumptions of logistic regression (Bartholdy et al. 2020). Although the overlapping variability of female and male features when investigating data from historical populations, a dichotomic approach for sex assessment, with clearly defined cut-off points, could still be preferred. Considering the popularity of this procedure, the discriminant function was utilized in this study. We provide raw data as supplementary materials for further examinations with different statistical analyses (Tab. S2).
Conclusion
To conclude, our results imply the utility of the calculated discriminant function in estimating sex in medieval and early-modern Polish populations. Nevertheless, in order to prove the applicability of the derived discriminant function across the population, a replication of this study, using samples of individuals from other Polish sites and different historical periods, is needed. In addition, moderately high inter- and intra-observer errors pose difficulties regarding the repeatability of some of the applied measurements (AB, AC, BC, LT-GT, FC-LT). It is worth noting that the FHD measurement (not regarding the side) have been found to be the easiest to reproduce and the most accurate in estimating sex.
Conflict of interest
The authors declare no conflict of interest associated with this study. There was no financial support for this study.
Authors’ contributions
JW designed the study, formulated the hypothesis, collected the data, conducted the statistical analysis, and wrote the first draft of the manuscript. AC collected the data and supervise the study, DD conducted the statistical analysis. All authors edited the final version of the text.

