Available online at: https://doi.org/10.18778/1898-6773.85.4.04
Division of Anthropology, Institute of Environmental Biology, Faculty of Biology and Animal Science, Wroclaw University of Environmental and Life Sciences
Division of Anthropology, Institute of Environmental Biology, Faculty of Biology and Animal Science, Wroclaw University of Environmental and Life Sciences
Division of Anthropology, Institute of Environmental Biology, Faculty of Biology and Animal Science, Wroclaw University of Environmental and Life Sciences
ABSTRACT: Human voice is an extremely important biological signal which contains information about sex, age, emotional state, health and physical features of a speaker. Estimating a physical appearance from a vocal cue can be an important asset for sciences including forensics and dietetics. Although there have been several studies focused on the relationships between vocal parameters and ratings of height, weight, age and musculature of a speaker, to our knowledge, there has not been a study examining the assessment of one’s BMI based on voice alone.
The purpose of the current study was to determine the ability of female “Judges” to evaluate speakers’ (men and women) obesity and body fat distribution from their vocal cues. It has also been checked which voice parameters are key vocal cues in this assessment.
The study material consisted of 12 adult speakers’ (6 women) voice recordings assessed by 87 “Judges” based on a 5-point graphic scale presenting body fat level and distribution (separately for men and women). For each speaker body height, weight, BMI, Visceral Fat Level (VFL, InBody 270) and acoustic parameters were measured. In addition, the accuracy of BMI category was verified. This study also aimed to determine which vocal parameters were cues for the assessment for men and women. To achieve it, two independent experiments were conducted: I: “Judges” had to choose one (obese) speaker from 3 voices (in 4 series); II: they were asked to rate body fat level of the same 12 speakers based on 5-point graphic scale.
Obese speakers (i.e., BMI above 30) were selected correctly with the accuracy greater than predicted by chance (experiment I). By using a graphic scale, our study found that speakers exhibiting higher BMI were rated as fatter (experiment II). For male speakers the most important vocal predictors of the BMI were harmonics-to-noise ratio (HNR) and formant dispersion (Df); for women: formant spacing (Pf) and intensity (loudness).
Human voice contains information about one’s increased BMI level which are hidden in some vocal cues.
KEY WORDS: body composition, formant dispersion, fundamental frequency, formant position, obesity, fat distribution, body shape
Voice is an extremely important biological signal for almost all living organisms, including humans. Human voice can convey a relevant information, such as sex (Wolfe et al. 1990), age (Tarafder et al. 2012), emotions (Raine et al. 2019; Sondhi et al. 2015), stimulants used (Byeon and Cha 2020; Moreira et al. 2015), body size/shape (Evans et al. 2006; Pawelec et al. 2022a; Pisanski et al. 2014; 2016; Rendall et al. 2005; 2007) and body composition (Hamdan et al. 2012; 2013b). There have been plenty of studies aiming to determine the listeners’ ability to correctly estimate biological traits of a speaker. One of the most cited studies was conducted by Collins (2000). She found that men whose voices exhibited a low harmonic component (lower formant frequencies and smaller differences between them) were judged as more attractive, taller, heavier, older, more likely to have chest hair and more muscular bodies. Moreover, the assessment of body weight was accurate. Similar results were obtained by Brueckert et al. (2006), who not only found a significant correlation between estimated and actual weight of the male speakers but also that the age of the participants was correctly judged based on their voice. Although these two studies only looked at male speakers, there have been also studies that were focused on both sexes. One of such studies has been conducted by Hughes et al. (2002), aiming to determine whether the audience was able to assess speaker’s attractiveness assessed based on the voice and the extent to which voice cues correspond to the level of their fluctuating asymmetry (FA). This study revealed that there was a significant relationship between voice attractiveness and overall, FA of the speakers. In addition, Lass and Davis (1976) found that judges were capable of identifying the height of male and female speakers and body mass of men from their voices with better than chance accuracy. Another finding of the same author revealed a similar trend of assessment accuracy of male and female speakers (Lass et al. 1980). These studies suggest that cues regarding a body size / shape of the speakers are included in the speakers’ voice parameters. For example, Pisanski and Rendall (2011) found that speakers of both sexes with lower values of fundamental frequency (F0) and mean formant frequency (Fn) are rated by male and female listeners as larger and more masculine. Moreover, a manipulation of these parameters (lower F0 and Fn) resulted in speakers of both sexes were judged as larger and more masculine (Pisanski and Rendall 2011). The tendency to accurately assess biological parameters of a body from vocal cues has been suggested to have evolutionary roots. Indeed, one study found that even congenitally blind listeners are able to correctly estimate the speaker’s height from the voice alone (Pisanski et al. 2016).
All of the discussed above studies have focused on the physical characteristics of the speakers, such as height and weight, age, muscularity, physical strength and body hair. However, there has not been, to our knowledge, a study examining the assessment of relative body weight (body fat / body mass index [BMI]) based on vocal cues and the only one work that vaguely oscillates around the topic investigated the relationship between voice parameters and BMI in patients using the algorithms of artificial intelligence (Lee et al. 2013). Nevertheless, there has been a study on the effect of blood glucose levels on voice quality showing that the effect of glucose levels on the elastic properties of the vocal fold tissues (Sidorova et al. 2020). This study found an association of hypoglycemia with a sense of anxiety causing faster speech or hyperglycemia affecting slower and slurred speech (Sidorova et al. 2020). Therefore, since the glucose level is related to voice quality and obesity, it can be expected that people with a higher body fat content should have different voice characteristics compared to people with a normal BMI.
Human voice provides a lot of information about the body structure (Pawelec et al. 2022a; Pisanski et al. 2014), and it is also a very important biological signal that plays an important role in male-male competition and sexual selection (Collins 2000; Gregory 1994; Oguchi & Kikuchi 1997; Puts et al. 2006), as well as it contains information about the individual’s health (Arnocky et al. 2018; Barties et al. 2013; Sidorova et al. 2020). Therefore, as the excessive content of adipose tissue in the body (obesity) deteriorates the biological quality of an individual and an evolutionary importance of recognizing biological quality (fitness) of healthy or sick person, the question arises whether it is possible to correctly subjectively assess obesity level of an individual based only on the voice. The first objective of the study was to determine whether “Judges” could correctly identify the speaker as an obese person based on his/her voice. The second aim of the study was to determine whether “Judges” were able to rate obese speakers higher on the 5-point scale of body silhouettes exhibiting varied BMI. Finally, the third goal was to compare ratings according to 5-point scale of adiposity mentioned above and actual parameters of the speakers’ voices in order to see which of them influenced this rating.
a) Procedure for speaker’s selection
Material of the study consisted of 12 adult’s speakers (including 6 women) aged 24–48 years. Each participant was asked to fill a short questionnaire containing basic questions (about sex, age, domicile) and questions about any factors that could potentially affect voice quality (head or neck trauma/surgery, speech impediment, malocclusion, hearing impairment, the use of the stimulants i.e. cigarettes, drinking an alcohol the day before examination, taking hormonal drugs, being ill in the time of the study, transition of COVID-19 disease in the last year or using the voice as the work tool or hobby i.e. working as a teacher/lecturer, sales representatives, film reader, radio operator, singer etc.). None of the participants declared any factors that could have a negative impact on the quality of their voice. No speaker abused his/her voice (neither professionally nor as a hobby). All speakers used Polish as their mother tongue (no dialects). All participants agreed to participate in the study free of charge.
Each of the speakers was subjected to body height measurement (in cm) using an anthropometer and body composition analysis using the InBody 270 analyser. The total absolute body weight (in kg), and Visceral Fat Level (VFL) was selected from the InBody 270 analyser results. The InBody composition analyser gives a range of visceral fat between 1 and 59. A rating between 1 and 12 indicates a healthy level of visceral fat. A rating between 13 and 59 indicates an excessive level of visceral fat. Visceral fat is a fatty tissue that accumulates around the internal organs in the abdominal region. It means that, the amount of visceral fat (VFL) reflects the distribution of fat in this area and thus affects body shape (i.e., silhouette expressed by the waist-to-hip ratio, WHR). Subsequently, based on body height and body weight values, body mass index (BMI; kg/m2) was calculated.
The 12 speakers of this study were chosen from the larger group of 80 volunteers (40 women) based on specific inclusion criteria. Four out of 12 subjects were obese (2 men and 2 women): BMI value above 30.0 kg/m2 (according to the WHO classification) and Visceral Fat Level (VFL) above 18. level. The remaining 8 participants (including 4 women) were selected as a control group on the basis of similar age to obese speakers.
The 12 participants were divided into 4 equal groups (triads) – 1 subject obese and 2 subjects of normal weight in each triad. Two triads consisted of women; 2 groups consisted of male triads. The median age in the first female triad was 24 y. (years: 24, 24, 26), second female triad – 47 y. (years: 43, 47, 48), first male triad – 35 y. (years: 29, 35, 35), second male triad 27 y. (years: 25, 27, 31).
Table 1. Speakers’ descriptive data (N=12)
| Speakers’ parameters | Mean | SD | Median | Min | Max |
| Male speakers (N=6) | |||||
| A1. normal weight individuals (n=4) | |||||
| Body height [cm] | 180.88 | 5.57 | 182.25 | 173.00 | 186.00 |
| Weight [kg] | 77.68 | 7.46 | 78.00 | 68.70 | 86.00 |
| BMI [kg/m^2] | 23.78 | 2.45 | 24.25 | 20.50 | 26.10 |
| VFL (level) | 3.75 | 3.10 | 3.00 | 1.00 | 8.00 |
| Intensity [dB] | 79.51 | 5.18 | 81.48 | 71.93 | 83.15 |
| F0 [Hz] | 123.73 | 14.35 | 127.74 | 103.14 | 136.28 |
| Jitter [%] | 2.98 | 0.81 | 2.98 | 2.19 | 3.79 |
| Shimmer [%] | 8.70 | 1.68 | 8.65 | 7.09 | 10.41 |
| HNR [dB] | 8.50 | 1.63 | 8.60 | 6.74 | 10.05 |
| Fn [Hz] | 2445.72 | 71.68 | 2464.37 | 2504.17 | 71.68 |
| Pf [Z] | 0.56 | 1.45 | 0.94 | 1.74 | 1.45 |
| Df [Hz] | 1117.27 | 43.48 | 1126.69 | 1153.87 | 43.48 |
| ΔF [Hz] | 1279.10 | 51.06 | 1278.21 | 1337.47 | 51.06 |
| A2. obese individuals (n=2) | |||||
| Body height [cm] | 183.50 | 7.07 | 183.50 | 178.50 | 188.50 |
| Weight [kg] | 141.10 | 33.38 | 141.10 | 117.50 | 164.70 |
| BMI [kg/m2] | 41.65 | 6.72 | 41.65 | 36.90 | 46.40 |
| VFL (level) | 19.50 | 0.71 | 19.50 | 19.00 | 20.00 |
| Intensity [dB] | 76.92 | 7.05 | 76.92 | 71.93 | 81.90 |
| F0 [Hz] | 97.81 | 6.82 | 97.81 | 92.98 | 102.63 |
| Jitter [%] | 3.05 | 0.09 | 3.05 | 2.99 | 3.12 |
| Speakers’ parameters | Mean | SD | Median | Min | Max |
| A2. obese individuals (n=2) | |||||
| Shimmer [%] | 10.31 | 1.19 | 10.31 | 9.48 | 11.15 |
| HNR [dB] | 7.95 | 0.06 | 7.95 | 7.91 | 8.00 |
| Fn [Hz] | 2442.39 | 31.01 | 2442.39 | 2420.46 | 2464.32 |
| Pf [Z] | 0.50 | 0.63 | 0.50 | 0.05 | 0.94 |
| Df [Hz] | 1138.77 | 52.40 | 1138.77 | 1101.72 | 1175.83 |
| ΔF [Hz] | 1270.22 | 32.59 | 1270.22 | 1247.18 | 1293.27 |
| Female speakers (N=6) | |||||
| B1. normal weight individuals (n=4) | |||||
| Body height [cm] | 162.80 | 4.20 | 162.60 | 158.70 | 167.30 |
| Weight [kg] | 56.18 | 9.96 | 53.60 | 47.50 | 70.00 |
| BMI [kg/m^2] | 21.10 | 2.70 | 20.25 | 18.90 | 25.00 |
| VFL (level) | 5.75 | 1.26 | 6.00 | 4.00 | 7.00 |
| Intensity [dB] | 73.32 | 7.43 | 73.70 | 65.22 | 80.65 |
| F0 [Hz] | 203.08 | 10.11 | 198.90 | 196.59 | 217.92 |
| Jitter [%] | 2.15 | 0.28 | 2.19 | 1.77 | 2.45 |
| Shimmer [%] | 10.08 | 2.04 | 9.99 | 8.01 | 12.34 |
| HNR [dB] | 11.54 | 1.68 | 11.29 | 10.02 | 13.54 |
| Fn [Hz] | 2393.01 | 24.11 | 2396.95 | 2361.55 | 2416.60 |
| Pf [Z] | -0.50 | 0.49 | -0.42 | -1.13 | -0.02 |
| Df [Hz] | 1136.28 | 13.93 | 1133.45 | 1123.50 | 1154.72 |
| ΔF [Hz] | 1239.68 | 19.62 | 1248.59 | 1210.31 | 1251.21 |
| B2. obese individuals (n=2) | |||||
| Body height [cm] | 168.85 | 4.45 | 168.85 | 165.70 | 172.00 |
| Weight [kg] | 97.50 | 26.16 | 97.50 | 79.00 | 116.00 |
| BMI [kg/m^2] | 34.10 | 7.50 | 34.10 | 28.80 | 39.40 |
| VFL (level) | 19.50 | 0.71 | 19.50 | 19.00 | 20.00 |
| Intensity [dB] | 76.89 | 9.76 | 76.89 | 69.98 | 83.79 |
| F0 [Hz] | 230.42 | 17.45 | 230.42 | 218.08 | 242.76 |
| Jitter [%] | 1.86 | 0.40 | 1.86 | 1.57 | 2.14 |
| Shimmer [%] | 7.93 | 1.10 | 7.93 | 7.15 | 8.71 |
| HNR [dB] | 13.33 | 1.70 | 13.33 | 12.13 | 14.53 |
| Fn [Hz] | 2386.74 | 13.11 | 2386.74 | 2377.47 | 2396.02 |
| Pf [Z] | -0.63 | 0.26 | -0.63 | -0.81 | -0.44 |
| Df [Hz] | 1145.97 | 56.23 | 1145.97 | 1106.21 | 1185.72 |
| ΔF [Hz] | 1226.50 | 19.39 | 1226.50 | 1212.79 | 1240.21 |
b) Voice recording procedure
All speakers’ voices were recorded using dynamic cardioid microphone Shure SM 58 SE connected to an amplifier IMG Stageline MPA-202 and, subsequently, to the sound card of the computer Dell Latitude E6400. The microphone was situated on the tripod at the eye level of each participant at 20 cm from the tip of the mouth. All voices were recorded under the same acoustic conditions: a silent room with an acoustic cabin Mozos Mshield on the top of the tripod (microphone inside), a time of the day (9–12 am), an equal acoustic background for all recordings (~39 dB). Each speaker was asked to say aloud (in Polish language) the following: “Głos jest falą akustyczną, powstającą w głośni (english translation: Voice is a soundwave that arises in the glottis)” with comfortable pitch and loudness. All sound files were recorded with equal sampling frequency (44.1 kHz, 16-bit resolution) as uncompressed format mono files (.wav). The similar procedure was previously described in Pawelec et al. (2022a; 2022b).
c) Acoustic analysis of speakers’ voices
Acoustic analysis of speakers’ voices was performed in Praat software v 3.9.2. (Boersma & Weenink 2019). The acoustic analysis was made based on the entire recording (sentence: “Głos jest falą akustyczną…”). Based on the recorded sample, the following acoustic parameters of the voice were determined:
For fundamental frequency pitch floor was set to 75 Hz and pitch ceiling to 300 Hz for male and 100–500 Hz for female speakers. Formant ceiling was 5000 Hz for men and 5500 Hz for women.
a) Competent judges selection criteria
A group of competent “Judges” was selected from female students of the Faculty of Biology and Animal Science at the Wroclaw University of Environmental and Life Sciences. Volunteers were asked to complete a questionnaire regarding their sex, age, sexual orientation, whether they had a hearing impairment as well as information regarding the current phase of the menstrual cycle (the first day of the last menstruation and the average length of the menstrual cycle and menstrual bleeding) or taking hormonal agents (e.g. hormonal contraception). Study participants with hearing impairments and women with an irregular length of the monthly cycle, were excluded from the group of “Judges”. Finally, 87 competent judges were selected for the experiment procedure. The median age of “Judges” was 22 years old. All study participants agreed to participate in the study free of charge and on a voluntary basis.
b) Speaker’s fatness assessment procedure
The assessment procedure was carried out among 6 student’s groups, each of about 15–16 individuals in the same room (classroom) with equal acoustic condition. A JBL Go2 loudspeaker was used to play back the voice recordings, connected to a laptop Acer Aspire 5 via an AUX cable. Voices were played at the same (maximum) volume level. There were two independent experiments:
Experiment I
In the first experiment “Judges” were asked to listen to 4 series of 3 voices within each one (4 triads). First and second triads consisted of only female voices, third and fourth triads of male voices only. In each triad one per three voices belonged to the obese speaker (BMI>30; VFL>18); the other two voices were from people of normal weight (BMI<25, VFL<9). Each triad comprised of people of comparable age. “Judges” had to choose only one out of 3 voices within each triad, which in their opinion belongs to an obese individual. An estimation of how many judges indicated a given voice as belonging to the obese individual was then conducted. The chosen voice within each triad was considered to be the modal value (dominant), i.e., the voice that was selected the most times during the 4 weeks of the experiment (women assessed the voices 4 times – once a week for a month, in each of the 4 phases of the menstrual cycle). Accurate typing was considered when the speaker within each triad was selected by over 33.3% of all “Judges” (a greater percentage of typing than the probability would suggest).
Experiment II
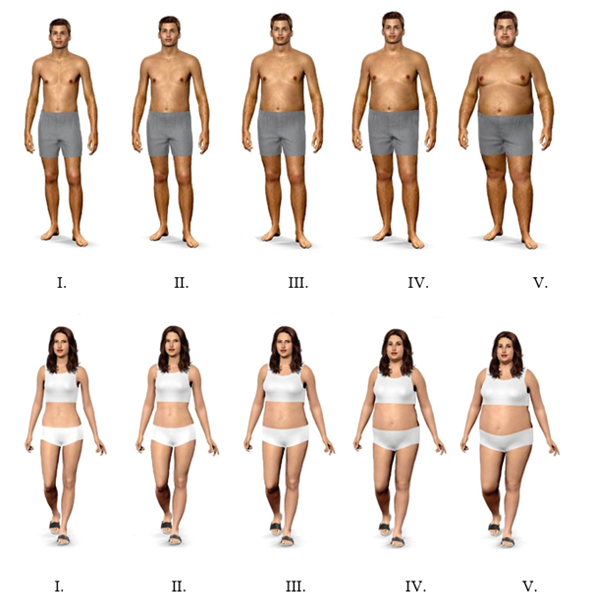
In the experiment II, “Judges” were asked to listen to 12 subsequent voices (the same that in experiment I: 4 triads * 3 voices) and indicate the silhouette (Fig. 1) that best suits, in their opinion, the appearance of the speaker, based on voice alone. Model silhouettes presented on a 5-point scale were performed using a website http://modelmydiet.com (access: 2. July 2022) and have been classified according to the following classification: 1 – underweight, 2 – normal weight, 3 – overweight, 4 – 1st degree obesity, 5 – 3rd degree obesity. Male models with a body height of 170 cm were given the following body weight values: 50 kg (BMI = 17.3), 67 kg (BMI = 23.2), 79 kg (BMI = 27.3), 95 kg (BMI = 32.9), 130 kg (BMI = 45.0). Female models with a body height of 165 cm the following body weights were given: 45 kg (BMI = 16.5), 57 kg (BMI = 20.9), 75 kg (BMI = 27.5), 90 kg (BMI = 33.1) and 120 kg (BMI = 44.1). Manipulation of the body weight of the silhouettes caused visual changes in the level of adipose tissue (especially abdominal fat and fat around the neck and face of male and female figures). Those 5 silhouettes reflected actual speaker fatness – figures from 1 to 2 could be compared with normal weight speakers (BMI<25; VFL<9; demonstrated in Table 1., headings A1 and B1); figures 3–5 may be perceived as obese speakers (BMI>25; VFL>9; demonstrated in Table 1., headings A2 and B2). Furthermore, some previous research showed that BMI and percentage body fat are highly positively correlated (Janjić et al. 2016; Ramel et al. 2013).
The assessment was performed 4 times (for 4 consecutive weeks, once in each phase of the menstrual cycle). Due to the lack of differences in the assessment of the silhouette (Fig. 1) depending on the phase of the menstrual cycle, sexual orientation, and the use/absence of hormonal contraception (data not shown), the ratings made by women “Judges” were averaged using the modal value (or the median in the case of multiple dominant).
The “Judges” were not informed about the identity of the speakers and, thus, none of the judges was able to identify the ID of any of the speakers.
The basic parameters of the speakers and judges were provided using descriptive statistics, i.e., mean, standard deviation, min-max range.
To analyse the results from the Experiment I, univariate chi-square test was used independently for each triad. The test value was then compared with the critical value of the chi-square test for 2 degrees of freedom (df = 3 speakers – 1 = 2) to derive the significance level (p-value) using the probability calculator in Statistica software.
For Experiment II judicial compliance was assessed both within each of the 6 groups as well as between these groups. Within-group compliance was performed using Kendall’s W coefficient of concordance. The test results were categorized using the intervals specified in the Garbaniuk (2016) study. Intergroup compatibility was performed using Kruskal-Wallis H test due to ordinal scale of dependent variable (silhouette assessment). Subsequently, an assessment of the accuracy of judges rating was performed. To compare ratings based on graphic scale (Fig. 1) between obese and normal weight speakers U Mann-Whitney test was applied, because of ordinal scale of dependent variable. Finally, the relationship between acoustic parameters of speakers’ voices and silhouette ratings (I–V) was calculated using Spearman rank correlation (R). In addition, the multiple regression stepwise backward model was performed.
All statistical analyses were performed using the Statistica 13. software (1984–2017 TIBCO Software Inc, Palo Alto, California, USA). P-values below 0.05 were considered statistically significant.
Descriptive data of all 12 speakers including body build and voice parameters were shown in Table 1. The mean age of the judges was 22 years (SD = 1.3 y.; range: 19–27 y.). Most of the respondents did not take hormonal drugs, 22.7% of women used hormonal contraception. The largest percentage of judges were heterosexuals.
Experiment I
The accuracy of assignment was assessed separately for each of the 4 triads and results are presented in Table 2. Within each of the subgroups the obese speakers are marked in gray. In 3 out of 4 subgroups, the judges correctly typed speakers who were obese.
Table 2. Assignment accuracy of voice belonging to a person with obesity in each triad by female “Judges”. Obese people are marked in gray. (Experiment I)
| Triad |
Female “judges ” (n = 87) |
|||
| n | % | Chi-square test | ||
|
1 (female speakers’ voices) |
Speaker 1 | 5 | 5.7 |
χ2 = 57.38 p < 0.001 |
| Speaker 2 | 61 | 70.1 | ||
| Speaker 3 | 21 | 24.2 | ||
|
2 (female speakers’ voices) |
Speaker 4 | 3 | 3.4 |
χ2 = 43.31 p < 0.001 |
| Speaker 5 | 31 | 35.6 | ||
| Speaker 6 | 53 | 60.9 | ||
|
3 (male speakers’ voices) |
Speaker 7 | 35 | 40.2 |
χ2 = 2.14 p = 0.3430 |
| Speaker 8 | 24 | 27.6 | ||
| Speaker 9 | 28 | 32.2 | ||
|
4 (male speakers’ voices) |
Speaker 10 | 17 | 19.5 |
χ2 = 8.07 p = 0.0177 |
| Speaker 11 | 38 | 43.7 | ||
| Speaker 12 | 32 | 36.8 | ||
Regarding the correct identification of obese speakers, the difference in accuracy was performed. The differences were insignificant only for the third triad (χ2 = 2.14, p = 0.3430); for the remaining triads, the results were statistically significant (p < 0.05).
Experiment II
a) Judge compliance assessment
Within-group compliance. In 5 out of 6 examined groups of “Judges” a moderate agreement range of judicial compliance (0.4 < W < 0.59) was estimated (Table 3).
Table 3. Within-group compliance of “judges” ratings. Kendall’s coefficient of concordance. (Experiment II)
| “Judges” group | “Judges” compliance values | Assessment of the degree of judicial compliance | |
| Group 1 | χ2 | 74.31 | moderate |
| W | 0.46 | ||
| p | <0.001 | ||
| Group 2 | χ2 | 91.11 | moderate |
| W | 0.50 | ||
| p | <0.001 | ||
| Group 3 | χ2 | 80.23 | moderate |
| W | 0.46 | ||
| p | <0.001 | ||
| Group 4 | χ2 | 71.16 | moderate |
| W | 0.43 | ||
| p | <0.001 | ||
| Group 5 | χ2 | 66.53 | fair |
| W | 0.34 | ||
| p | <0.001 | ||
| Group 6 | χ2 | 58.32 | moderate |
| W | 0.44 | ||
| p | <0.001 | ||
Intergroup compliance. Kruskal-Wallis test revealed no significant differences between ratings of 6 judges groups for 10 out of 12 speakers’ voices (Table 4).
Table 4. Inter-group compliance of “judges” ratings. Kruskal-Wallis H test. (Experiment II)
| Speakers’ voices | Sex | Kruskal-Wallis test (H) | p-value |
| Speaker 1 | F | 8.51 | 0.2025 |
| Speaker 2 | F | 9.05 | 0.1600 |
| Speaker 3 | F | 14.10 | 0.0265 |
| Speaker 4 | F | 4.89 | 0.5820 |
| Speaker 5 | F | 4.96 | 0.5444 |
| Speaker 6 | F | 14.34 | 0.0267 |
| Speaker 7 | M | 2.08 | 0.9145 |
| Speaker 8 | M | 5.59 | 0.5089 |
| Speaker 9 | M | 2.34 | 0.8991 |
| Speaker 10 | M | 2.44 | 0.8750 |
| Speaker 11 | M | 2.34 | 0.8732 |
| Speaker 12 | M | 4.76 | 0.5601 |
Due to the fact that the level of judicial compliance within each group was at a satisfactory level and differences in assessment between all groups were not significant, the responses of “Judges” from all groups were combined for the purposes of further analyses of the accuracy of the speaker’s fatness assessments and the relationships between the speaker’s voice parameters and the fatness level rating.
c) Accuracy of speakers’ BMI assessment
An assessment of whether obese speakers received, on average, higher grades of BMI from the judges using the silhouette scale (Fig. 1) than subjects with normal body weight was then performed. For comparison, the scores of all “Judges” from all 6 groups were considered in the analysis- 696 scores of speakers of normal body weight and 348 scores of obese speakers were obtained. Obese speakers were rated as higher (the higher the rate, the greater BMI category; Fig.1) than individuals of normal weight (Table 5). In the case of normal weight speakers, the most common rate was 3 and for obese participants – 4.
Fig. 1. Male (top) and female (bottom) silhouettes of different types of fatness
Table 5. Normal weight and obese speakers assessment. Mann-Whitney test. (Experiment II)
| Speakers’ fatness type (n-number of ratings in total from 6 groups) | Mann-Whitney U test | ||||||||||
| Normal weight (n = 696) | Obese (n = 348) | ||||||||||
| Mean rank | Me | Q | Mo | Mean rank | Me | Q | Mo | U | Z | p | |
| Silhouette rating (I-V) | 498.27 | 3 | 1 | 3 | 570.95 | 3 | 1 | 4 | 104243.00 | -3.67 | <0.001 |
Me – median value, Mo – modal value, Q – quartile deviation.
c) BMI assessment and speakers’ acoustic parameters
Due to a high correlation between some acoustic parameters values among men and women, not all of them were used in the regression model. For example in male speakers jitter was highly correlated with HNR (r = -0.98), Pf (r = 0.91), ΔF (r = 0.92); Pf was correlated with Fn (r = 1.00); intensity and shimmer (r = -0.82). Therefore, the following parameters were included in the stepwise regression model analysis: F0, shimmer, HNR, Df, Pf while the redundant parameters (Fn, jitter, intensity) were excluded.
In female speakers HNR and shimmer were highly correlated (r = -0.90); Pf and Fn (r = 1.00); ΔF (r = -0.99). Therefore, the following acoustic parameters were included in the model: F0, shimmer, intensity, Df, Pf as predictors while the redundant parameters (HNR, Fn) were discarded.
Male speakers with lower HNR/the higher formant dispersion (Df) received higher ratings on the BMI silhouette scale (i.e., these speakers were perceived as more obese). Female speakers with lower formant position (Pf) and higher intensity (loudness) received higher ratings on the BMI silhouette scale (Table 6).
Table 6. Relationships between silhouette BMI rating (dependent variable) and voice acoustic parameters (predictors). Zero order correlations and multiple stepwise backward regression models
| Acoustic parameter | r | rs | β | t | p | R2 and F statistic |
| Male speakers’ voices (n = 522 rates) | ||||||
| -First model- | ||||||
| F0 | -0.21*** | -0.24*** | 0.17 | 2.42 | 0.0158 |
R2adj. = 16.39 F=21.44; p<0.001 |
| Shimmer | -0.004 | -0.02 | 0.05 | 1.12 | 0.2628 | |
| HNR | -0.37*** | -0.33*** | -0.70 | -5.85 | <0.001 | |
| Df | 0.21*** | 0.27*** | 0.15 | 3.29 | 0.0011 | |
| Pf | 0.28*** | 0.24*** | -0.29 | -2.97 | 0.0031 | |
| -Final model- | ||||||
| HNR | -0.37*** | -0.33*** | -0.34 | -8.06 | <0.001 |
R2adj. = 14.83 F=46.34; p<0.001 |
| Df | 0.21*** | 0.27*** | 0.13 | 3.04 | 0.0027 | |
| Female speakers’ voices (n = 522 rates) | ||||||
| -First model- | ||||||
| F0 | -0.05 | 0.15*** | -0.11 | -2.02 | 0.0441 |
R2adj. = 43.56 F=81.43; p<0.001 |
| Shimmer | 0.06 | -0.09* | -0.05 | -1.34 | 0.1823 | |
| Df | -0.55** | -0.58*** | 0.03 | 0.38 | 0.7040 | |
| Pf | -0.32*** | -0.36*** | -0.13 | -3.20 | 0.0015 | |
| Intensity | 0.64** | 0.63*** | 0.65 | 8.17 | <0.001 | |
| -Final model- | ||||||
| Pf | -0.32*** | -0.36*** | -0.17 | -5.04 | <0.001 |
R2adj. = 43.00 F=197.53; p<0.001 |
| Intensity | 0.64** | 0.63*** | 0.59 | 17.41 | <0.001 | |
r – zero order Pearson’s correlation; rs – zero order Spearman’s correlation; β – beta regression coefficient; t, p – t-statistic and significance level of β; R2adj. – adjusted R-squared of a model; *p ≤ 0.05; **p ≤ 0.01; ***p ≤ 0.001.
The accuracy of the speaker’s BMI assessment was found in both experiments; female “Judges” accurately chose obese speakers and gave higher ratings for silhouettes’ BMI category (Fig. 1) to speakers who were obese. Furthermore, within- and inter-group judges’ agreement regarding speakers’ BMI evaluation was high.
There have not been, to our knowledge, any studies looking at BMI assessment based on vocal cues which makes it rather difficult to discuss the results of our findings within the context of similar research. Still, several studies have investigated the accuracy of the speakers’ physical parameters assessment (i.e., body height and weight) from the voice alone. For example, some of these studies found that estimated and actual body weight of the speakers were significantly corelated (Brueckert et al. 2006; Collins 2000; Krauss et al. 2002; Lass and Davis 1976; Lass et al. 1978). However, these studies did not assess BMI level (fatness/obesity) but, instead, absolute body weight of the speakers. The only work, to our knowledge, on the assessment of the speaker’s obesity (based on BMI) was conducted by Lee et al. (2013) showing that, by using artificial intelligence (machine learning methods), the researchers were able to assess the BMI category of patients (normal, overweight, obese) solely based on the analysis of voice parameters.
There have been some studies showing the relationship between a speaker’s fatness and his/her voice characteristics. For instance, some researchers found a significant positive correlation between trunk visceral fat/absolute fat mass and vocal parameters, such as shimmer and formant dispersion (Df; Hamdan et al. 2012; 2013b). Moreover, Da Cunha et al. (2009) found that obese individuals had greater values of both perturbation parameters (jitter, shimmer) and voice noises as well as reduced maximum phonation time (MPT) compared to those with normal weight. Similarly, other studies revealed that obese people exhibited lower value of fundamental frequency (F0; Barties et al. 2013; Souza and Santos 2018) and shorter MPT compared to participants with body mass index within a normal range (Celebi et al. 2013; Santos 2014; Souza and Santos 2018). Interestingly, one study found differences in subjective voice quality between obese and normal weight individuals. Specifically, Celebi et al. (2013) found that there was a significant difference in GRBAS scores (perceptual evaluation of Grade-Roughness-Breathiness-Asthenia-Strain using a scale of 0–3) – mean value for obese subjects was 1 and for control group: 0.2 (scale values meaning: 0 – normal, 1 – mild, 2 – moderate, 3 – severe voice disorders). This study suggests that obese individuals tend to have significantly different voice characteristics (objective and subjective) than those with normal body weight. These differences can be caused by abnormal fat deposits in obese individuals localized on the uvula, pharyngeal walls, tongue, and soft palate (Da Cunha et al. 2009). Alternatively, glucose-related changes in voice may contribute to this relationship (Hamdan et al. 2013a; Pyniopodjanard et al. 2021; Sidorova et al. 2020). Since obese people often have metabolic disorders of glucose, hyperglycemia may influence changes in the elastic properties of the biological tissues that build the larynx and the cords (Wang et al. 2015). Other diabetic complications affecting quality of voice, such as neuropathy (laryngeal sensory neuropathy is more common in patients with type 2 diabetes mellitus than in controls; Hamdan et al. 2014; Ravi and Gunjawate 2019) and gastro-oesophageal reflux disorder (Lechein et al. 2017) also cannot be discarded. Since there are such large differences in voice quality of obese people, “Judges” should be able to identify people with normal body weight and obese people solely on the basis of their voices, and our study shows that. Firstly, “Judges” indentify obese speakers with a high accuracy (probability greater than a chance, > 33.3%). Secondly, we showed that obese speakers got higher rank in 5-point scale (Fig. 1; obese: Mo = 4, normal weight: Mo = 3), which means that their silhouettes were rated as having greater BMI (possibly, but not necessarily, resulting from more fat deposits). Lastly, “Judges” were consistent in their judgments both within and between each of the six groups suggesting that the differences in ratings are not artifacts, but, rather, reflect specific trends in assessing the BMI level based on voice perception.
The results of our study show that “Judges” during their assessment were guided by specific voice parameters. For example, male speakers with lower harmonics-to-noise ratio (HNR) and higher formant dispersion (Df) were judged to be fatter. It means that men with more unstable voices (less harmonics, more noises) and higher dispersion of formant frequencies were perceived as being more obese. HNR has been suggested to be a measure of voice aging as its lower values were observed in elderly individuals (Ferrand 2002). Furthermore, men with higher Df were rated as having greater BMI. In contrast, other studies show that larger individuals (taller, heavier) have lower spread of formant values (Evans et al. 2006; González 2004; Pawelec et al. 2022a; Pisanski et al. 2014). In addition, Collins (2000) found that men with lower formants were assessed as taller, heavier, and more muscular, while Sell et al. (2006) found that men with lower Df are perceived as physically stronger. In the light of the above studies, the results of our study are rather puzzling. Perhaps, lower formant dispersion, which is strongly negatively related to body size (Fitch 1997) and physical and social dominance (Puts et al. 2007), could be perceived by women as a signal of health and masculinity (male fitness). Therefore, judges may assess men with higher value of Df as having worse biological condition and health (e.g., obese).
Our study shows that formant position (Pf) of female speakers was associated negatively and voice intensity (loudness) was correlated positively with silhouette ratings. Therefore, female speakers with lower Pf and higher intensity were rated as having greater BMI. Formant position is a parameter proposed by Puts et al. (2012) as a better alternative to formant dispersion (Df). This vocal characteristic was found to be negatively correlated in men with salivary IgA – a marker of immunocompetence (Arnocky et al. 2018). Pf was also found to be negatively associated with body height but not with adiposity among peripubertal Bolivian Tsimane women (Hodges-Simeon et al. 2014). Interestingly, in our study “Judges” rated women with lower Pf as more obese, i.e., in worse biological condition. The results of our study regarding loudness and the silhouette assessment could be more comparable with findings of other studies. For example, Barties et al. (2013) found that obese women had significantly louder (higher voice intensity [dB]) voices compared to women of underweight or normal weight. The authors of the study suggest that: “OB [obese] subjects have greater diaphragmatic motion and weight, and therefore have higher respiratory muscle motion” (Barties et al. 2013: 316). Similarly, Kantarci et al. (2004) showed that individuals with BMI above 30 kg/m2 and waist circumference longer than 100 cm had greater diaphragmatic motion. To sum up, we found that vocal parameters describing formants, harmonics/noises and voice intensity level were critical factors while assessing the speakers’ BMI.
The sample size was quite small – only 12 speakers (including 6 women) four of whom (2 men and 2 women) were obese. Therefore, our sample of obese individuals (n = 4) may not be representative of the entire obese population in terms of voice parameters. A larger sample of obese study participants would better reflect the actual trends in assessing the degree of obesity based on voice perception.
A rather unclear relationships, e.g., assessing women with lower Pf and men with higher Df as more obese, may, to some extent, result from the adopted methodology in our study. Judges were asked to choose one among 5 silhouettes which differed in BMI values. Together with adiposity (BMI) changes (different absolute body weight [kg] values for equal body height), body proportions also changed. For male and female silhouettes, the relation between waist and hip circumferences (WHR) have changed. Perhaps “Judges” considered this ratio variation when listening to speakers’ voices, more than absolute BMI level. The possible solution to this problem could be the use of a slightly different graphic scale of the speakers’ silhouettes, similar to the one used in the research of Singh (1993; 1995), where the author presented the gradation of the WHR separately for different BMI values.
This study revealed that human voice provides a meaningful information regarding BMI level (degree of obesity). “Judges” within- as well as inter-group compliance of speaker’s BMI were quite consistent in terms of the accuracy of fat silhouette assessment. Higher rates of obesity level on average were given to speakers who really were obese. In women, some acoustic parameters, such as HNR and Df in men and Pf and Intensity, were associated with speakers’ BMI assessment. To the best of our knowledge, this is the first study assessing BMI of speakers (their obesity or lack of it) based on their voices, which makes it difficult to relate the results of our study to other studies and draw consistent conclusions. Our findings might also suggest that, in near future, commercially available mobile apps could be used to measure BMI. Although our study demonstrates the potential of assessing BMI based on voice cues, a development of effective method for estimating the degree of BMI based on the voice is needed. Potentially, this technology could be used in sciences, such as dietetics or criminology, to determine the degree of obesity of a patient remotely (or using a mobile application) or to identify a perpetrator of a crime in situations when law enforcement authorities rely solely on a voice recording of a suspect (e.g., from a telephone conversation with a blackmailer). However, in order to fully appreciate the potential of our study, further research is needed on the role of human voice in BMI assessment.
Acknowledgements
We would like to express our gratitude to all the participants who gave their time and took part in our study and helped with our research. Either those who judged the voice and those who have given their voice as well as anthropometric measurements for evaluation.
Without their participation, the entire study could not have taken place.
Funding
The material for this study was collected thanks to funding under the project N020 – Fundusz Wsparcia Badań Naukowych – Bon Doktoranta Szkoły Doktorskiej, number N020/0008/20 granted by Wroclaw University of Environmental and Life Sciences, Poland.
* Corresponding author: Łukasz Pawelec, Kożuchowska 5, 51-631 Wrocław, Poland, 694 971 438; e-mail: lukasz.pawelec@upwr.edu.pl
Armstrong MM, Lee AJ, Feinberg DR. 2019. A house of cards: bias in perception of body size mediates the relationship between voice pitch and perceptions of dominance. Anim Behav 147:43–51, https://doi.org/10.1016/j.anbehav.2018.11.005
Arnocky S, Hodges-Simeon CR, Ouellette D, Albert G. 2018. Do men with more masculine voices have better immunocompetence? Evol Hum Behav 39(6):602–10, https://doi.org/10.1016/j.evolhumbehav.2018.06.003
Barsties B, Verfaillie R, Roy N, Maryn Y. 2013. Do body mass index and fat volume influence vocal quality, phonatory range, and aerodynamics in females? CoDAS 25(4):310–318, https://doi.org/10.1590/s2317-17822013000400003
Boersma P, Weenink D. 2019. Praat: doing phonetics by computer [Computer program]. Version 6.0.56; http://www.praat.org/ [Accessed 20 June 2019].
Byeon H, Cha S. 2020. Evaluating the effects of smoking on the voice and subjective voice problems using a meta-analysis approach. Sci Rep 10(1):1–8, https://doi.org/10.1038/s41598-020-61565-3
Celebi S, Yelken K, Develioglu ON, Topak M, Celik O, Ipek HD, Kulekci M. 2013. Acoustic, perceptual and aerodynamic voice evaluation in an obese population. J Laryngol Otol 127(10):987–90, https://doi.org/10.1017/S0022215113001916
Collins SA. 2000. Men’s voices and women’s choices. Anim behav 60(6):773–780, https://doi.org/10.1006/anbe.2000.1523
Da Cunha MGB, Passerotti GH, Weber R, Zilberstein B, Cecconello I. 2009. Voice feature characteristic in morbid obese population. Obes Surg 21(3):340–4, https://doi.org/10.1007/s11695-009-9959-7
Evans S, Neave N, Wakelin D. 2006. Relationships between vocal characteristics and body size and shape in human males: An evolutionary explanation for a deep male voice. Biol Psychol 72(2):160–3, https://doi.org/10.1016/j.biopsycho.2005.09.003
Fant G. 1970. Acoustic theory of speech production (No. 2). Walter de Gruyter. https://doi.org/10.1515/9783110873429.13
Ferrand CT. 2002. Harmonics-to-noise ratio: An index of vocal aging. J Voice 16(4):480–7, https://doi.org/10.1016/S0892-1997(02)00123-6
Fitch WT. 1997. Vocal tract length and formant frequency dispersion correlate with body size in rhesus macaques. J Acoust Soc Am 102(2):1213–22, https://doi.org/10.1121/1.421048
Garbaniuk O. 2016. Wykorzystywanie procedury sędziów kompetentnych w naukach społecznych i możliwości jej oceny psychometrycznej za pomocą narzędzi dostępnych w Statistica. Uniwersytet Zielonogórski i Katolicki Uniwersytet Lubelski Jana Pawła II. https://doi.org/10.33141/po.2020.12.02
González J. 2004. Formant frequencies and body size of speaker: A weak relationship in adult humans. J Phon Academic Press 32(2):277–87, https://doi.org/10.1016/S0095-4470(03)00049-4
Gregory SW. 1994. Sounds of power and deference: acoustic analysis of macro social constraints on micro interaction. Sociol Perspect 37:497–526, https://doi.org/10.2307/1389277
Hamdan ALH, Al-Barazi R, Tabri D, Saade R, Kutkut I, Sinno S, Nassar J. 2012. Relationship between acoustic parameters and body mass analysis in young males. J Voice 26(2):144–7, https://doi.org/10.1016/j.jvoice.2011.01.011
Hamdan ALH, Jabbour J, Nassar J, Dahouk I, Azar ST. 2013a. Vocal characteristics in patients with type 2 diabetes mellitus. Eur Arch Oto-Rhino-L 269(5):1489–95, https://doi.org/10.1016/j.jvoice.2012.09.005
Hamdan ALH, Al Barazi R, Khneizer G, Turfe Z, Sinno S, Ashkar J, Tabri D. 2013b. Formant frequency in relation to body mass composition. J Voice 27(5):567–71, https://doi.org/10.1016/j.jvoice.2012.09.005
Hamdan ALH, Dowli A, Barazi R, Jabbour J, Azar S. 2014. Laryngeal sensory neuropathy in patients with diabetes mellitus. J Laryngol Otol 128(8):725–9, https://doi.org/10.1017/S002221511400139X
Hodges-Simeon CR, Gurven M, Puts DA, Gaulin SJC. 2014. Vocal fundamental and formant frequencies are honest signals of threat potential in peripubertal males. Behav Ecol 25(4):984–8, https://doi.org/10.1093/beheco/aru081
Hughes SM, Harrison MA, Gallup Jr GG. 2002. The sound of symmetry: Voice as a marker of developmental instability. Evol Hum Behav 23(3):173–80, https://doi.org/10.1016/S1090-5138(01)00099-X
Janjić J, Baltić MŽ, Glišić M, Ivanović J, Bošković M, Popović M, Lovrenović M. 2016. Relationship between body mass index and body fat percentage among adolescents from Serbian Republic Child Obes 1(2):9, https://doi.org/10.21767/2572-5394.10009
Kantarci F, Mihmanli I, Demirel MK, Harmanci K, Akman C, Aydogan F, Mihmanli A, Uysal O. 2004. Normal Diaphragmatic Motion and the Effects of Body Composition: Determination with M-Mode Sonography. J Ultrasound Med 23(2):255–60, https://doi.org/10.7863/jum.2004.23.2.255
Lass NJ, Davis M. 1976. An investigation of speaker height and weight identification. J Acoust Soc Am 60(3):700–3, https://doi.org/10.1121/1.381142
Lass NJ, Brong GW, Ciccolella SA, Walters SC, Maxwell EL. 1980. An investigation of speaker height and Weight Discriminations by means of paired comparison judgments. J Phon 8(2):205–12, https://doi.org/10.1016/S0095-4470(19)31465-2
Lechien JR, Finck C, Costa de Araujo P, Huet K, Delvaux V, Piccaluga M, Harmegnies B, Saussez S. 2017. Voice outcomes of laryngopharyngeal reflux treatment: a systematic review of 1483 patients. Eur Arch Oto-Rhino-L 274(1):1–23, https://doi.org/10.1007/s00405-016-3984-7
Moreira TDC, Gadenz C, Figueiró LR, Capobianco DM, Cunha K, Ferigolo M, Barros HMT, Cassol M. 2015. Substance use, voice changes and quality of life in licit and illicit drug users. Revista CEFAC 17:374–384, https://doi.org/10.1590/1982-021620156714
Oguchi T, Kikuchi H. 1997. Voice and interpersonal attraction. Jpn Psychol Res 39:56–61, https://doi.org/10.1111/1468-5884.00037
Pawelec ŁP, Graja K, Lipowicz A. 2022a. Vocal Indicators of Size, Shape and Body Composition in Polish Men. J Voice 36(6):878.e9-878.22, https://doi.org/10.1016/j.jvoice.2020.09.011
Pawelec ŁP, Lipowicz A, Czak M, Mitas AW. 2022b. The Microphone Type and Voice Acoustic Parameters Values–A Comparative Study. In International Conference on Information Technologies in Biomedicine (pp. 421–431). Springer, Cham. https://doi.org/10.1007/978-3-031-09135-3_35
Pisanski K, Rendall D. 2011. The prioritization of voice fundamental frequency or formants in listeners’ assessments of speaker size, masculinity, and attractiveness. J Acoust Soc Am 129(4):2201–12, https://doi.org/10.1121/1.3552866
Pisański K, Fraccaro PJ, Tigue CC, O’Connor JJM, Röder S, Andrews PW, Fink B, DeBruine LM, Jones BC, Feinberg DR. 2014. Vocal indicators of body size in men and women: a meta-analysis. Anim Behav 95:89–99, https://doi.org/10.1016/j.anbehav.2014.06.011
Pisanski K, Jones BC, Fink B, O’Connor JJM, DeBruine LM, Röder S, Feinberg DR. 2016. Voice parameters predict sex-specific body morphology in men and women. Anim Behav 112:13–22, https://doi.org/10.1016/j.anbehav.2015.11.008
Pisanski K, Oleszkiewicz A, Sorokowska A. 2016. Can blind persons accurately assess body size from the voice? Biol Lett 12(4), https://doi.org/10.1098/rsbl.2016.0063
Puts DA, Gaulin SJC, Verdolini K. 2006. Dominance and the evolution of sexual dimorphism in human voice pitch. Evol Hum Behav 27:283–296, https://doi.org/10.1016/j.evolhumbehav.2005.11.003
Puts DA, Hodges CR, Cárdenas RA, Gaulin SJ. 2007. Men’s voices as dominance signals: vocal fundamental and formant frequencies influence dominance attributions among men. Evol Hum Behav 28(5):340–4, https://doi.org/10.1016/j.evolhumbehav.2007.05.002
Puts DA, Apicella CL, Cárdenas RA. 2012. Masculine voices signal men’s threat potential in forager and industrial societies. Proc Royal Soc B 279(1728):601–9, https://doi.org/10.1098/rspb.2011.0829
Raine J, Pisanski K, Simner J, Reby D. 2019. Vocal communication of simulated pain. Bioacoustics 28(5):404–26, https://doi.org/10.1080/09524622.2018.1463295
Ramel A, Halldorsson TI, Tryggvadottir EA, Martinez JA, Kiely M, Bandarra NM, Thorsdottir I. 2013. Relationship between BMI and body fatness in three European countries. Eur J Clin Nutr, 67(3):254–8, https://doi.org/10.1038/ejcn.2013.6
Ravi R, Gunjawate DR. 2019. Effect of diabetes mellitus on voice: a systematic review. Pract Diabetes 36(5):177–80, https://doi.org/10.1002/pdi.2240
Rendall D, Kollias S, Ney C, Lloyd P. 2005. Pitch (F0) and formant profiles of human vowels and vowel-like baboon grunts: The role of vocalizer body size and voice-acoustic allometry. J Acoust Soc Am 117(2):944–55, https://doi.org/10.1121/1.1848011
Rendall D, Vokey JR, Nemeth C. 2007. Lifting the Curtain on the Wizard of Oz: Biased Voice-Based Impressions of Speaker Size. J Exp Psychol Hum Percept Perform 33(5):1208–19, https://doi.org/10.1037/0096-1523.33.5.1208
Souza LB, Pereira RM, Santos MM, Godoy CM. 2014. Fundamental frequency, phonation maximum time and vocal complaints in morbidly obese women. Arq Bras Cir Dig 27(1):43–6, https://doi.org/10.1590/S0102-67202014000100011
Sell A, Bryant GA, Cosmides L, Tooby J, Sznycer D, Von Rueden C, Krauss A, Gurven M. 2010. Adaptations in humans for assessing physical strength from the voice. Proc Royal Soc B 277(1699):3509–18, https://doi.org/10.1098/rspb.2010.0769
Sidorova J, Carbonell P, Čukić M. 2020. Blood glucose estimation from voice: first review of successes and challenges. J Voice. Epub ahead of print, https://doi.org/10.1016/j.jvoice.2020.08.034
Singh D. 1993. Adaptive significance of female physical attractiveness: role of waist-to-hip ratio. J Pers Soc Psychol 65(2):293–307, https://doi.org/10.1037//0022-3514.65.2.293
Singh D. 1995. Female judgment of male attractiveness and desirability for relationships: role of waist-to-hip ratio and financial status. J Pers Soc Psychol 69(6):1089–101, https://doi.org/10.1037//0022-3514.69.6.1089
Pinyopodjanard S, Suppakitjanusant P, Lomprew P, Kasemkosin N, Chailurkit L, Ongphiphadhanakul B. 2021. Instrumental acoustic voice characteristics in adults with type 2 diabetes. J Voice 35(1):116–21, https://doi.org/10.1016/j.jvoice.2019.07.003
Sondhi S, Khan M, Vijay R, Salhan AK. 2015. Vocal indicators of emotional stress. Int J Comput Appl 122(15):38–43, https://doi.org/10.5120/21780-5056
Souza LBR, Santos MM. 2018. Body mass index and acoustic voice parameters: is there a relationship? Braz J Otorhinolaryngol 84(4):410–15, https://doi.org/10.1016/j.bjorl.2017.04.003
Tarafder KH, Datta PG, Tariq A. 2012. The aging voice. BSSMU 5(1):83–86, https://doi.org/10.3329/BSMMUJ.V5I1.11033
Teixeira JP, Fernandes PO. 2014. Jitter, shimmer and HNR classification within gender, tones and vowels in healthy voices. Proc Technol 16:1228–1237, https://doi.org/10.1016/j.protcy.2014.10.138
Wang Y, Zeinali-Davarani S, Davis EC, Zhang Y. 2015. Effect of glucose on the biomechanical function of arterial elastin. J Mech Behav Biomed Mater 49:244–54, https://doi.org/10.1016/j.jmbbm.2015.04.025
Wolfe VI, Ratusnik DL, Smith FH, Northrop G. 1990. Intonation and fundamental frequency in male-to-female transsexuals. J Speech Hear Dis 55(1):43–50, https://doi.org/10.1044/jshd.5501.43


Received: 26.10.2022; Revised: 9.12.2022; Accepted: 9.12.2022