Available online at: https://doi.org/10.18778/1898-6773.85.3.02
University of Rzeszow, Rzeszow, Poland
University of Rzeszow, Rzeszow, Poland
Faculty of Physical Education, University School of Physical Education in Wroclaw, Wroclaw, Poland
Department of Anthropology and Tribal Studies, Sidho-Kanho-Birsha University, Purulia, West Bengal, India
Department of Anthropology, Ludwik Hirszfeld Institute of Immunology and Experimental Therapy, Polish Academy of Sciences, Wrocław, Poland
ABSTRACT: Objective: This study examined whether there were significant changes (expectedly increase) in BMI (Body Mass Index), and relative subcutaneous body fat during the four years of study in a university and compared these changes between the students of different courses, viz., Computer science, Law and administration, Humanities and Physical education.
Design: This was a prospective follow up study with measurements at two time points with gap of four years. Body mass index, Triceps, subscapular, mid-axillary, abdominal, supra-illiac and medial-calf skinfold thicknesses were measured at two points of time, just after entrance to university and again after completion of four years. Student’s T-test, one-way ANOVA, and repeated measures ANNOVA (two-way) were employed to assess significance of differences in anthropometric measures between groups of students.
Setting: The study was conducted at the University of Rzeszów, Poland.
Participants: 191 young men university students aged approximately 19.5 years and 24.0 years, at the beginning and after four years, respectively, during this study.
Results: Students of all courses underwent increments in BMI, absolute- and relative skinfold thicknesses, except that the students of physical education course did not show change in skinfold thicknesses relative to BMI.
Conclusions: It has been concluded that the change in the adiposity profile during the years of study at university varied according to the course types. Further, detailed studies on the nature and cause of such variation occurring between course types may lead to better understanding etiology of overweight and obesity before entering to adult life.
KEY WORDS: BMI, body fat, freshmen, skinfold, lifestyle.
Currently, obesity is unequivocally considered as a major global health challenge. It is not only a definite risk factor for a large number of chronic diseases but also obesity is currently regarded as a disease itself. According to the 2015 estimate, high body mass index contributed to about four million deaths globally representing 7.1% of the all cause deaths (Kushner and Kahan 2018). According to the recent statistics of The World Health Organisation, more than 1.9 billion adults, 18 years and older, were overweight while over 650 million were obese in 2016 (WHO 2016). The nationwide European Health Interview Survey (EHIS) survey in 2014 indicated that in Poland over 62% of men and nearly 46% of women were overweight (Augustynowicz et al. 2019). The occurrence of obesity and overweight is indicated by an increase in body mass index (BMI), body fat percent, waist circumference etc. Although genetic predispositions have been suggested to contribute to both obesity and overweight, human behaviour and lifestyle factors, such as physical activity (Must and Tybor 2005), and/or dietary habits (Vadiveloo et al. 2015) have also been found to influence its clinical manifestation (Yang et al. 2020).
The behaviour patterns of individuals are determined within specific cultural context while diverse choices and actions which, in turn, form a relatively stable trajectory over the life course of an individual (Wethington 2005). Human life has different transitional points at which this trajectory could be perturbed when the individuals try to build up certain strategies to adapt with the changing situations. Such transitions might occur during shifting educational levels and are generally accompanied with changes in structure and composition of peer group, altered work schedules and leisure-time activities, and finally, a cumulative effect of all these changes leads to alterations in health behaviors (Wethington 2005). Such transitions take place among young adults when they enter college after high school education. This involves several behavioral adaptations that have evolved to cope with the new conditions of life (Cluskey and Grobe 2009) and the individuals commence to adopt lifestyle and habitual behaviours that are likely to sustain through adulthood (Morseth et al. 2011; Gunes et al. 2012). It has been suggested that these lifestyle habits might lead to weight and fat gain contributing to a long-term negative health consequences (Johnson and Annesim 2018; Sun et al. 2019).
It is well documented that the transition from high school to college/university is a critical period for weight gain, a phenomenon that is popularly known ‘Freshmen 15’ (Anderson et al. 2003; Butler et al. 2004; Levitsky et al. 2004; Hoffman et al. 2006; Morrow 2006; Delinsky and Wilson 2008; Economos et al. 2008; Pliner and Saunders 2008; Racette et al. 2008), although a few suggested that such a concept of college weight gain was a paradigm based more on myth than scientific facts (Hodge et al. 1993; Graham and Jones 2002). Nevertheless, a number of studies have shown that late adolescence and early adulthood was indeed a critical time for a considerable weight gain (Papadaki et al. 2007; Vella-Zarb and Elgar 2009; Takomana and Kalimbira 2012).
In one study, male students were found to have put on weight, on average, 3.0 kg along with increases in other associated anthropometric dimensions (Pullman et al. 2009). In other studies, a weight gain, ranging from 1.3 to 3.3 kg, were reported among a large proportions of students during the early terms or first year at college (Anderson et al. 2003; Butler et al. 2004; Levitsky et al. 2004; Hoffman et al. 2006; Morrow 2006; Delinsky and Wilson 2008; Economos et al. 2008; Pliner and Saunders 2008). Yet another study reported that, following enrollment to college, more than 25% of students gained about 2.3 kg body weight within the first two months. Most of these studies found that weight gain was higher among males than females (Cluskey and Grobe 2009; Deforche et al. 2015). For instance, Deforche et al. (2015) reported that although students gained, on average, 2.7 kg of weight, a greater increase was observed in boys.
Although, college/university-student weight gain has been well-documented, hitherto, little is known regarding whether such changes in weight and other body dimensions, differ between different disciplines or study courses during the first months of transition to college/university life. Moreover, although most of the previous studies have considered the gain in body weight as the indicator of shift towards overweight and obesity, only a few took account of other measurements, such as, waist circumference and skinfold thickness (Pullman et al. 2009). Therefore, the aim of the present study was to estimate the obesity indicators, such as BMI, waist circumference and skinfold thickness at the beginning and the end of the first semester in among the male students in a university in Poland. Specifically, the study objective was to investigate whether there were significant changes (expected increase) in those measures during the four years of university life. In addition, the other aim of this study was to compare such changes between the students of different courses, viz., Computer science, Law and administration, Humanities and physical education, as well as to determine whether there was any effect of the type of study course on such changes.
This study used a repeated measures design, undertaken at two points of time, at the beginning of course by a batch of pupils and after four years of study at the University of Rzeszów, a city in South-Eastern Poland with a population of 184,000. Study participants were 191 young males aged approximately 19.5 years and 24 years, at the beginning and after four years, respectively, within the time frame of this study. Participants were enrolled for this study from four different courses, viz., Computer science (N=22; 11.5%), Law and Administration (N=44; 23.1%), Humanities (N=61; 31.9%) and Physical Education (N=64; 33.5%), at the University of Rzeszów, Poland.
All study participants were healthy without any illness or infirmity symptoms reported during, or at least one month before the study commenced. No participants were physically challenged in any way. Informed consent was obtained from each participant before enrolment for the study. Necessary permissions from the concerned university authority were also procured before commencement of the study. Ethical protocols of conducting study on human subjects were followed according to the Helsinki declaration guidelines (Goodyear et al. 2007). All the participants that had entered the particular courses at the Rzeszów University in 2013 were included in the study. After 4 years of study, the same students underwent repeated measure procedures using the same protocol and by the same person (G.B.).
One of the authors (GB), being a trained anthropometrist, took a battery of anthropometric measurements that included a total of 27 length, breadth, thickness and circumference measurements. However, for the purpose of the present study, only height, weight and six skinfold thicknesses were included in the analysis. Height and weight were measured following the standard protocol (Weiner and Lourie 1981) using standard anthropometer (GPS, Switzerland) and a standardised weight scale, respectively. Triceps, subscapular, mid-axillary, abdominal, supra-iliac and medial-calf skinfold thicknesses were measured by the Harpenden skinfold calliper on the left side of each participant. The skinfold measurement gave an estimated amount of subcutaneous fat deposition. BMI was calculated using standard formula (body weight in kg/ height in meter, squared).
Since it was not known that how much change in BMI values should be attributed to changes in subcutaneous body fat, the ratio of the sum of skinfolds-to-BMI was calculated as a standardised measure of body fatness. Higher values of the ratio indicated higher contribution of subcutaneous fat to BMI. For instance, in two persons with similar value of BMI, the ratio shows a different proportion of subcutaneous fat to body mass. Also changes in ratios reflect a change in proportions of subcutaneous fat and other component of body mass.
Descriptive statistics of mean and standard deviation (SD) were calculated for all measurements. Student T-test for dependent samples was performed in order to assess differences between two successive measurements between four years. One way ANOVA was utilised to test the significance of differences in anthropometric measures between different study disciplines. Repeated measures ANOVA was used to test whether there is a significant difference in measures between the two time points at which measurements were taken. Post hoc comparisons were done based on Tukey HSD tests. All calculations were performed by using Statistica 13.1 software.
The mean ages of the participants were 19.7 (SD = 0.61) and 24.2 (SD = 0.61) years, at the beginning and after four years of studies, respectively. The means and SD values of BMI, sum of four skinfold (SSF) thickness and SSF-to-BMI ratio at the beginning (t1) and after 4 years at the university (t2) in each study course, separately, are described in Table 1. It also shows the differences between the mean values at two points of time (t2-t1) of measurement of students, for each course separately. In all student groups, BMI showed significant differences between two measurements in each group (for each group, p<0.01) and among groups at each time of measurements (at t1, F=8.57, p<0.001; at t2, F=15.03, p<0.001). However, the groups differed significantly between themselves in the mean amount of BMI differences occurred after four years of studies (F=4.32, p<0.01).
| Study courses | BMI t1 | BMI t2 | BMI (t2-t1) | |||
| Mean | SD | Mean | SD | Mean | SD | |
| Physical education (N=64) | 20.11 | 3.91 | 21.89 | 3.29 | 1.77* | 2.29 |
| Law and administration (N=44) | 22.21 | 3.49 | 24.37 | 3.23 | 2.16* | 1.82 |
| Humanities (N=61) | 22.78 | 3.30 | 25.44 | 2.93 | 2.66* | 2.30 |
| Computer Science (N=22) | 23.36 | 1.70 | 24.19 | 1.90 | 0.83* | 0.93 |
| F=8.57; p<0.001 | F=15.03; p<0.001 | F=4.32; p<0.01 | ||||
| All students (N= 191) | 21.82 | 3.63 | 23.86 | 3.36 | 2.03 | 2.14 |
| SSF t1 | SSF t2 | SSF (t2-t1) | ||||
| Physical education (N=64) | 8.26 | 2.60 | 9.01 | 2.61 | 0.75* | 1.32 |
| Law and administration (N=44) | 7.21 | 2.91 | 9.98 | 2.82 | 2.76* | 2.15 |
| Humanity (N=61) | 7.77 | 3.29 | 9.83 | 2.87 | 2.06** | 2.35 |
| Computer science (N=22) | 8.44 | 3.10 | 9.48 | 2.70 | 1.04* | 1.62 |
| F=1.38; n.s. | F=1.37; n.s. | F=11.14; p<0.001 | ||||
| All students (N= 191) | 7.88 | 2.97 | 9.55 | 2.76 | 1.67 | 2.08 |
| SSF-to-BMI Ratio t1 | SSF-to BMI Ratio t2 | SSF-to BMI Ratio (t2-t1) | ||||
| Physical education (N=64) | 0.42 | 0.13 | 0.42 | 0.12 | -0.003 | 0.05 |
| Law and administration (N=44) | 0.32 | 0.08 | 0.41 | 0.09 | 0.089* | 0.07 |
| Humanity (N=61) | 0.33 | 0.11 | 0.38 | 0.09 | 0.051*** | 0.08 |
| Computer science (N=22) | 0.36 | 0.14 | 0.39 | 0.12 | 0.031* | 0.06 |
| F=9.03; p<0.001 | F=1.13; n.s. | F=18.03; p<0.001 | ||||
| All students (N= 191) | 0.36 | 0.12 | 0.40 | 0.11 | 0.04 | 0.07 |
In case of SSF, all groups showed significant differences (p<0.01 to p<0.001 for t-tests) within the four years of study period, but there were no significant within group differences either at the beginning or after four years of studies. The groups, however, differed significantly between themselves, with respect to the mean difference in SSF between the two points of measurements (F=11.14, p<0.001).
Regarding the SSF-to-BMI ratio, nearly all groups, showed significant increases in their mean subcutaneous fat relative to BMI values (p<0.05 to p<0.01 for t-tests), except for the students of physical education students, who did not show any increase in this ratio at the second point of time of measurements. The four groups differed significantly between them in SSF-to-BMI at the beginning of study (F=9.03, p<0.001). However, the second point of measurement after 4 years, group differences were not significant (F=1.13, p=n.s.).
The results of the two-way analyses of variance with repeated measures for the three variables (dependent), namely, BMI, SSF and SSF-to-BMI ratio, respectively, are presented in Table 2. In each analysis, course type and point of times (t2 or t1), were the two factors. Students form different study courses exhibited significantly different BMI at the beginning, and after 4 years of study, which indicates that all students increased their BMI within 4 years, however in varying degrees. For SSF, however, students did not differ between study courses. However, all significantly increased their amount of subcutaneous fat, but again, in varying degrees. Very similar result was observed for SSF-to-BMI ratio except that course of study significantly differentiated the proportion of subcutaneous fat relative to BMI values.
| BMI | SSF | SSF-to-BMI ratio | |||||||
| F | p < | Eta2 | F | p < | Eta2 | F | p < | Eta2 | |
| Course | 12.18 | 0.001 | 0.163 | 0.13 | n.s. | 0.002 | 4.22 | 0.01 | 0.063 |
| Repeated | 127.00 | 0.001 | 0.404 | 117.77 | 0.001 | 0.386 | 64.73 | 0.001 | 0.257 |
| Interaction | 4.69 | 0.01 | 0.070 | 11.14 | 0.001 | 0.152 | 18.03 | 0.001 | 0.224 |
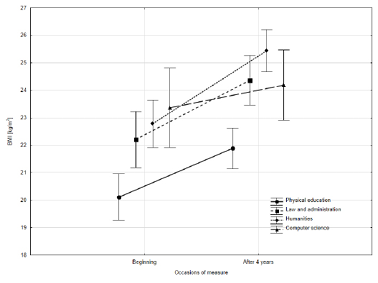
Changes in all measurements within each group are shown in Figure 1. Compared to other groups students of physical education had the lowest BMI, during both periods of measurements. They showed an increase in subcutaneous fat and BMI almost equally (post hoc, for BMI p<0.001, and for sum fat p<0.05), and therefore, had no significant changes in SSF-to-BMI ratio. Students of other 3 courses had significantly higher BMI than those of physical education course both at the beginning (post hoc for Low and administration p<0.05, for Humanities p<0.001, and for Computer sciences p<0.01), and after four years, except for Computer sciences (pot hoc for Low and Administration p<0.01, for Humanities p<0.001). In addition, among these students a significant increase in both BMI (post hoc for Low and administration p<0.001, for Humanities p<0.001) and amount of subcutaneous fat (post hoc for law and administration p<0.001, for Humanities p<0.001) was observed, except for Computer sciences. This was evident especially among the students of law and administration and humanities, although the increments were not equal. The students of these courses significantly accumulated more subcutaneous fat than other body tissue, resulting in a significant increase in the proportion of the subcutaneous fat in relation to BMI values (post hoc for law and administration p<0.001, for Humanities p<0.001).
Fig. 1. a)
Fig. 1. b)
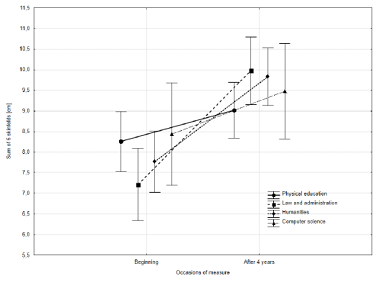
Fig. 1. c)
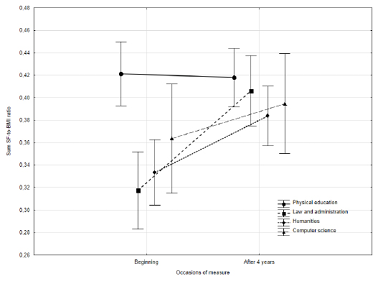
Figure 1. Changes of means in BMI (a), SSF (b) and SSF-to-BMI ratio (c) within each study course measured at two occasions
Transition to higher education has been associated with weight gain among students as well as adverse changes in health behaviours (Deforche et al. 2015). At the outset, the present study showed that students increased their BMI and subcutaneous body fat significantly in all four disciplines in a span of four years after entering the university. The increase of BMI was the highest in humanities, followed by law, physical education and computer science, respectively. The increase in SSF was similar to BMI, except that the Law students gained more SSF than those of humanities, and the students of physical education gained the least amount of SFF. Interestingly, when the proportion of this subcutaneous fat relative to BMI was estimated, the three groups showed an increase while students of physical education showed a decrease.
Several previous studies have reported dietary, attitudinal and lifestyle changes among students during the first phase after entering into higher educational institutions. A study demonstrated that during the first year of study at university, both male and female students underwent unfavorable changes in nutrition profile, body weight and composition. The males, in fact, showed more adverse changes compared to females. Body weight, fat, BMI, waist circumference and waist-hip ratio significantly increased and for all of these dimensions, males showed significantly higher gains than females (Beaudry et al. 2019). Many earlier studies have demonstrated that a diet quality in both males and females decreased over the course of first-year of university study (Breslow et al. 2006; Gorgulho et al. 2012; Takomana nd Kalimbira 2012; Deforche et al. 2015). Increased alcohol intake was also reported in several other studies over the first year at university in both male and female students indicating a decline in overall quality of diet (Butler et al. 2004; Breslow et al. 2006; Deliens et al. 2014; Deforche et al. 2015). In some studies, the males clearly displayed more adverse and lower quality eating patterns than females (Beaudry et al. 2019; Keller et al. 2008). In a study conducted on 108 male students in Canada made a detailed observation on the anthropometric, nutritional and behavioural changes occurred during the first year at university (Pullman et al. 2009). The study revealed a significant weight gain, of 3.0 kg, on an average, accompanied by significant increases in BMI, body fat, waist circumference, hip circumference, and waist-hip ratio. However, there was no significant change in the energy and nutrient intake, as such. Instead, it was found that intentions related to the maintenance of body mass had influenced the final body mass. Moreover, the pattern and nature of aerobic physical activities significantly changed, time spent for study and sitting before computer increased significantly while hours of sleep decreased. Consumption of alcoholic drinks and frequency of binge drinking significantly increased over the period of the study (Pullman et al. 2009). The participants of the present study underwent a possible set of changes regarding choice, attitude and habits that might have brought about change in body adiposity. Although the present study did not take into account changes in dietary patterns and the amount of physical activity of study participants, it can be assumed, given the findings of the previous research, that the participants of the present study also endured some alterations in lifestyle parameters that were critical for the changes in body dimensions. Adoption of unhealthy lifestyle among young adults, especially, the students in higher education, has been reported as global phenomenon (Steptoe and Wardle 2001; Steptoe et al. 2002; Dodd et al. 2010).
The most important finding of the present study is that the magnitudes of the mean changes of the measures in four years period were not identical among the different courses. Groups differed significantly between themselves in the mean amount of increase in BMI during four years of university studies. Gain in BMI was highest in humanities, followed by law, physical education and computer science, respectively. However, the subcutaneous fat deposit showed no significant within group differences, either at the beginning, or after four years of studies. However, groups differed significantly among themselves at the final point, in respect of the mean difference occurred during four years of time span; the Law students gained more subcutaneous fat than the humanities, and the students of physical education gained the least amount. On the other hand, whereas nearly all groups showed significant increase in the mean subcutaneous fat relative to BMI values, physical education students did not show any increase in this ratio during the four years.
Present study indicated that the changes in subcutaneous fat during the four years of study depended on type of study courses, and for that matter, only the students of physical education course managed to keep the harmonious changes in body weight. The increase in fatness was, perhaps, compensated with other body tissue, most probably, the lean mass. On the contrary, the students of law and administration, followed by other two courses, increased their relative proportion of subcutaneous fat substantially. Whereas it would certainly be overambitious to draw a causal explanation for this inter-group differences in the changes in body adiposity, in view of the limited scope of this present study, an attempt could definitely be made on the basis of the background information of the participants and the nature of the respective courses. A plausible explanation of this difference between physical education and other three courses could be postulated as effect of some selection as well as specific lifestyle during the university days. The student of physical education course had to pass an entry examination that included tests of physical fitness. Only the applicants who satisfied some norms of fitness, body weight etc., were admitted to the course. This was also reflected in the lowest mean BMI in physical education students, compared to other three courses, at the beginning of study. During four years of study, they had several lessons demanding vigorous physical activity, which influenced their body composition. On the contrary, the students of the three remaining courses had to pass only theoretical entrance test only. During their study, they had only two hours per week of physical education lessons and probably spent much more time on learning theory, resulting in more sedentary lifestyle. Thus, these students also underwent a selection first, and then a specific lifestyle, both of which acted to the direction opposite to that for the physical education students. Last, but not the least, several inherent limitations of this study should be admitted before going to final conclusions. Firstly, this study did not include female students. The sample sizes for individual courses were small, especially for the computer science. There were no data on the dietary pattern, daily physical activity and specific behavioural changes that took place during the university years. However, despite several limitations, there were some novel aspects, too. No previous study had attempted to compare students of different courses in terms of changes in obesity components during the four university years. Secondly, the same students were measured after four years, thus, making it a prospective study. Many studies showed that males underwent changes in body weight and adiposity more than females. The present study, nevertheless, gave an insight as to how the males also could differ even according to different courses, too.
In conclusion, the changes in body mass, fatness, and composition during the years of study after entering into university differed according to the nature of study courses. During four years of study, the male students in all study courses sowed increase in BMI and skin folds, and the humanities students exhibited the highest increase. The SSF showed a similar trend, except the law students gaining more than those in humanities whereas the students of physical education gained the least. The subcutaneous fat to BMI ratio increased in all groups except the students of physical education showing a decrease. However, it would be too premature to draw firm conclusion and make generalised predictions about the expected changes in body mass, fatness and composition according to the nature of study courses among the ‘Freshmen’. Therefore further studies conducted in diverse set ups and various countries is needed in order to conclusively delineate the differential effects of study disciplines on changes in weight and body composition during the university days.
Acknowledgements
The authority of the University of Rzeszów and all the participants of the study are gratefully acknowledged for their kind cooperation for the fulfillment of this study.
Conflicts of interest
None.
Authors’ contribution
GB collected and digitalised data; WC supervised collection of data, designed the study; ZI participated in writing first draft and edited final draft; RC wrote first and final draft; SK made an analysis, participated in preparing first draft, edited final draft
Anderson D, Shapiro J, Lungren J. 2003. The freshman year of college as a critical period for weight gain. Eat Behav 4:363–367. https://doi.org/10.1016/S1471-0153(03)00030-8
Augustynowicz A, Czerw A, Borowska M, Deptała A, Dykowska G, Fronczak A. 2019. Prevention of overweight and obesity undertaken by local government units in Poland. Health Policy 123:499–502. https://doi.org/10.1016/j.healthpol.2019.03.006
Beaudry KM, Ludwa IA, Thomas AM, Ward WE, Falk B, Josse AR. 2019. First-year university is associated with greater body weight; body composition and adverse dietary changes in males than females. PLoS One 14:e0218554. https://doi.org/10.1371/journal.pone.0218554
Breslow RA, Guenther PM, Smothers BA. 2006. Alcohol drinking patterns and diet quality: the 1999–2000 National Health and Nutrition Examination Survey. Am J Epidemiol 163:359–66. https://doi.org/10.1093/aje/kwj050
Butler SM, Black DR, Blue CL, Gretebeck RJ. 2004. Change in diet; physical activity and body weight in female college freshman. Am J Health Behav 28:24–32. https://doi.org/10.5993/ajhb.28.1.3
Cluskey M, Grobe D. 2009. College weight gain and behavior transitions: male and female differences. J Am Diet Assoc 109:325–329. https://doi.org/10.1016/j.jada.2008.10.045
Deforche B, Van Dyck D, Deliens T, De Bourdeaudhuij I. 2015. Changes in weight; physical activity; sedentary behaviour and dietary intake during the transition to higher education: a prospective study. Int J Behav Nutr Phy Activ 12:16. https://doi.org/10.1186/s12966-015-0173-9
Deliens T, Clarys P, De Bourdeaudhuij I, Deforche B. 2014. Determinants of eating behaviour in university students: a qualitative study using focus group discussions. BMC Pub Health 14:53. https://doi.org/10.1186/1471-2458-14-53
Delinsky SS, Wilson T. 2008. Weight gain; dietary restraint; and disordered eating in the freshman year of college. Eat Behav 9:82–90. https://doi.org/10.1016/j.eatbeh.2007.06.001
Dodd LJ, Al-Nakeeb Y, Nevill A, Forshaw MJ. 2010. Lifestyle risk factors of students: A cluster analytical approach. Prev Med 51:73–77. https://doi.org/10.1016/j.ypmed.2010.04.005
Economos CD, Hildebrandt MPH, Raymond RH. 2008. College freshman stress and weight change: Differences by gender. Am J Health Behav 32:16–25. https://doi.org/10.5993/AJHB.32.1.2
Goodyear MDE, Krleza-Jeric K, Lemmens T. 2007. The Declaration of Helsinki. Br Med J 335:624–625. https://doi.org/10.1136/bmj.39339.610000.BE
Gorgulho B, Marchioni DM, Conceicao AB, Steluti J, Mussi MH, Nagai-Manelli R et al. 2012. Quality of diet of working college students. Work 41Suppl 1:5806–9. https://doi.org/10.3233/WOR-2012-0958-5806
Graham MA, Jones AL. 2002. Freshman 15: Valid theory or harmful myth? J Am Coll Health 50:171–173. https://doi.org/10.1080/07448480209596023
Gunes FE, Bekiroglu N, Imeryuz N, Agirbasli M. 2012. Relation between eating habits and a high body mass index among freshman students: a cross-sectional study. J Am Coll Nutr 31:167–74. https://doi.org/10.1080/07315724.2012.10720024
Hodge C, Jackson L, Sullivan L. 1993. The ‘freshman 15’ facts and fantasies about weight gain in college women. Psychol Women’s Health Q 17:119–126. https://doi.org/10.1111/j.1471-6402.1993.tb00680.x
Hoffman DJ, Policastro P, Quick V, Lee SY. 2006. Changes in body weight and fat mass of men and women in the first year of college: A study of the freshman 15. J Am Coll Health 52:41–45. https://doi.org/10.3200/JACH.55.1.41-46
Johnson PH, Annesim JJ. 2018. Factors Related to Weight Gain/Loss among Emerging Adults with Obesity. Am J Health Behav 42:3–16. https://doi.org/10.5993/AJHB.42.3.1
Keller S, Maddock JE, Hannöver W, Thyrian JR, Basler H. 2008. Multiple health riskbehaviors in German first year university students. Prev Med 46: 189–195. https://doi.org/10.1016/j.ypmed.2007.09.008
Kushner RF, Kahan S. 2018. Introduction: the state of obesity in 2017. Med Clin North Am 102:1–11. https://doi.org/10.1016/j.mcna.2017.08.003
Levitsky DA, Halbmaier CA, Mrdjenovic G. 2004. The freshman weight gain: A model for the study of the epidemic of obesity. Int J Obes Relat Metab Disord 28:1435–1442. https://doi.org/10.1038/sj.ijo.0802776
Morrow ML. 2006. Freshman 15: Fact or fiction? Obes 14:1438–1443. https://doi.org/10.1038/oby.2006.163
Morseth B, Jorgensen L, Emaus N, Jacobsen BK, Wilsgaard T. 2011. Tracking of leisure time physical activity during 28 yr in adults: the Tromso study. Med Sci Sports Exerc 43: 1229–34. https://doi.org/10.1249/MSS.0b013e3182084562
Must A, Tybor DJ. 2005. Physical activity and sedentary behavior: a review of longitudinal studies of weight andadiposity in youth. Int J Obes 29: Suppl 84–96. https://doi.org/10.1038/sj.ijo.0803064
Papadaki A, Hondros GJAS, Kapsokefalou M. 2007. Eating habits of university students living at; or away from home in Greece. Appetite 49:169–76. https://doi.org/10.1016/j.appet.2007.01.008
Pliner P, Saunders T. 2008. Vulnerability to freshmen weight gain as a function of dietary restraint and residence. Physiol Behav 93:76–82. https://doi.org/10.1016/j.physbeh.2007.07.017
Pullman AW, Masters RC, Zalot LC, Carde LE, Saraiva MM, Dam YY, Randall Simpson JA, Duncan AM. 2009. Effect of the transition from high school to university on anthropometric and lifestyle variables in males. Appl Physiol Nutr Metab 34:162–171. https://doi.org/10.1139/H09-007
Racette SB, Deusinger PT, Strube MJ, Heghstein RH, Deusinger PT. 2008. Changes in weight and health behaviors from freshmen through senior year of college. J Nutr Educ Behav 40:39–42. https://doi.org/10.1016/j.jneb.2007.01.001
Steptoe A, Wardle J, Cui W, Bellisle F, Zotti AM, Baranyai R, Sanderman R. 2002. Trends in smoking, diet, physical exercise, and attitudes toward health in European university students from 13 countries, 1990–2000. Prev Med 35: 97–104. https://doi.org/10.1006/pmed.2002.1048
Steptoe A, Wardle J. 2001. Health behaviour; risk awareness and emotional wellbeing in students from Eastern Europe and Western Europe. Soc Sci Med 53:1621–1630. https://doi.org/10.1016/S0277-9536(00)00446-9
Sun Y, Liu B, Snetselaar LG, Robinson JG, Wallace RB, Peterson LL et al. 2019. Association of fried food consumption with all cause; cardiovascular; and cancer mortality: prospective cohort study. Br Med J 364:k5420. https://doi.org/10.1136/bmj.k5420
Takomana G, Kalimbira AA. 2012. Weight gain; physical activity and dietary changes druing the first year at college. S Afr J Clin Nutr 25:132–9. https://doi.org/10.1080/16070658.2012.11734417
Vadiveloo M, Dixon LB, Mijanovich T, Elbel B, Parekh N. 2015. Dietary variety is inversely associated with body adiposity among US adults using a novel food diversity index. J Nutr 145:555–63. https://doi.org/10.3945/jn.114.199067
Vella-Zarb RA, Elgar FJ. 2009. The ’freshman 5’: a meta-analysis of weight gain in the freshman year of college. J Am Coll Health 58:161–6. https://doi.org/10.1080/07448480903221392
Weiner JS, Lourie JA. 1981. Practical Human Biology. New York: Academic Press.
Wethington E. 2005. An overview of the life course perspective: Implications for health and nutrition. J Nutr Educ Behav 37:115–120. https://doi.org/10.1016/s1499-4046(06)60265-0
WHO (World Health Organisation). 2016. WHO Fact Sheet: Overweight and Obesity (16 February 2016): https://www.who.int/en/news-room/fact-sheets/detail/obesity-and-overweight. Accessed: February 20, 2020.
Yang Y, Fu M, Li M, Zhang K, Zhang B, Wang S et al. 2020. O-GlcNAc transferase inhibits visceral fat lipolysis and promotes diet-induced obesity. Nat Comm 11:181. https://doi.org/10.1038/s41467-019-13914-8


Received: 2022-07-06. Revised: 2022-08-12. Accepted: 2022-08-15