Available online at: https://doi.org/10.18778/1898-6773.85.3.01
Department of Anthropology, Wroclaw University of Environmental and Life Sciences, Poland
Department of Human Biology, Department of Biological Sciences, University of Wroclaw, Poland
Department of Human Biology, Department of Biological Sciences, University of Wroclaw, Poland
ABSTRACT: Aim: In face anatomy and surgery, variation in the presence, number, location, and size of the mental foramen is discussed. Knowledge of the location of the mental foramen canal, which may led due to the possibility of accidental injury of the neurovascular bundle passing through this canal may lead to anesthesia. This study aimed to present selected anatomical features of human mandibles, focusing on the morphology of the mandibular canal and its neurovascular bundle exit in populations with different socio-economic status.
Material and methods: Selected well preserved and unharmed human skulls (N= 169) (50.3% males, 49.7% females) from two populations (rural and outskirts) from Poland were used. Populations differed in socioeconomic statuses.
Results: Obvious dimorphic differences in each analyzed population were stated and inter-population differences were observed as well. In an outskirt population sexual dimorphism was more evident. Those differences should be considered when approaching the mandibular canal during anesthetic, surgical and forensic procedures.
Discussion: The occurrence of the mental foramen is relatively constant, but location is variable, and thus, each individual may exhibit a different arrangement of bundle exits. Both the position and the direction of the exit of the neurovascular bundle were similar to other European population. However, differences in localization between those two investigated populations were observed. This may suggest that not only genetic but also environmental factors, such as living conditions and diet (which affects developmental stability), may influence the morphology of the mandibular features.
KEY WORDS: cranial openings, mental foramen, mandibular foramen, canal mandible.
Knowledge of the localization of the craniofacial foramina is of importance, mainly for dental, surgical, anesthetic and cosmetic procedures concerning the human skull (Cutright et al. 2003). Among the variety of skull foramina, mental and mandibular foramina are of greatest interest in both clinical and diagnostic practices.
The human mandible is the largest, strongest, and lowest bone in the face. Its innervation is provided by inferior alveolar nerve, a branch of the mandibular division of trigeminal (CNV) nerve (nervus trigeminus), which may be impaired due to, e.g. an accidental injury during dental or surgical procedures. A lesion to CNV may lead to local anesthesia, i.e., half of the mandibular region in the case of branches of the inferior alveolar nerve division (Gray 1985), which is described in detail by Renton et al. (2010).
The functional complexity of the human mandible has contributed to its complex structure, in which foramina and canals responsible for communication between the spaces within the human skull can be distinguished. The mandibular foramen is located in the middle of the mandibular ramus, in the inner (medial) aspect of the mandible. The mental foramen is located lateral to the mental protuberance, usually inferior to the apices of the mandibular first and second premolars. The mental foramen allows entrance of the mental nerve and blood vessels into the mandibular canal (Valente et al. 2012; Łasinski 1993; Samantha and Kharb 2013). Through the mandibular canal runs the inferior alveolar nerve and inferior alveolar artery, which provides blood supply to the lower teeth, periodonts of the buccal side and chin and lower lip (Gray 1985; Drake et al. 2010).
Inter- populations and regional differences in size and location of the mental and mandibular foramina has been reported (Green 1987; Moiseiwitsch and Hill 1998; Nayarana and Prashanthi 2003; Hasan 2012; Shenoy et al. 2012). Thus, its position, size, and number need to be considered before preparing osteotomy and other surgical procedures in the foraminal area. Although different methods of measurements of the mandibular features have been reported, the traditional anthropometric measurements with sliding calipers are most often carried out. However, some research was conducted on roentgenographs. Therefore, we should be aware of small simplification of the obtained measurements, because the results are in 2 D space, and therefore, some of the curvilinear measurements may be simplified. Moreover, anatomical variations may impede observations of some mandibular features, such as the bifid or trifid mandibular canal (Mizbah et al. 2012; Miličević et al. 2021), which may not be detected in panoramic or periapical films (Dario 2002). Its occurrence depends on the assessment method (cone- beam computed tomography or panoramic radiographs) but for anthropological and archaeological field work purposes only macroscopic assessment is useable. Radiographic assessment of mental and mandibular foramina may be tentative. Jacobs et al. (2004) reported the mental foramen was detected on 94% of panoramic radiographs, but clear visibility was only attained in only 49% of the time. Similarly, Yosue and Brooks (1989) observed the mental foramen in 87.5% of the samples, but the foramina were clearly visible only in 64% of the samples. Therefore, computed tomography seems to be the best solution in visualizing the position of the foraminal area. According to Sonick et al. (1994), average linear errors for CT investigation is only 1.8% (compared to 24% for panoramic films and 14% for periapical films).
This study aims to compare selected anatomical features of human mandibles, focusing on the morphology of the mental and mandibular foramina. Since there have been reported inter-populations and regional differences in mandibular morphology, we used 2 populations with different socioeconomic statuses to determine whether environmental (geographical) conditions, e.g., life conditions and diet (which affects developmental stability) in diverse populations can influence the morphology of the mandibular features. This study makes also clinical suggestions to reduce inadvertent damage to the mental and inferior alveolar nerve during surgical procedures or dental approaches in the foraminal area.
The study used 169 adult skulls, held at the Department of Human Biology, University of Wroclaw, Poland. The adult age of the crania was confirmed based on the closure of sphenooccipital synchondrosis. The sex of the individuals was determined based on sexually dimorphic cranial features (Workshop 1980). None of the examined skulls showed signs of cranial deformations, malformations, or trauma.
For the analysis, a selection of 2 populations from the Middle-Western European region with different socioeconomic statuses, were used:
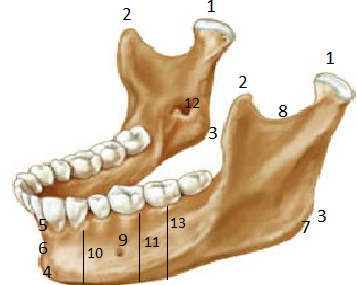
Morphometric measurements were conducted using a MicroScribe G2L, a 3D contact scanner (www.e-microscribe.com). The measurements (Tab. 1, Fig. 1) were carried out according to Martin’s instructions (Martin et al. 1988) and recorded to two decimal places of a millimeter. Each measurement was conducted twice and an average of 2 measurements was used for statistical analyses using Statistica 13.0 software (StatSoft 2016).
The mean, standard deviation (SD), and variation ranges (minimum-maximum) for each of the measurements were calculated. All variables had a normal distribution (Shapiro–Wilk test; p>0.05), mostly with homogeneous variances (Levene’s test; p>0.05). For paired comparisons, the Student t-test was used (in cases where variances were not homogenous- with Cochran-Cox adjustment) or Wilcoxon test as an alternative. For unpaired comparisons, as an alternative, the U-Mann Whitney test was used. Pearson correlation coefficient (or Spearman for non- normal distribution of the features) was also calculated. The scale according to Stanisz (1998) was used to apply the strength of the correlation:
0 < r < 0.1 very weak correlation
0.1 ≤ r < 0.3 weak correlation
0.3 ≤ r < 0.5 average correlation
0.5 ≤ r < 0.7 high correlation
0.7 ≤ r < 0.9 very height correlation
0.9 ≤ r < 1 almost complete correlation.
| Martin’s et al. (1988) measurement number | Measurements | Description of measurements | Figure 1- measurement number |
| 65 | kdl-kdl | intercondylar breadth | 1–1 |
| 65(1) | kr-kr | distance between coronoid processes | 2–2 |
| 66 | go-go | gonion- gonion distance | 3–3 |
| 68 | gn-go | gnathion- gonion distance | 4–3 |
| 69 | id-gn | infradentale- gnathion distance | 4–5 |
| 69(2) | CHM2 | mandibular corpus height below second molar | 13 |
| 70 | go-cm | mandibular ramus height gonion- caput mandibulae | |
| 70(3) | MID | mandibular incisura depth | 8 |
| 79 | MA | mandibular angle | 7 |
| kdl-kr | distance between condylar and coronoid processes | 1–2 | |
| pg- gn | pogonion- gnathion distance | 6–4 | |
| id- pg | infradentale- pogonion distance | 5–6 | |
| pg- ml | pogonion- formane mentale distance | 6–9 | |
| MinCH | minimal corpus height | 10 | |
| MaxCH | maximal corpus height | 11 | |
| MinMB | minimal mandibular breadth | ||
| MaxMB | maximal mandibular breadth | ||
| FMeB | mental foramen breadth | 9 | |
| FMaB | mandibular foramen breadth | 12 | |
| mb- ml | mandibular foramen and mental foramen distance (mandibular canal length) | ||
Fig. 1. Measurements taken in the study sample (numbers described in Table 1) (www.legacy.owensboro.kctcs.edu)
Sexual dimorphism was calculated using the formula, where:
SexDim = [(X̅m– X̅f) : X̅f] × 100%,
X̅m – male mean, X̅f – female mean.
The significance level was taken at p<0.05 (Stanisz 1998; Field 2006).
For the Sypniewo and Gródek upon the Bug River samples, for unpaired features, significant differences between those two investigated populations were found for 8 features. For the population from the Gródek upon Bug River all features had higher values than those in the Sypniewo population (except for id-pg, go-cm, and MA, although not significant) (Tab. 2).
| Features | Sypniewo | Gródek upon the Bug | Test Z | Test t | Df | p | ||||
|
X̅ |
SD | N |
X̅ |
SD | N | |||||
| go-go | 95.8 | 7.1 | 38 | 100.5 | 7.4 | 41 | 2.68 | p3=0.001* | ||
| pg-gn | 14.0 | 1.8 | 73 | 15.7 | 2.1 | 91 | 5.37 | p3<0.001* | ||
| id-gn | 24.0 | 3.5 | 68 | 25.3 | 3.3 | 87 | 2.4 | 153 | p1<0.001* | |
| id-pg | 9.9 | 2.8 | 68 | 9.9 | 2.4 | 87 | 3.36 | p3= 0.920 | ||
| kdl-kdl | 117.7 | 5.2 | 29 | 119.7 | 6.3 | 49 | 4.66 | p3=0.110 | ||
| kr-kr | 95.3 | 6.0 | 51 | 97.9 | 9.9 | 64 | 3.81 | p3<0.001* | ||
| gn-go | 79.1 | 4.5 | 55 | 81.7 | 7.0 | 86 | 3.04 | p2=0.002* | ||
| pg-FMeB | 23.9 | 2.6 | 74 | 24.4 | 4.0 | 92 | 0.38 | p2=0.703 | ||
| CHM2 | 21.4 | 3.2 | 57 | 22.0 | 4.0 | 89 | 0.64 | p2=0.526 | ||
| MINMH | 18.2 | 4.5 | 57 | 19.9 | 5.1 | 91 | 1.06 | p2=0.289 | ||
| MAXMH | 22.3 | 5.5 | 57 | 24.4 | 5.9 | 91 | 1.04 | p2=0.263 | ||
| kdl-kr | 42.2 | 4.0 | 57 | 43.0 | 4.6 | 87 | 1.05 | p2=0.292 | ||
| MID | 12.1 | 1.4 | 55 | 12.5 | 1.9 | 84 | 2.37 | p2=0.018* | ||
| MA | 138.2 | 5.6 | 50 | 135.3 | 6.8 | 86 | 1.9 | p2=0.058 | ||
| MinMB | 11.1 | 1.4 | 75 | 12.0 | 1.5 | 94 | 1.28 | p2=0.202 | ||
| MaxMB | 14.6 | 1.6 | 75 | 15.4 | 1.6 | 94 | 2.38 | p2=0.017* | ||
| mb-ml | 56.7 | 3.8 | 73 | 59.0 | 4.0 | 88 | 1.55 | p2=0.120 | ||
| FMeB | 3.4 | 1.2 | 75 | 3.9 | 0.9 | 94 | 2.42 | p2=0.016* | ||
| FMaB | 2.7 | 0.6 | 74 | 3.5 | 1.7 | 92 | 0.05 | p2=0.960 | ||
| go-cm | 60.2 | 6.6 | 49 | 59.2 | 9.9 | 77 | 0.14 | p2=0.889 | ||
After controlling for sex, even more features were found to differ significantly. Sexual dimorphism for Sypniewo population was 7.0% and for Gródek upon the Bug River 7.5%. Descriptive statistics are presented in Tables 3 and 4 for Sypniewo and Gródek located along the Bug River respectively. Right and left side measurements were higher for males in both populations (except for FMaB in the Sypniewo sample) (Tab. 3 and 4). Comparisons of bilateral features has revealed significant differences in both sexes for few features, but only in the population from the Gródek upon the Bug River (Tab. 5). In contrast, in the Sypniewo sample, no significant differences between sides were observed.
| Features | Body side | FEMALES | MALES | Test Z** | Test C* | df | p | ||||||
| X̅ | SD | N | Ranges min-max | X̅ | SD | N | Ranges min-max | ||||||
| go-go | 94.1 | 7.4 | 22 | 85-114 | 98.2 | 6.3 | 16 | 90-107 | |||||
| pg-gn | 13.4 | 1.5 | 50 | 11-17 | 15.3 | 1.7 | 23 | 11-18 | 4.09 | <0.01 | |||
| id-gn | 23.1 | 2.9 | 46 | 16-29 | 26.1 | 3.9 | 22 | 19-34 | 3.53 | 66 | <0.01 | ||
| id-pg | 9.4 | 2.5 | 46 | 4-16 | 10.7 | 3.2 | 22 | 5-17 | |||||
| kdl-kdl | 115.2 | 3.8 | 18 | 110-125 | 121.9 | 4.7 | 11 | 112-129 | 3.12 | <0.01 | |||
| kr-kr | 94.1 | 5.6 | 35 | 82-105 | 97.9 | 6.3 | 16 | 85-106 | 2.14 | 49 | 0.037 | ||
| gn-go | right | 77.5 | 3.7 | 30 | 70-86 | 80.9 | 4.2 | 21 | 74-89 | 2.99 | 49 | <0.01 | |
| gn-go | left | 78.0 | 4.3 | 24 | 70-86 | 80.9 | 5.5 | 19 | 72-90 | 2.00 | 0.045 | ||
| pg-FMeB | right | 23.6 | 1.8 | 49 | 19-29 | 25.3 | 1.5 | 24 | 23-29 | 3.73 | <0.01 | ||
| pg-FMeB | left | 23.9 | 1.7 | 49 | 19-27 | 25.1 | 1.3 | 24 | 22-28 | 2.74 | 0.06 | ||
| CHM2 | right | 20.7 | 3.1 | 37 | 15-26 | 23.0 | 3.6 | 19 | 16-31 | 2.41 | 0.016 | ||
| CHM2 | left | 20.5 | 3.0 | 36 | 16-29 | 22.6 | 3.4 | 15 | 16-28 | ||||
| MinMH | right | 19.5 | 2.8 | 37 | 12-24 | 21.7 | 3.4 | 18 | 17-29 | 2.12 | 0.034 | ||
| MinMH | left | 19.1 | 2.1 | 36 | 15-24 | 21.8 | 2.6 | 12 | 17-25 | ||||
| MaxMH | right | 23.8 | 2.5 | 37 | 17-29 | 27.3 | 3.7 | 18 | 22-34 | 3.30 | <0.001 | ||
| MaxMH | left | 23.9 | 2.8 | 36 | 19-31 | 26.4 | 4.1 | 12 | 20-34 | <0.001 | |||
| kdl-kr | right | 41.2 | 3.3 | 29 | 35-48 | 43.2 | 4.7 | 16 | 36-50 | ||||
| kdl-kr | left | 41.7 | 3.7 | 28 | 34-49 | 43.5 | 4.4 | 14 | 37-50 | ||||
| MID | right | 12.0 | 1.4 | 26 | 10-15 | 12.8 | 1.5 | 15 | 10-15 | ||||
| MID | left | 11.9 | 1.2 | 27 | 10-14 | 12.4 | 1.8 | 14 | 9-15 | ||||
| MA | right | 138.0 | 5.2 | 23 | 129-147 | 138.6 | 6.5 | 18 | 130-152 | ||||
| MA | left | 138.2 | 5.0 | 18 | 130-147 | 138.4 | 6.9 | 14 | 128-153 | ||||
| Min MB | right | 10.8 | 1.4 | 49 | 8-14 | 11.9 | 1.4 | 25 | 10-14 | 2.71 | 0.007 | ||
| MinMB | left | 10.7 | 1.1 | 49 | 8-14 | 11.8 | 1.8 | 24 | 9-16 | <0.001 | |||
| MaxMB | right | 14.4 | 1.8 | 49 | 10-17 | 14.7 | 1.5 | 25 | 11-18 | 2.73 | 0.006 | ||
| MaxMB | left | 14.5 | 1.7 | 49 | 10-18 | 15.1 | 1.6 | 24 | 12-19 | 5.69 | 68 | 0.001 | |
| Mb-ml | right | 55.0 | 2.5 | 48 | 50-61 | 59.4 | 3.8 | 22 | 51-66 | 5.03 | 62 | <0.001 | |
| Mb-ml | left | 55.4 | 2.8 | 43 | 46-61 | 59.8 | 4.1 | 21 | 52-67 | <0.001 | |||
| FMeB | right | 3.4 | 1.3 | 50 | 1-6 | 3.6 | 1.4 | 24 | 2-7 | ||||
| FMeB | left | 3.3 | 1.3 | 49 | 1-7 | 3.2 | 1.3 | 25 | 1-21 | ||||
| FMaB | right | 2.7 | 0.6 | 48 | 2-4 | 2.9 | 0.9 | 23 | 2-5 | ||||
| FMaB | left | 2.8 | 0.5 | 45 | 2-4 | 2.7 | 0.8 | 21 | 1-4 | ||||
| go-cm | right | 59.0 | 3.6 | 22 | 52-67 | 64.7 | 4.4 | 17 | 59-73 | 4.52 | 37 | <0.001 | |
| go-cm | left | 57.8 | 3.8 | 18 | 50-65 | 64.1 | 4.8 | 14 | 58-73 | 4.18 | 30 | <0.001 | |
| Features | Body side | FEMALES | MALES | Test Z** | Test C* | df | p | ||||||
| X̅ | SD | N | Ranges min-max | X̅ | SD | N | Ranges min-max | ||||||
| go-go | 98.2 | 5.5 | 15 | 90-106 | 101.9 | 8.2 | 26 | 84-115 | |||||
| pg-gn | 15.1 | 1.8 | 33 | 11-18 | 16.1 | 2.2 | 58 | 11-22 | 2.29 | 89 | 0.024 | ||
| id-gn | 23.8 | 2.4 | 31 | 19-29 | 26.2 | 3.4 | 56 | 17-32 | 3.48 | 85 | 0.001 | ||
| id-pg | 8.8 | 2.3 | 31 | 5-14 | 10.5 | 2.3 | 56 | 5-17 | 3.10 | 0.002 | |||
| kdl-kdl | 116.3 | 4.3 | 21 | 106-126 | 122.3 | 6.5 | 28 | 106-133 | 3.66 | 47 | 0.001 | ||
| kr-kr | 94.7 | 13.3 | 26 | 34-108 | 100.1 | 6.0 | 38 | 85-111 | 2.15 | 0.032 | |||
| gn-go | right | 82.1 | 6.4 | 17 | 73-93 | 83.4 | 6.5 | 40 | 74-100 | 2.00 | 0.045 | ||
| gn-go | left | 79.8 | 6.0 | 28 | 73-99 | 82.5 | 5.8 | 40 | 71-96 | ||||
| pg-FMeB | right | 25.1 | 2.0 | 31 | 22-28 | 25.5 | 2.2 | 57 | 21-30 | ||||
| pg-FMeB | left | 25.3 | 1.9 | 32 | 21-29 | 25.6 | 2.2 | 57 | 23-31 | ||||
| CHM2 | right | 21.3 | 2.8 | 29 | 15-27 | 22.9 | 3.3 | 51 | 15-29 | 2.42 | 82 | 0.018 | |
| CHM2 | left | 21.5 | 2.4 | 32 | 16-26 | 23.1 | 3.2 | 52 | 17-30 | ||||
| MinMH | right | 20.9 | 2.3 | 28 | 17-27 | 22.6 | 3.3 | 52 | 12-31 | 2.46 | 78 | 0.016 | |
| MinMH | left | 21.6 | 2.1 | 31 | 18-26 | 22.1 | 3.0 | 54 | 12-27 | ||||
| MaxMH | right | 25.5 | 2.3 | 29 | 22-32 | 27.9 | 3.0 | 52 | 21-33 | 3.66 | <0.001 | ||
| MaxMH | left | 25.7 | 2.5 | 30 | 22-33 | 27.3 | 2.8 | 54 | 22-33 | 2.51 | 0.012 | ||
| kdl-kr | right | 40.9 | 3.7 | 27 | 32-47 | 44.2 | 3.8 | 46 | 36-52 | 3.43 | <0.001 | ||
| kdl-kr | left | 41.4 | 3.9 | 27 | 33-48 | 44.7 | 3.4 | 44 | 36-50 | 3.30 | <0.001 | ||
| MID | right | 12.0 | 1.4 | 24 | 10-15 | 12.8 | 2.2 | 45 | 9-18 | ||||
| MID | left | 11.7 | 1.6 | 28 | 9-15 | 13.3 | 2.2 | 38 | 9-20 | 3.02 | 0.003 | ||
| MA | right | 137.5 | 6.5 | 17 | 126-150 | 134.0 | 8.0 | 40 | 106-145 | ||||
| MA | left | 136.5 | 7.2 | 29 | 123-150 | 135.5 | 7.0 | 39 | 119-151 | ||||
| Min MB | right | 11.2 | 1.1 | 33 | 9-14 | 12.6 | 1.5 | 58 | 9-16 | 4.41 | 0.003 | ||
| MinMB | left | 11.2 | 1.3 | 32 | 9-14 | 12.4 | 1.6 | 59 | 9-16 | 3.26 | 0.001 | ||
| MaxMB | right | 14.7 | 1.2 | 33 | 12-17 | 15.6 | 1.8 | 58 | 12-20 | 2.09 | 0.036 | ||
| MaxMB | left | 15.1 | 1.2 | 32 | 13-17 | 15.9 | 1.7 | 59 | 12-21 | 2.57 | <0.010 | ||
| Mb-ml | right | 56.6 | 3.9 | 30 | 48-63 | 60.0 | 4.1 | 52 | 52-68 | 3.09 | <0.001 | ||
| Mb-ml | left | 57.6 | 4.1 | 30 | 50-66 | 60.2 | 4.3 | 50 | 47-69 | 2.68 | 78 | <0.001 | |
| FMeB | right | 3.7 | 0.8 | 32 | 2-6 | 4.0 | 1.0 | 59 | 2-6 | ||||
| FMeB | left | 3.7 | 1.0 | 33 | 2-6 | 3.8 | 1.0 | 58 | 2-6 | ||||
| FMaB | right | 3.1 | 0.9 | 31 | 2-5 | 4.0 | 3.9 | 52 | 2-31 | ||||
| FMaB | left | 3.0 | 0.8 | 30 | 2-5 | 3.6 | 0.9 | 50 | 2-6 | 2.43 | 0.015 | ||
| go-cm | right | 59.3 | 3.3 | 16 | 52-63 | 64.5 | 6.4 | 34 | 48-87 | 2.94 | <0.001 | ||
| go-cm | left | 59.8 | 4.4 | 25 | 50-66 | 63.9 | 4.7 | 34 | 54-74 | 3.36 | 57 | 0.001 | |
| Features | Right side X̅ | SD | N | Left side X̅ | N | Test t | Df | p | |
| MALES | |||||||||
| gn-go | 83.4 | 6.5 | 40 | 85.2 | 5.8 | 40 | 2.48 | 0.0131 | |
| MaxMH | 27.8 | 2.9 | 52 | 27.3 | 2.8 | 54 | 2.00 | 0.0461 | |
| MID | 12.8 | 2.2 | 45 | 13.3 | 2.2 | 38 | 2.63 | 29 | 0.0132 |
| FMeB | 4.0 | 1.0 | 59 | 3.8 | 1.0 | 58 | 1.97 | 87 | 0.0262 |
| FEMALES | |||||||||
| gn-go | 82.1 | 6.4 | 17 | 79.8 | 6.0 | 28 | 2.22 | 25 | 0.0261 |
| MinMH | 20.9 | 2.3 | 28 | 21.6 | 2.1 | 31 | 2.17 | 25 | 0.0402 |
| MA | 137.5 | 6.5 | 17 | 136.5 | 7.2 | 29 | 2.13 | 25 | 0.0301 |
| go-cm | 61.4 | 4.2 | 16 | 62.2 | 4.2 | 25 | 2.09 | 25 | 0.0371 |
When mandibular features were compared, a high correlation was also found between mandibular canal length (mb-ml) and mandibular foramen breath (FMaB) for males in population from Gródek upon the Bug River and Sypniewo. High correlation was also found between mandibular foramen breath (FMaB) and mental foramen breadth in males from the Sypniewo. A weak correlation was found between FMaB and FMeB for males from the Gródek upon the Bug River and for females from both populations for mental canal length and FMaB. No statistically significant correlation was found between mandibular canal length and FMeB in both populations (Tab. 6).
| Cecha | MALES | FEMALES | ||
| mb-ml | FMeB | mb-ml | FMeB | |
| GRÓDEK UPPON BUG RIVER | ||||
| mb-ml | __ | rs=0,01 | __ | rs=0,21 |
| FMaB | rs=0,57* | r=0,32* | rs=0,36* | r=0,23 |
| SYPNIEWO | ||||
| mb-ml | ___ | rs=0,21 | ___ | rs=-0,09 |
| FMaB | rs=0,50* | rs=0,55* | rs=0,37* | rs=0,24 |
For male individuals from the Grodek upon the Bug River population statistically significant weak or moderate correlation was observed between mb-ml measurement and: go-go, pg-gn, id-gn, gn-go, MinMB, MaxMB and MID and for FMaB with kdl-kr and MA as well. In addition, a high correlation (0.6) was observed between FMaB and go-go (Tab. 6). For females, statistically significant and moderate correlation was found between mb-ml and MAxMB as well as between mb-bl and pg-FMaB and between FMaB and go-gndl-kr, MinMB and go-cm. High correlation (0.5) was fount between FMaB and MA measurements (Tab. 7 and 8). For males from a population from Sypniewo average correlation was found between mb-bl and kdl-kr. High correlation was also found between mb-bl and MID. For females, mb-ml was moderately correlated with gn-go and CHM2 (Tab. 7 and 8).
| Feature | go-go | pg-gn | id-gn | id-pg | kdl-kdl | kr-kr | |
| GRODEK UPON BUG | MALES | ||||||
| mb-ml | rs=0.19* | rs=0.41* | rs=0.30* | r=0.02 | r=0.17 | r=0.07 | |
| FMaB | rs=0.06 | rs =-0.03 | rs =0.01 | rs =0.01 | rs =0.05 | rs =-0.11 | |
| FMeB | r=0.6* | r=0.11 | r=0.22 | rs =-0.01 | r=0.43 | rs =0.16 | |
| FEMALES | |||||||
| mb-ml | rs=0.23 | rs=-0.16 | rs=-0.26 | rs=0.04 | rs=-0.26 | rs=0.27 | |
| FMaB | r=0.08 | r=0.01 | r=-0.36 | r=-0.14 | r=0.35 | rs=0.29 | |
| FMeB | r=0.16 | r=0.27 | r=0.41 | rs=0.18 | r=0.45 | rs=0.24 | |
| SYPNIEWO | MALES | ||||||
| mb-ml | rs=0.08 | rs=-0.16 | rs=0.02 | rs=0.001 | rs=-0.24 | rs=-0.18 | |
| FMaB | r=0.39 | rs=-0.10 | r=-0.26 | r=-0.29 | r=0.36 | r=-0.04 | |
| FMeB | rs=0.3 | rs=-0.02 | rs=-0.25 | rs=-0.23 | rs=0.33 | rs=0.38 | |
| FEMALES | |||||||
| mb-ml | rs=0.31 | rs=0.19 | rs=-0.13 | rs=-0.11 | rs=-0.03 | rs=0.07 | |
| FMaB | rs=-0.12 | rs=0.11 | rs=-0.22 | rs=-0.20 | rs=-0.28 | rs=0.09 | |
| FMeB | rs=-0.04 | rs=0.02 | r=-0.08 | r=-0.17 | rs=0.30 | rs=0.20 | |
| Feature | gn-go | pg-FMaB | CHM2 | MinCH | MaxCH | kdl-kr | MID | MA | MinMB | MaxMB | go-cm | |
| GRODEK UPON BUG | MALES | |||||||||||
| mb-ml | rs=0.37* | rs =0.21 | rs =0.02 | rs =0.03 | rs =0.11 | rs =0.58* | rs =0.37* | rs =0.18 | rs =0.48* | rs =0.48* | rs =0.23 | |
| FMaB | rs =0.27 | rs =-0.01 | rs =0.01 | rs =-0.02 | rs =0.03 | rs =0.47* | rs =0.22 | rs =0.28* | rs =0.16 | rs =0.21 | rs =0.23 | |
| FMeB | rs =0.17 | rs =0.18 | rs =-0.01 | rs =0.17 | rs =0.22 | rs =-0.03 | rs =0.33 | rs =0.23 | rs =-0.07 | rs =-0.001 | rs =0.07 | |
| FEMALES | ||||||||||||
| mb-ml | rs=-0.14 | rs=0.45* | rs=0.24 | rs=0.22 | rs=0.25 | rs=0.18 | rs=0.10 | rs=-0.01 | rs=0.28 | rs=0.36* | rs=-0.01 | |
| FMaB | rs=0.35* | rs=0.34 | rs=0.12 | rs=0.31 | rs=0.32 | rs=0.36* | rs=0.33 | rs=0.50* | rs=0.45* | rs=0.12 | rs=0.47* | |
| FMeB | rs=0.06 | rs=0.28 | rs=0.21 | rs=0.20 | rs=0.30 | rs=0.10 | rs=0.18 | rs=0.06 | rs=0.18 | rs=0.04 | rs=0.10 | |
| SYPNIEWO | MALES | |||||||||||
| mb-ml | rs=0.24 | rs=-0.21 | rs=0.32 | rs=0.17 | rs=0.08 | rs=0.46* | rs=0.53* | rs=0.24 | rs=0.21 | rs=0.25 | rs=0.35 | |
| FMaB | rs=0.33 | r=-0.45 | r=0.13 | r=-0.20 | r=-0.20 | rs=0.17 | r=0.02 | rs=0.48* | r=-0.46 | rs=-0.15 | rs=0.22 | |
| FMeB | rs=0.01 | rs=-0.25 | rs=-0.26 | rs=-0.32 | rs=-0.33 | rs=-0.17 | rs=0.13 | rs=0.004 | rs=0.10 | rs=-0.02 | rs=-0.12 | |
| FEMALES | ||||||||||||
| mb-ml | rs=0.41* | rs=-0.02 | rs=0.34* | rs=0.21 | rs=0.16 | rs=0.24 | rs=0.06 | rs=0.11 | rs=0.15 | rs=0.11 | rs=0.35 | |
| FMaB | rs=0.22 | rs=-0.26 | rs=0.28 | rs=0.15 | rs=0.17 | rs=0.13 | rs=-0.004 | rs=-0.11 | rs=-0.07 | rs=0.16 | rs=0.16 | |
| FMeB | rs=-0.13 | rs=-0.14 | rs=-0.07 | rs=-0.15 | rs=-0.10 | rs=-0.10 | rs=0.04 | rs=-0.45* | rs=-0.13 | rs=0.08 | rs=-0.27 | |
Occurrence of the mental foramen is relatively constant, however, the location is variable. Thus, each individual may exhibit a different arrangement of the neurovascular bundle exit. The position and the direction of the exit of the neurovascular bundle were similar to other European populations (Tab. 9, 10). However, differences in localization between the two investigated populations were observed. Thus, it could suggest that not only genetic but also environmental (geographical) factors, such as living conditions (e.g., diet, which may affect developmental stability), may influence the morphology of the mandibular features.
The literature review revealed a broad variety of features characterized by the human mandible (Tab. 9) which may result from both different environmental conditions (e.g., different food accessibility) as well as nutrition culture. In poorer populations, for instance, a scarcity of food may result in the incorrect realization of the bone growth path. Moreover, nutrition culture, such as consistency and type of food, may result in differences in chewing intensity and, therefore, different sizes of the mandible (Raadsheer et al. 1999; Golusik et al. 2005). A secular trend observed in populations from different time ranges is also an important factor influencing the mandible’s features.
| Author, year of publication | N | Population, time ranges | Sex | Features (mean± SD) | |||||
| go-go | id-gn | gn-go | kdl-kdl | MA | go-cm | ||||
| This study, 2020 | 50 25 |
Poland (Sypniewo), XI-XIIth | Female Male |
94.1±7.4 98.2±6.3 |
23.1±2.9 26.1±3.9 |
77.6±3.8 81.2±4.7 |
115.2±3.8 121.9±4.7 |
138.2±5.3 138.5±6.1 |
58.2±3.7 64.6±4.3 |
| 75 | TOTAL | 95.8±7.1 | 24.0±3.5 | 79.1V4.5 | 117.7±5.2 | ||||
| This study, 2020 | 34 60 |
Poland (Gródek upon Bug), XIII-XVIth | Female Male |
98.2±5.5 101.9±8.2 |
23.8±2.4 26.2±3.4 |
80.7±6.4 82.2±7.4 |
116.3±4.3 122.3±6.5 |
136.2±6.8 134.8±6.8 |
59.6±4.0 64.6±6.0 |
| 94 | TOTAL | 100.5±7.4 | 25.3±3.3 | 81.7±7.0 | 119.7±6.3 | ||||
| Mays, 2014 | 15 17 |
Nederland, XIXth | Female Male |
91.1±7.5 99.9±6.8 |
69.7±.3.3 76.3±7.6 |
113.1±6.3 116.9±6.9 |
134.0±8.3 126.9±8.7 |
||
| 15 17 |
England, X-XIXth | Female Male |
96.2±7.1 105.1±7.1 |
70.5±6.1 76.2±4.7 |
116.7±7.7 124.2±5.7 |
126.4±6.4 122.6±9.0 |
|||
| Purmal et al., 2013 | 46 44 |
Malaisia, XXth | Female Male |
103.9±5.4 106.7±7.8 |
|||||
| 34 | TOTAL | 105.2±6.7 | |||||||
| China, XXth | Female Male |
105.3±6.5 108.2±7.5 |
|||||||
| 30 | TOTAL | 106.7±7.1 | |||||||
| India, XXth | Female Male |
98.7±8.4 111.1±10.0 |
|||||||
| 26 | TOTAL | 104.9±11.0 | |||||||
| Simalcsik et al., 2012 | 299 259 |
Romania,XVI-XVIIIth | Female Male |
94.1±7.3 104.8±9.0 |
28.6±3.0 32.4±3.0 |
66.1±5.1 69.1±4.8 |
112.8±7.2 123.9±8.4 |
60.2±4.8 64.9±5.0 |
|
| Ongkana et al., 2009 | 102 | Thailand, XXth | Female Male |
28.2±6.5 28.3±6.1 |
79.2±4.6 83.2±5.2 |
116.1±5.9 123.8±6.3 |
62.6±5.6 68.1±4.4 |
||
| Golusik et al. 2005 | 16 69 |
Poland (Złota), II-IIIth BC | Female Male |
94.1±4.6 99.9±8.4 |
30.4±5.0 34.1±3.1 |
80.0±3.8 84.6±4.5 |
113.9±5.6 118.2±6.9 |
||
| 85 | TOTAL | 97.00 | 32.0 | 82.5 | 116.0 | ||||
| 24 22 |
Poland (Milicz), XII-XIIIth | Female Male |
93.4±4.9 100.3±7.5 |
30.9±2.2 31.8±3.3 |
83.4±5.1 86.1±7.0 |
112.8±8.3 118.5±7.7 |
|||
| 47 | TOTAL | 97.0 | 31.5 | 84.5 | 115.5 | ||||
| 104 160 |
Poland (Gródek upon Bug), XIII-XVIIth | Female Male |
94.6±6.4 101.5±7.3 |
27.0±2.7 30.3±3.0 |
77.0±4.8 81.2±4.8 |
116.2±6.0 121.7±7.1 |
|||
| 264 | TOTAL | 98.0 | 28.5 | 79.0 | 119.0 | ||||
| 28 70 |
Poland (Warsaw), XXth | Female Male |
94.6±6.6 98.0±7.7 |
27.5±3.2 30.3±3.4 |
77.0±4.3 83.0±5.0 |
110.1±6.6 116.3±6.1 |
|||
| 98 | TOTAL | 96.5 | 29.0 | 80.0 | 114.0 | ||||
| Fabian and Mpembeni, 2002 | 25 25 |
Tanzania Bantu, ?? | Female Male |
77.0±3.9 80.6±3.8 |
|||||
| Puisorua et al., 2006 | 91 | Europe, Near East, Asia, Africa, ?? | Female Male |
91.0±3.61 114.1±38.91 |
|||||
| Female Male |
89.0±1.82110.0±3.62 | ||||||||
| Female Male |
95.0±1.673119.0±29.93 | ||||||||
| Zimbabwe, ?? | Female Male |
91.0±3.6 114.0±38.9 |
128.0 123.0 |
||||||
| Nigeria, ?? | Female Male |
||||||||
| TOTAL | 118.8 | ||||||||
| Turkey, ?? | Female Male |
||||||||
| TOTAL | 120.2 | ||||||||
| USA, ?? | Female Male |
126.5 127.8 |
|||||||
| Spain, ?? | Female Male |
||||||||
| TOTAL | 118.1 | ||||||||
| China, ?? | Female Male |
||||||||
| TOTAL | 121.2 | ||||||||
| Romania, ?? | Female Male |
125.0±1.2 119.0±1.1 |
|||||||
In this study, differences between sexes were found in both analyzed populations. However, for the population from Sypniewo (which is considered as rural population), we found fewer features that exhibited significant sex differences. When the sex of the individuals was controlled for the population from Gródek upon the Bug River, sexual dimorphism was observed in even more features and was slightly higher (7.5%) (Tab. 3 and 4). When sexual dimorphism was lower, living conditions, and thus, socioeconomic status of the population, are considered worse. Sexual dimorphism of the human body is well established. It may be the result of the environmental factors and lifestyle; sexual dimorphism may also be the result of genetic factors (Galdames et al. 2008; Mays 2014). Moreover, disorders of the endocrine system may also result in sex differences in the morphology of the human mandible (Piontek 1999) and greater masticatory forces may result in sexual dimorphism of the mandible. In general, there is less sexual dimorphism in body size in populations with poorer socio-economic status and living in unfavorable environmental conditions (Wells 2012; Tomaszewska et al. 2015). This conclusion may be also related to diet and eating habits. Our results support previous studies, which contend that worse environmental conditions may influence cranial morphology and, ultimately, disrupt an individual’s skeletal development (Gilligan and Bulbeck 2007; Harvati and Weaver 2006; Pearson 2000; Perez et al. 2007; Wells 2012).
| Author, year of publication | N | Population, time ranges | Body side | Feature | ||||
| go-cm | MA | FMeB | FMaB | Mb-ml | ||||
| This study, 2020 | 75 | Poland (Sypniewo), XI-XIIth | Right Left |
61.5±4.9 60.6±5.2 |
138.3±5.7 138.3±5.8 |
3.5±1.3 3.3±1.3 |
2.7±0.7 2.6±0.8 |
56.4±3.6 56.8±3.9 |
| This study, 2020 | 94 | Poland (Gródek upon Bug), XIII-XVIth | Right Left |
62.8±6.1 62.1±5.0 |
135.0±7.7 135.9±7.1 |
3.9±0.9 3.8±1.0 |
3.7±3.1 3.4±0.9 |
58.8±4.3 59.2±4.4 |
| Shenoy et al., 2012 | 50 | India, ?? | Right Left |
124.4±6.0 124.1±6.2 |
||||
| Ennes and Monteiro de Medeiros, 2009 | 99 | Brazil, ?? | Right Left |
131.8±8.51 131.2±8.21 |
||||
| Right Left |
125.6±7.82 125.7±9.22 |
|||||||
| Right Left |
126.5±7.83 125.7±9.23 |
|||||||
| Prośba-Mackiewicz et al., 2005 | 40 | Poland, ?? | Right Left |
64.0±4.84 63.5±4.84 |
||||
| Oguz and Bozkir, 20027 | 34 | Turkey, ?? | Right Left |
65.6±5.0 64.6±4.2 |
120.2±4.7 120.2±3.6 |
|||
| Rai et al., 2014 | 40 | India, ?? | Right Left |
2.6±0.9 2.6±0.9 |
||||
| Hoque et al., 2013 | 185 | Bangladesh, ?? | Right Left |
2.6±0.7 2.5±0.5 |
||||
| Agarwal and Gupta, 2011 | 100 | India, ?? | Right Left |
3.3 3.3 |
||||
| Junior et al., 2010 | 50 | Brasil, XXth | Right Left |
52.8 51.6 |
||||
| Singh and Srivastar, 2010 | 100 | Turkey, ?? | Right Left |
2.8 2.6 |
||||
| Ilayperuma et al., 2009 | 51 | Sri Lanka, ?? | Right Left |
3.3±0.9 3.4±0.8 |
||||
| Oliveira Junior et al., 2009 | 80 | Brasil, ?? | Right Left |
2.4±0.6 2.4±0.6 |
||||
| Wychowański et al., 2008. | 100 | contemporary | Right Left |
3.7±1.0 3.8±1.0 |
3.2±0.6 3.4±0.6 |
|||
| Right Left |
3.3±0.7 3.8±1.1 |
3.5±0.5 3.3±0.4 |
||||||
| Igbigbi and Lebona, 2005 | 70 | Malawi- ?? |
Right Left |
2.4±0.2 2.7±0.2 |
||||
| Prośba-Mackiewicz et al., 2005 | 40 | ?? | Right Left |
2.7±1.01 2.8±1.01 |
3.9±0.91 4.0±0.91 |
|||
| Right Left |
2.9±1.14 2.8±1.04 |
4.1±1.82 4.2±1.72 |
||||||
| Goudot, 2002 | 1 | France* - paleolith | Right Left |
4.5 4.5 |
||||
| Goudot, 1999 | 1 | France*- 60000- 45000 | Right Left |
6.0 6.0 |
5.0 5.0 |
|||
| Phillips et al., 1992 | 75 | ?? | Right+ Left | 2.9 | ||||
Foraminal area of the mandible is considered as an important region relevant to anatomy, surgery, anthropology and forensic medicine. The position of the mental and mandibular foramina has been reported to vary in populations from different geographical regions. Currently, to our knowledge, there have not been any investigations concerning the position and morphology of these foramina in populations with divergent socio-economic statuses (SES). The SES may influence lifestyle and some behavioral habits regarding food consumption, consumed food type as well as breastfeeding. Developmental stability may also influence dental eruption, and this may possibly influence the position of the mental foramen. Positional change of mental foramen is a combination of osseous growth in the region combined with a mesial drift of the dental anlage. Williams and Krovitz (2004) stated that the mental foramen migrates posteriorly during ontogeny and found that the mental foramen forms prenatally under the anticipated anterior root of the developing first deciduous molar. Williams and Krovitz (2004) also asserted that this position is maintained at birth and remains mostly stable during the deciduous eruption. During the eruption of the second molar, the mental foramen generally migrates to a position inferior to the second premolar (Hasan 2012; Narayana and Prashanthi 2003).
Possible limitations of this study may result from the anatomical variation in the mandibular area especially given that we did not analyze additional/ accessory mandibular and mental foramina in order to show only variation in mental/mandibular foramina and mandibular canal. If a large accessory mental foramen exists, that could make a regular mental foramen smaller than the foramen on contralateral side (if the contralateral side does not have the accessory mental foramen) (Iwanga et al. 2016). We are also aware that in cone- beam computed tomography different aspects of mandibular canal may occur (i.e. bifid or trifid mandibular canal (Naitoh et al. 2007). Bifid mandibular canal exhibits a variety of incidence, ranging from 0,08 to 65% (Mizbah et al. 2012; Miličević et al. 2021), which may not be seen in panoramic or periapical films (Dario 2002). Its occurrence depends on the assessment method (cone-beam computed tomography or panoramic radiographs) but for anthropological and archaeological field works purposes only macroscopic assessment is useable. Hence, this research is based on macroscopic observations and dedicated for field works/ excavations macroscopic examinations, where sophisticated methods are not possible to conduct. As such, this study aimed to facilitate conclusions based on macroscopic observations although for clinical studies this method could not be sufficient. Nevertheless, the results of our study should be considered when sudden and unplanned interventions in this region are conducted.
The results derived from different studies (please see Tab. 9 and 10 for details) may be flawed due to the application of different methods (Hasan 2012). In addition, the observed differences between right and left sides of the mandible may result from chewing habits (unilateral) (Sójka, Hędzelek 2011). Literature reviews revealed that although studies on the morphology and morphometry of mental and mandible foramina are common, research specifically focused on the distances between these foramina and morphology of the mandible canal are rather rare (Tab. 10). In this study we argue that such (methodological) differences should be considered when approaching to the mandibular canal during anesthetic, surgical and forensic procedures.
Conflict of interests
The authors declared no conflicts of interests
Authors’ contribution
JR collected the data and performed statistical computations.
DP was project supervisor, co- edited the final version of the manuscript.
AT conceived the paper, performed statistical computations, drafted the manuscript and co- edited the final version of the manuscript.
All authors carefully read and accepted the final version of the manuscript.
Financial support: This work was supported by the Wrocław University of Environmental and Life Sciences (Poland) as the Ph.D. research program “Innowacyjny Naukowiec”, no. N060/0005/21.
Agarwal DR, Gupta SB. 2011. Morphometric Analysis of Mental Foramen in Human Mandibles of South Gujarat. People’s Journal of Scientific Research 4(1):15–18.
Belniak T, Krupiński T, Magnuszewicz M, Rauhut J, Szczotkowa Z. 1961. Cmentarzysko w Gródku nad Bugiem (XIII–XVII w.). Mat. Pr. Antrop. 50.
Bierman F. 2006. Sypniewo. Ein fruhmittelalterlicher Burg-Siedlungskomplex in Nordmasowien. Befunde, funde und kulturhistorische bewertung, teil 1. Archeologia Mazowsza i Podlasia. Studia i materiały. T. 4. Red. serii: W. Szymański. Instytut Archeologii i Etnologii PAN, Warszawa.
Cutright B, Quillopa N, Schubert W. 2003. An anthropometric analysis of the key foramina for maxillofacial surgery. Journal of Oral and Maxillofacial Surgery 61(3):354–357.
Dario LJ. 2002. Implant placement above a bifurcated man-dibular canal: A case report. Implant. Dent. 11:258–261.
Drake RL, Vogl AW, Mitchell AWM. 2010. Gray’s Anatomy for Students. Churchill Livingstone 1142–1144.
Ennes JP, Monteiro de Medeiros R. 2009. Localization of Mandibular Foramen and Clinical Implications. Int. J. Morphol. 27(4):1305–1311.
Fabian FM, Mpembeni R. 2002. Sexual dimorphism in the mandibles of homogenius black population of Tanzania. Tanzania Journal of Science. 28(2):47–54.
Field A. 2006. Discovering statistics using SPSS. 3rd edition, Sage Publications Ltd., London.
Galdames ICS, Matamala DAZ, Smith RL. 2008. Evaluating Accuracy and Precision in Morphologic Traits for Sexual Dimorphism in Malnutrition Human Skull: a Comparative Study. Int. J. Morphol. 26(4): 877–881.
Gilligan I, Bulbeck D. 2007. Environment and morphology in Australian Aborigines: a re – analysis of the Birdsell database. Am. J. Phys. Anthropol. 134:75–91.
Golusik K, Sarul M, Rzeszut Ł, Matthews-Brzozowska T. 2005. Żuchwa ludzka w procesie ewolucji. Dent. Med. Probl. 42(1):103–109.
Goudot P. 1999. The mandibular canal of a Neanderthal: the La Chapelle-aux-Saints man anatomical-radiological study. J. Craniomaxillofac Surg. 27:134–139.
Goudot P. 2002. The mandibular canal of the “Old Man” of Cro-Magnon: anatomical-radiological study. J. Craniomaxillofac Surg. 30:213–218.
Gray H. 1985. Anatomy of the Human Body. Philadelphia : Lea & Febiger, United States 106–109.
Green RM. 1987. The position of the mental foramen: a comparison between the southern (Hong Kong) Chinese and other ethnic and racial groups. Oral. Surg. Oral Med. Oral Pathol. 63:281–290.
Harvati K, Weaver TD. 2006. Human cranial anatomy and the differential preservation of population history and climate signatures. Anat. Rec., Part A Discov. Mol. Cell. Evol. Biol. 288 A (12):1225–1233.
Hasan T. 2012. Mental Foramen Morphology: a must know in clinical dentistry. Journal of the Pakistan Dental Association 21(3):168–173.
Hoque M, Ara S, Begum S, Kamal M, Momen M. 2013. Study of Number, Shape, Size and Position of Mental Foramen in Bangladeshi Dry Adult Human Mandible. Bangladesh Journal of Anatomy 11(1):7–10.
Igbigbi PS, Lebona S. 2005. The position and dimensions of the mental foramen in adult Malawian mandibles. WAJM 24(3):184–189.
Ilayperuma I, Nanayakkara G, Palahepitiya N. 2009. Morphometric Analysis of the Mental Foramen in Adult Sri Lankan Mandibles. International Journal of Morphology 27(4):1019–1024.
Iwanaga J, Watanabe K, Saga T, Tabira Y, Kitashima S, Kusukawa J, Yamaki K. 2016. Accessory mental foramina and nerves: Application to periodontal, periapical, and implant surgery. Clinical Anatomy 29(4):493–501. https://doi.org/10.1002/ca.22635
Jacobs R, Mraiwa N, Van Steenberghe D, Sanderink G, Quirynen M. 2004. Appearance of the mandibular incisivecanal on panoramic radiographs. Surg Radiol Anat 26:329–333.
Junior ROM, Santos Saud AD, Rodrigues Fonseca D, De-Ary-Pires B, Ary Pires-Neto M, De Ary-Pires R. 2010. Morphometrical analysis of the human mandibular canal: a CT investigation. Surgical and Radiologic Anatomy 33:345–352.
Łasiński W. 1993. Anatomia głowy dla stomatologów. Państwowy Zakład Wydawnictw Lekarskich, Warszawa 26–30.
Martin R, Saller F, Knussman R. 1988. Antropologie In: Handbuch der vergleichenden Biologie des Menschen, Gustav Fischer Verlag, Stuttgart, New York.
Mays S. 2014. Mandibular morphology in two archaeologicalhuman skeletal samples from northwest Europewith different masticatory regimes. HOMO – Journal of Comparative Human Biology 25378:1–13.
Miličević A, Salarić I, Đanić P, Miličević H, Macan K, Orihovac Ž, Zajc I, Brajdić D, Macan D. 2021. Anatomical Variations of the Bifid Mandibular Canal on Panoramic Radiographs in Citizens from Zagreb, Croatia. Acta Stomatologica Croatica 55(3):248–255. https://doi.org/10.15644/asc55/3/2
Mizbah K, Gerlach N, Maal TJ, Bergé SJ, Meijer GJ. 2012. The clinical relevance of bifid and trifid mandibular canals. Oral Maxillofacial Surgery 16(1):147–151. https://doi.org/10.1007/s10006-011-0278-5
Moiseiwitsch JRD, Hill C. 1998. Position of the mental foramen in a North American, white population. Oral Surgery, Oral Medicine, Oral Pathology, Oral Radiology 1, 85:457–460.
Naitoh M, Hiraiwa Y, Aimiya H, Ariji E. 2009. Observation of bifid mandibular canal using cone-beam computerized tomography. International J Journal of Oral and Maxillofacial Implants 24:155–159.
Narayana K, Prashanthi N. 2003. Incidence of large accessory mandibular foramen in human mandibles. European Journal of Anatomy 7(3):139–141.
Oguz O, Bozkir MG. 2002. Evaluation of Location of Mandibular and Mental Foramina in Dry, Young, Adult Human. West Indian Medical Journal 51(1):14–16.
Oliveira Junior EM, Araújo ALD, Da Silva CMF, Sousa-Rodrigues CF, Lima FJC. 2009. Morphological and Morphometric Study of the Mental Foramen on the M-CP-18 Jiachenjiang Point. International Journal of Morphology 27(1):231–238, https://doi.org/10.4067/S0717-95022009000100039
Ongkana N, Sudwan P. 2009. Gender difference in Thai mandibles using metric analysis. Chiang Mai,Medical Journal 48(2):43–48.
Pearson OM. 2000. Activity, climate, and postcranial robusticity: implications for modern human origins and scenarios of adaptive change. Current Anthropology 41(4):569–607.
Perez SI, Bernal V, Gonzalez PN. 2007. Morphological differentiation of aboriginal human populations from Tierra del Fuego (Patagonia): implications for South American peopling. American Journal of Physical Anthropology 133:1067–1079.
Phillips JL,Weller RN, Kulild JC. 1992. The Mental Foramen: Part III. Size and Position on Panoramic Radiographs. Journal of Endodontics 18(8):383–386.
Piontek J. 1999. Biologia populacji pradziejowych. Wydawnictwo Naukowe Uniwersytetu im. Adama Mickiewicza w Poznaniu, Poznań.
Prośba-Mackiewicz M, Mackiewicz J, Grzybiak M, Hreczecha J, Skwarek M. 2005. Zastosowanie badań morfometrycznych do oceny ważnych klinicznie parametrów morfologicznych żuchwy. Czasopismo Stomatologiczne LVIII, 2:116–123.
Puisorua M, Fornab N, Fatub AM, Fatub R, Fatua C. 2006. Analysis of mandibular variability in humans of different geographic areas. Annals of Anatomy 188:547–554.
Purmal K, Alam MK, Moganadass D, Zakariat NN, Cheong NW. 2013. The application and correlation of Pont’s Index to the facial framework of three main ethnic groups in Malaysia. Australian Orthodontic Journal Volume 29(1): 34–42.
Raadsheer MC, Van Eijdet TMGJ, Van Ginkel FC, Prahl-Andersen B. 1999. Contribution of jaw muscle size and craniofacial morphology to human bite force magnitude. Journal of Dental Research 78:31–42.
Rai R, Shrestha S, Jha S. 2014. Mental foramen: a morphological and morphometrical study. International Journal of Healthcare and Biomedical Research 2(4):144–150.
Renton T, Adey-Viscuso D, Meechan J. et al. 2010. Trigeminal nerve injuries in relation to the local anaesthesia in mandibular injections. British Dental Journal 209, E15 https://doi.org/10.1038/sj.bdj.2010.978
Samanta PP, Kharb P. 2013. Morphometric analysis of mandibular foramen and incidence of accessory mandibular foramina in adult human mandibles of an Indian Population. Revista Argentina de Anatomia 5(2):60–66.
Sekutowski M. 2002. Wybrane cechy niemetryczne kości kończyny dolnej a przypuszczalny tryb życia średniowiecznych populacji z Sypniewa i Wrocławia (praca magisterska obroniona w Katedra Antropologii. Wrocław: Uniwersytet Wrocławski).
Shenoy V, Vijayalakshmi S, Saraswathi P. 2012. Osteometric Analysis of the Mandibular Foramen in Dry Human Mandibles. Journal of Clinical and Diagnostic Research 6(4):557–560.
Simalcsik A, Groza VM, Simalcsik RD, Miu G. 2012. The Medieval Nectropolis (16th–18th centuries) of ‘Sfantul Nicolae-Ciurchi’ Church from Iasi city (Romania): Anthropologic data. Biologie animală LVIII:183–194.
Singh R, Srivastav AK. 2011. Evaluation of position, shape, size and incidence of mental foramen and accessory mental foramen in Indian adult human skulls. Int. J. Experim. Clinical Anat. 5:23–29.
Sójka A, Hędzelek W, 2011. Ocena różnych rodzajów asymetrii w narządzie żucia na podstawie badania klinicznego i instrumentalnego. Protet. Stomatol. LXI(1):28–36.
Sonick M, Abrahams J, Faiella R. 1994. A comparison of the accuracy of periapical, panoramic, and computerized tomographic radiographs in locating the mandibular canal. Int. J. Oral. Maxillofac. Implants. 9:455–460.
Stanisz A. 1998. Przystępny kurs statystyki w oparciu o program STATISTICA PL na przykładach z medycyny. Kraków: StatSoft Polska.
Tomaszewska A, Kwiatkowska B, Jankauskas R. 2015. Is the area of the orbital opening in humans related to climate? Am. J. Hum. Biol. 27(6):845–850. https://doi.org/10.1002/ajhb.22735. Epub 2015 May 7.
Valente VB, Arita WM, Gonçalves PCG, Campos JADB, de Oliveira Capot TS. 2012. Location of the Mandibular Foramen According to the Amount of Dental Alveoli. Int. J. Morphol. 30(1):77–81.
Wells JCK. 2012. Sexual dimorphism in body composition across human populations: associations with climate and proxies for short – and long – term energy supply. Am. J. Hum. Biol. 24(4):411–419.
Wiliams FL, Krovitz GE. 2004. Ontogenetic migration of the mental foramen in Neandertals and modern humans. J. Hum. Evol. 47(4):199–219.
Workshop of European Anthropologists. 1980. Recommendations for sex and age diagnoses of skeletons. J. Hum. Evol. 9:517–549.
Wychowański P, Nieckula P, Panek M, Kalinowski E, Borkowska U, Wojtowicz A. 2008. Próba oceny położenia otworu żuchwowego i bródkowego na podstawie analizy cyfrowych zdjęć pantomograficznych. Dent Med. Probl. 45(1):21–28.
Yosue T, Brooks SL. 1989. The appearance of mental foramina on panoramic and periapical radiographs. II. Experimental evaluation. Oral Surg Oral Med Oral Pathol. 68(4):488–492. https://doi.org/10.1016/0030-4220(89)90151-5


Received: 2021-09-23. Revised: 2022-05-11. Accepted: 2022-05-18