Available online at: https://doi.org/10.18778/1898-6773.85.3.04
Nicolaus Copernicus University in Toruń, Faculty of Biological and Veterinary Sciences, ORCID: 0000-0002-1562-8090
Polish Academy of Sciences, Institute of Geography and Spatial Organization Polish Academy of Sciences, Department of Environmental Resources and Geohazard Toruń, Poland,
ORCID: 0000-0002-9285-6273
Gdańsk University of Technology, Faculty of Applied Physics and Mathematics, Department of Probability and Biomathematics, Gdańsk, Poland, ORCID: 0000-0002-5596-366X
Włocławek Society of Arts and Sciences, Włocławek, Poland, Polish Historical Assosiation, Włocławek Branch, Włocławek, Poland, ORCID: 0000-0003-1828-2125
ABSTRACT: Mortality crises are periods of unusually high mortality resulted from a combination of epidemic episodes, climatic phenomena, historical events and sociopolitical factors. The most pronounced setback in the methodology applied to analyse mortality rates of historical populations is the inability to establish their size.
Reference publications do not provide unambiguous measures of the intensity and scale of mortality crisis periods. This problem was approached with the use of the Standardised Demographic Dynamics Rate (SDDR) whose value provides information about the condition of a population, disregarding the size of the group. Demographic crises were indicated and identified among the population living in the 19th century in central Poland in the rural parish. The analysis was based on data obtained from parish registers, made use of the measure expressing the ratio of the number of births to the number of deaths, without using the size of the group.
Results obtained from the analysis of data were set against the information about events causing a sudden growth in mortality derived from the widely-accessible literature. Value of the Standardised Demographic Dynamics Rate (SDDR) provides information aboutthe condition of a population, disregarding the size of the group. Nevertheless, only by combining the statistically obtained data with the information derived from written records it is possible to attempt to answer the question of the possible root cause of a demographic crisis.
KEY WORDS: epidemics, mortality crises, Standardised Demographic Dynamics Ratio (SDDR), Box-Cox transformation, historical demography
The analysis of the 16th–19th century mortality rates reveals the occurrence of repeated periods of sudden and dramatic increases in the number of deaths. Such violent short-run disturbances in the mortality pattern, referred to as mortality crises, their causes and effects on local communities, have been in the centre of attention ever since the interest in the possibility of research into record books appeared (Hinde 2010; Nelson 1991; Humphreys 1987; Landers 2006; Goubert 1960; 1968).
One of the definitions of the phenomenon states that „mortality crises are unusually high mortalities arising from a common, unusual, causal factor operating for a limited time across a given geographical area” (Bouckaert 1989). The death curve rockets and increased mortality lingers for a period of at least several months (Kuklo 2009). Researchers, however, tend to be in disagreement as to the choice of objective methods providing unambiguous identification of crisis periods and their intensity. The most pronounced setback in the methodology applied to analyse mortality rates of historical populations is the inability to establish their size, which stems from the very character of the analysed sources (parish registers, registers and statistics of deaths). Reference publications do not provide unambiguous measures of the intensity and scale of mortality crisis periods that would allow space-time comparison and the description of variation of the observed phenomena (Sawchuk et al. 2013; Kuklo 2009; Goubert 1968).
Consequently, both historians and demographers tend to apply the number of deaths, or less frequently – the number of conceptions, as the measure of demographic crises.
By general agreement, though, researchers point at the necessity to apply a variety of criteria of identification of crises themselves, as well as their intensity, depending on the population size and socio-economic discrepancies within its structure (e.g. urban-rural) (Turner 1973; Lebrun 1977; Hinde 2010; Sawchuk et al. 2013; Bouckaert 1989). Provided that the size of the population and length of the crises are known, crisis intensity index suggested by T. Hollingsworth (Hollingsworth 1979; Hinde 2010) can be applied. The important upside of this method is the possibility to determine the crisis intensity on the basis of the size of the deceased fraction of the population. There are, however, those who assume that during a crisis the number of deaths has increased by 1.5 up to 3 times in comparison to the monthly or yearly moving average for the period directly preceding the crisis. The moving average is calculated for the period of 9 to 25 years, sometimes discarding up to 4 extreme values. The calculation of the moving average may, at times, include periods preceding and following the alleged crisis year (Appleby 1978; Edvinsson 2015; Schofield 1972; Hoch 1998; Kuklo 2009; Hinde 2010; Turner 1973; Humphreys 1987; Lebrun 1977).
The main aim of our research was to indicate and identify demographic crises and/or revivals occurring in the 19th century among the catholic rural population in North-Eastern Poland and to suggest a classification allowing the assessment of the magnitude of those events.
The identification of crises was performed with investigating their underlining causes such as epidemics, wars or others. The identification and the evaluation of intensity was carried out according to Jaques Dupȃquier (Dupâquier 1979), Pierre Goubert (Goubert 1968) and with the use of the Standardised Demographic Dynamics Rate (SDDR).
The results obtained from the analysis of data concerning the residents of Kowal parish in the 19th century were set against the information about events causing a sudden growth in mortality in the local population derived from the widely-accessible literature (Dziki 2007b; 2007a; Rejmanowski 2001; Siudikas 1998; Wrębiak 2010; Korpalska 2011; Evans 1988; Puzyrewski 1899; Budnik 2008; Dorobek 1979; Winkle 1999; Włodarczyk 1998; Zasada 2006; Drozd-Lipińska, Bartczak, and Dziki 2021a; Dziki 2021) as well as the archives.
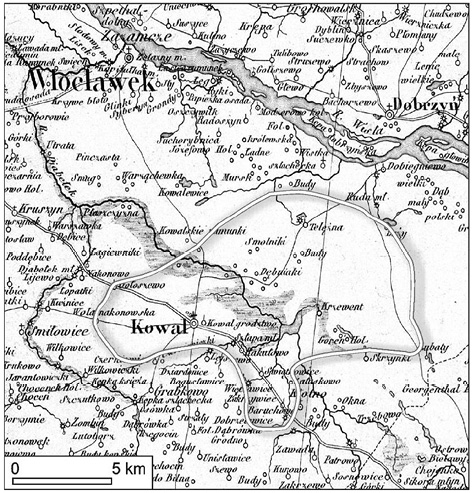
Kowal is a small town in the Eastern Kujawy region whose written historical records date back at least to the 12th century (Głowacki 2007). The people of the town itself, as well as that of the surrounding villages included in the parish (Fig. 1), largely lived off the land or, less frequently, craftsmanship (Gruszczyńska and Poraziński 2002; Dziki 2007a; 2021; Drozd-Lipińska 2021; Drozd-Lipińska, Bartczak, and Dziki 2021a).
Fig. 1. Map of 19th of Kowal Parish
Historical forces of the 19th-century Europe turned the commune of Kowal into a part of the Russian empire on the territory of the Kingdom of Poland (Zasada 2007; 2006). The harrowing political situation, combined with contributions regularly imposed on villages for the sake of marching armies, resulted in a profound economic crisis (Dziki 2007a; 2021). The situation of Kowal was further aggravated by its less-than-favourable location in relation to the existing communications network and the neighbourhood of the dynamically developing industrial centre – the city of Włocławek. Consequently, the parish missed out on the benefits potentially flowing from the 19th-century industrial revolution (Dziki 2007a; 2021; Drozd-Lipińska, Bartczak, Dziki 2021a). Moreover, the 1869 administrative reform, depriving the town of its borough rights for nearly half a century, significantly worsened its economic position (Zasada 2006; Dziki 2007a; 2021; Drozd-Lipińska, Bartczak, Dziki 2021a). Given the above, it seems justified to categorise Kowal and the neighbouring villages scattered around the area of approx. 18 km as a “typical” agricultural area.
The analysis was based on data obtained from record books kept by the Włocławek Branch of the National Archive in Toruń. The annual records from Kowal parish written in Polish or Russian contain information on christenings, deaths and weddings reported in the parish during a given year and provide an exact date of the event. On this basis, the information was gathered about 20124 births and 12971 deaths of the parishioners in 35 settlings, towns and villages in the parish of Kowal which happened in the period 1813–1909 (Table 1).
| Year | Births | Deaths | Year | Births | Deaths | Year | Births | Deaths | Year | Births | Deaths | |||
| 1813 | 116 | 77 | 1837 | 178 | 152 | 1861 | 174 | 86 | 1887 | 256 | 174 | |||
| 1814 | 146 | 72 | 1838 | 159 | 100 | 1862 | 217 | 140 | 1888 | 256 | 153 | |||
| 1815 | 128 | 44 | 1839 | 163 | 82 | 1863 | 228 | 140 | 1889 | 248 | 179 | |||
| 1816 | 131 | 97 | 1840 | 146 | 95 | 1864 | 223 | 126 | 1890 | 282 | 188 | |||
| 1817 | 138 | 91 | 1841 | 161 | 106 | 1865 | 239 | 101 | 1891 | 246 | 227 | |||
| 1818 | 165 | 73 | 1842 | 177 | 101 | 1866 | 254 | 94 | 1892 | 245 | 206 | |||
| 1819 | 149 | 70 | 1843 | 182 | 143 | 1867 | 242 | 103 | 1893 | 282 | 255 | |||
| 1820 | 168 | 64 | 1844 | 163 | 105 | 1868 | 200 | 122 | 1894 | 283 | 202 | |||
| 1821 | 177 | 73 | 1845 | 205 | 77 | 1869 | 236 | 95 | 1895 | 264 | 125 | |||
| 1822 | 189 | 93 | 1846 | 163 | 141 | 1870 | 232 | 90 | 1896 | 280 | 100 | |||
| 1823 | 181 | 73 | 1847 | 160 | 166 | 1871 | 220 | 96 | 1897 | 295 | 145 | |||
| 1824 | 182 | 134 | 1848 | 132 | 162 | 1872 | 230 | 94 | 1898 | 292 | 136 | |||
| 1825 | 190 | 104 | 1849 | 155 | 128 | 1873 | 235 | 117 | 1899 | 261 | 249 | |||
| 1826 | 206 | 99 | 1850 | 189 | 101 | 1874 | 209 | 142 | 1900 | 323 | 208 | |||
| 1827 | 160 | 112 | 1851 | 160 | 83 | 1875 | 238 | 101 | 1901 | 276 | 180 | |||
| 1828 | 165 | 149 | 1852 | 149 | 334 | 1876 | 219 | 102 | 1902 | 298 | 179 | |||
| 1829 | 166 | 145 | 1853 | 178 | 155 | 1879 | 236 | 187 | 1903 | 306 | 188 | |||
| 1830 | 143 | 148 | 1854 | 145 | 167 | 1880 | 245 | 117 | 1904 | 293 | 146 | |||
| 1831 | 130 | 215 | 1855 | 110 | 191 | 1881 | 224 | 119 | 1905 | 272 | 138 | |||
| 1832 | 99 | 173 | 1856 | 151 | 137 | 1882 | 247 | 158 | 1906 | 275 | 162 | |||
| 1833 | 181 | 90 | 1857 | 171 | 154 | 1883 | 228 | 250 | 1907 | 283 | 134 | |||
| 1834 | 169 | 61 | 1858 | 174 | 140 | 1884 | 249 | 118 | 1908 | 273 | 150 | |||
| 1835 | 175 | 110 | 1859 | 214 | 120 | 1885 | 249 | 122 | 1909 | 284 | 178 | |||
| 1836 | 155 | 101 | 1860 | 164 | 77 | 1886 | 253 | 161 | Sum | 20 124 | 12 971 | |||
Moreover, the population size was established based on data from catholic directoriums kept in Dioecesan Archive in Włocławek. Then the mortality rate was calculated (Fig. 2).
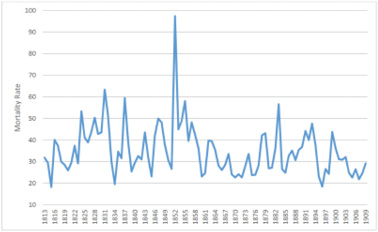
Fig. 2. Values of crude death rates [‰] for Kowal Parish (1813–1909)
The credibility of historical records, and thus their usefulness for our analysis, was tested by making a reference to findings made by Polish and French researchers (Gieysztorowa 1976; Goubert 1960), according to which the percentage of newborn deaths for the period concerned ought to stand at 30% of the total mortality rate. Following the commonly agreed opinion (Sułowski 1962; Kaczmarski 1967; Budnik 2005; Gieysztorowa 1976; Kuklo 2009), that register books of marriages were among the most diligently maintained record books, indicators relating the number of births to the number of marriages as well as the number of deaths to the number marriages were calculated. It was assumed that the ratio of the number of births to the number of marriages (B/M) of 5.0 and that of the number of deaths to the number of marriages (D/M) of 3.0 proved the correct and conscientious maintenance of the records, thus enabling further processing of the data obtained (Gieysztorowa 1962; 1976; Sułowski 1962; Kuklo 2009; Kaczmarski 1967; Budnik 2005).
The analysis made use of the formula, put forward by J.L. Dupâquier (Dupâquier 1979), makes it possible to classify the intensity of a crisis using the number of deaths, the average value and the standard deviation. According to the assumption, the calculated intensity index falling into intervals 1–2 stands for a minor crises and the subsequent intervals stand formoderate (2–4), high (4–8), major (8–16), super crises (16–32) and catastrophes (32+).
Next, according to Goubert (Goubert 1968), the moment in which the number of deaths has increased twofold during the year regarded as the crisis one in comparison to the preceding 12 months, and the number of conceptions has decreased by 1/3, was regarded to be the onset of a crisis.
The last method was the determination the level of balancing the number of births to the number of deaths – the Demographic Dynamics Rate (DDR) – (Holzer 2003) for every year. The assumption about the normal character of the analysed yearly and monthly series of the DDR was statistically verified with the Shapiro–Wilk test (Shapiro, Wilk 1965; Razali, Wah 2011) typically used to prove a hypothesis that a given sample comes from a normal distribution. The analysis was performed on the level of statistical significance α = 0.05. It is frequently stated that one of the basic requirements for particular models to be applicable is the normality of the series of data (Sakia 1992; Ajdacic-Gross et al. 2006). The series of demographic data do not tend to have the normal distribution and, as such, they are subject to log transformation, frequently with disputable results (Shang 2015). Bishai and Opuni (Bishai, Opuni 2009) highlighted the importance of selection of an appropriate method of data transformation for the research involving the comparison of various demographic indices. Similarly, H. Booth (Hyndman and Booth 2008), followed by H.L. Shang (Shang 2015), argued that a correctly chosen transformation is prerequisite for correct modelling and predicting various demographic parameters and occurrences.
Therefore all the analysed series were normalised and the values of indicators (x) were next subjected to the Box-Cox transformation (Box and Cox 1964; 1982; Bartczak, Glazik, Tyszkowski 2014). With the use of the transformation the skewness of the distribution pattern was eliminated and so were other difficult-to-analyse properties. Selected transformations of the series of monthly values are depicted graphically on the Quantile-Quantile plot (Fig. 3). The effectiveness of the transformation was subsequently re-tested by Shapiro-Wilk test. It is worth mentioning that value 1 of the DDR after the transformation, disregarding the λ parameter, takes the value of 0. The applied standardisation process enables the comparison of a number of series characterised by various input data – both in respect of their scale and the unit of measurement. All the above considerations concerning the properties of the normal distribution were used for the sake of classification of the calculated demographic dynamics rates and using them to evaluate the intensity of mortality crises.
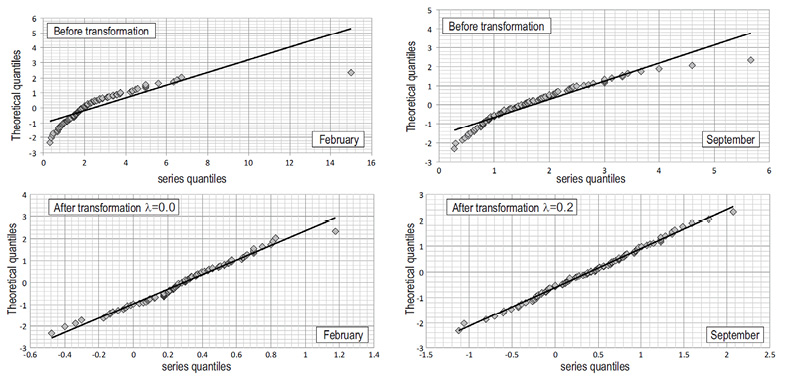
Fig. 3. Q-Q plot for the normal distribution of selected series of monthly demographic dynamics index for Kowal Parish (1813–1909) before and after Box-Cox transformation
The probability of occurrence of a particular value of the Standardised Demographic Dynamic Rate (the area under the density curve of the normal distribution) was used as the basis for classification (Table 2). It was assumed that a crisis year was defined by the value below or equal to -0.61 (differentiating between crises classified as “Very –“, “Anomalous –“ and “Extreme-“). Values of -0.61 to 0.61 stand for the years in which neither positive nor negative factors influencing the population reproduction process were observed (such factors either did not appear or they were mutually offset). Following the normalisation and standardisation procedure, the variability of indicators (Standardised Demographic Dynamics Rate – SDDR) in time was depicted with the use of a moving trend (segment, crawling). Next, the structural parameters of the function were estimated for each segment. The number of segments in one series is n-k+1 and the linear functions for each segment are as follows:ŷ1 = a1 + b1t for 1 ≤ t ≤ k ; ŷ2 = a2 + b2t for 2 ≤ t ≤ k+1; ............. ; ŷn-k+1 = an-k+1 + bn-k+1t for n-k+1 ≤ t ≤ n. The analysis was performed for the constant k = 15 years. All calculations were performed using the analytics software package Statistica 13.3.
| Classification | Times the standard deviation from the mean | Probability [%] |
| Extreme+ | ≥1.97 | 2.5 |
| Anomalous+ | 1.15 ÷ 1.96 | 10 |
| Very+ | 0.61 ÷ 1.14 | 15 |
| Normal | 0.60 ÷ -0.60 | 45 |
| Very- | -0.61 ÷ -1.14 | 15 |
| Anomalous- | -1.15 ÷ -1.96 | 10 |
| Extreme- | ≤-1.97 | 2.5 |
Source: Own study.
Dupȃquier’s Crises Intensity Ratio (DCIR) was enabled to identified twelve years of minor, eight years of formoderate and two years of high crises. In nine years DCIR reached values between -2 to – 1 (1833, 1834, 1839, 1850, 1851, 1860, 1866, 1895, 1907) and once yearly value was below -2 (1896) (Fig. 4).
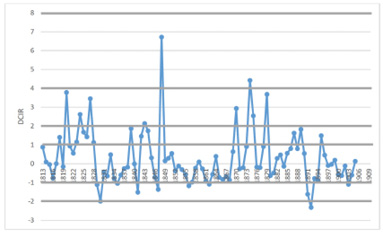
Fig. 4. Values of Dupâquier’s Crises Intensity Ratio for Kowal Parish (1813–1909)
Research procedure based on Goubert method allowed to identify only two crises years – 1816 and 1852.
In the third method (SDDR), based on yearly (Fig. 5) and monthly (homogenous) (Fig. 6) demographic dynamics ratio values, the distribution of most series of monthly indicators was brought to normality by means of the Box-Cox transformation. The Table 2 presents the obtained values of the parameter λ necessary for appropriate selection of the function transforming the series. Finally, 27 years of crises mortality have been identified for the population of Kowal (17 “Very –“; 6 “Anomalous –“; 4 “Extreme-“:) (Fig. 5, Table 3).
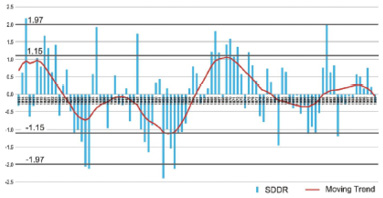
Fig. 5. Values and trend of Standarised Demografic Dynamic Ratio for Kowal Parish (1813–1909)
| Month | I | II | III | IV | V | VI | VII | VIII | IX | X | XI | XII | I-XII |
| λ | 0.2 | 0.0 | 0.3 | -0.1 | 0.0 | -0.2 | -0.1 | 0.2 | 0.2 | 0.0 | -0.2 | 0.0 | 0.9 |
Source: Own study.
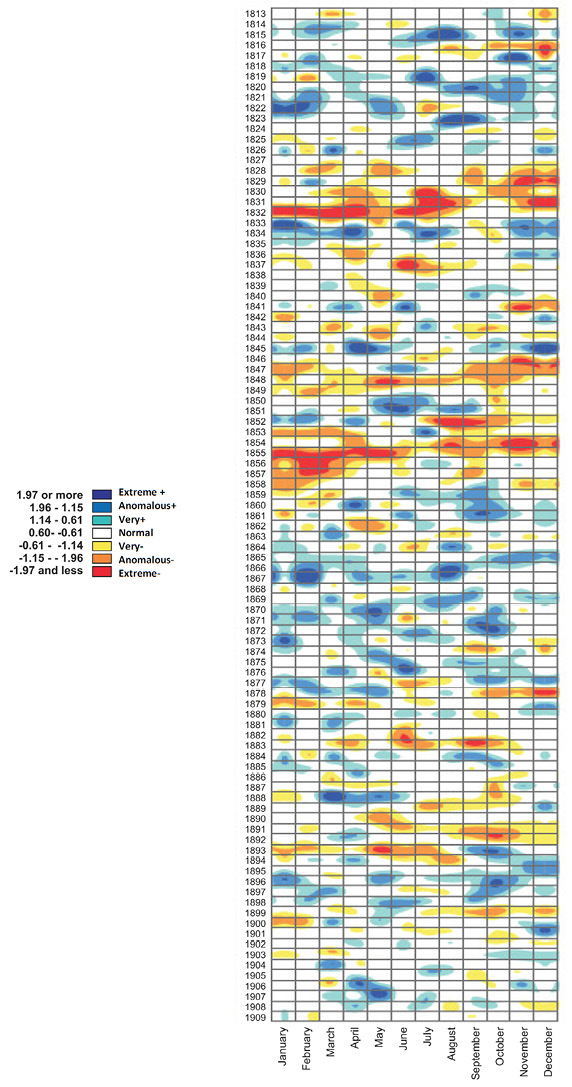
Fig. 6. Values of the monthly Standarised Demographic Dynamics Ratio (SDDR) for Kowal Parish (1813–1909)
The multi-year span which was investigated revealed a few long-lasting harrowing periods for the local population (Table 4). The first one, recorded in Twenties of the 19th century (as 1822, 1824, 1827–1832 according to DCIR and 1824 and 1828–1832 and 1837 according to SDDR), seems to have been an upshot of a harsh economic and political situation prevailing in the region following the outbreak of the anti-Russian uprising in November 1830, which engulfed the Kowal parish. A thorough investigation of historical sources suggests a direct link between extremely high/low values of the ratios, particularly in 1831 (annual number of births = 130; annual number of deaths = 215; DCIR = 3.45; SDDR = -2.07;) and 1832 (annual number of births = 99; annual number of deaths = 173; SDDR = -2.13) and a cholera epidemic (1831–1832) which broke out after Russian troops had been sent into the region in order to supress the uprising (Puzyrewski 1899; Włodarczyk 1998). This period was proceeded by one crisis year – 1816 (identified according to all three methods), year after Napoleon’s defeat, when soldiers was marched back from France to Russland through Kujavy Land (Dziki 2018; Drozd-Lipińska, Bartczak, and Dziki 2021a; 2021b) and after the Fourth Partition of Poland.
| Classification | Times the standard deviation from the mean | Number of occurrences |
| Extreme+ | ≥1.97 | 2 |
| Anomalous+ | 1.15 ÷ 1.96 | 12 |
| Very+ | 0.61 ÷ 1.14 | 16 |
| Normal | 0.60 ÷ -0.60 | 40 |
| Very- | -0.61 ÷ -1.14 | 17 |
| Anomalous - | -1.15 ÷ -1.96 | 6 |
| Extreme- | ≤ -1.97 | 4 |
Source: Own study.
The second long-lasting period of low reproduction rate was recorded in Forties-Fifties of the 19th century (1843, 1846–1848 and 1852 according to DCIR; 1843, 1846–1849, 1852–1858 according to SDDR, 1852 according to Goubert), which must have been an aftermath of the situation in place in the mid-1840s (food crisis triggered by failing harvest and mass damage to potato plantations) (Myszczyszyn 2013) which preceded the outbreak of the 1848 cholera epidemic (Włodarczyk 1998) and then another wave of the disease that decimated the population of Kujawy in 1852 (Rejmanowski 2001; Włodarczyk 1998). The latter sparked the third successive ”High” /“Extreme-“ demographic crisis and an increase in the value of the DCIR to 6.72 and a drop in the value of the SDDR to -2.39 in 1852 (annual number of births = 149; annual number of deaths = 334), the highest/lowest level recorded in the researched period. The next evident “Extreme-“ demographic crisis according to SDDR method was recorded in 1855 (SDDR = -2.13; annual number of births = 110; annual number of deaths = 191) and, again, it is tied with the appearance of cholera in the area (unidentified by DCIR or Goubert’s method) (Włodarczyk 1998).
The two last long-lasting mortality crises periods were observed in the late 19th century. Seventies (1874 and 1878–79 according to DCIR and 1878–19 according to SDDD) and Nineties (respectively: 1891, 1893, 1899 and 1891–1893, 1899) were unfavourable, but it must be noted that the late 19th century manifests a universal tendency to shorten the negatively-marked periods and to diminish the intensity of their negative impact on the population (Fig. 4–6). This may have been caused by the weakening impact of epidemics on the level of mortality owing to improved sanitation and fast-developing medicine. The moving trend for the decade (based on SDDR values) suggests the occurrence of several adverse factors, yet successfully offset by various social phenomena like the population migration (Szczechowicz 2013; Jura 2002).
At this stage of research it is not possible to connect sudden increase of DCIR value in 1878 (DCIR = 4.42) and 1910 (DCIR = 2.35) with specific historical or economic event, while increase/decrease of ratios values in 1883 (DCIR = 3.68; SDDR = -1.46) should be a consequence of some kind of epidemic, as described before (Drozd-Lipińska, Klugier, Kamińska-Czakłosz 2015).
While analysing the distribution of the SDDR in an annual cycle (Fig. 6), one is prone to observe that events having an adverse impact on the population do not display any seasonal character lasting up to several months. An example of such an event is the demographic crisis which started in September 1829 and did not finish until July 1832, during which period the SDDR stood at the level below -2.00 for as many as 11 months. July 1830 and April 1832 marked the moments of the most severe crisis with the SDDR of -3.24 (monthly number of births = 3; monthly number of deaths = 12) and -3.05 (monthly number of births = 7; monthly number of deaths = 26) respectively. The situation was largely repeated in 1854 and 1855 with very low monthly values of the indicator, though the relation of births to deaths was not as dramatically negative as it had been two decades before. The distribution of the indicator in the yearly cycle took a very interesting form in 1852. During the first six months of the year the ratio of births to deaths remained in the positive area with the peak value of the SDDR of 1.85 in April. On the other hand, the period from July to October was an extremely unfavourable time for the investigated population with the bottom value of the SDDR of 3.37 observed in August 1852 (monthly number of births = 11; monthly number of deaths = 210), which was the lowest level for the whole period included in the research.
| Year | DCIR | SDDR | Goubert |
| 1816 | Minor | Very - | + |
| 1822 | Minor | ||
| 1824 | Formoderate | Very - | |
| 1827 | Minor | ||
| 1828 | Formoderate | Very - | |
| 1829 | Minor | Very - | |
| 1830 | Minor | Anomalous - | |
| 1831 | Formoderate | Extreme - | |
| 1832 | Minor | Extreme - | |
| 1837 | Very - | ||
| 1843 | Minor | Very - | |
| 1846 | Minor | Very - | |
| 1847 | Formoderate | Anomalous - | |
| 1848 | Minor | Anomalous - | |
| 1849 | Very - | ||
| 1852 | High | Extreme - | + |
| 1853 | Very - | ||
| 1854 | Anomalous - | ||
| 1855 | Extreme - | ||
| 1856 | Very - | ||
| 1857 | Very - | ||
| 1858 | Very - | ||
| 1874 | Formoderate | ||
| 1878 | High | Very - | |
| 1879 | Formoderate | Very - | |
| 1883 | Formoderate | Anomalous - | |
| 1891 | Minor | Very - | |
| 1892 | Very - | ||
| 1893 | Minor | Very - | |
| 1899 | Minor | Anomalous - | |
| 1910 | Formoderate | ||
Illnesses of endemic or epidemic character used to be among the most significant regulators of the natural population movement in the pre-industrial era. Their kind and frequency of appearance evolved throughout centuries following cultural transformations. The transformations of the social patterns of health and illness characteristic of subsequent historical periods are known, after A. R. Omran (Omran 1971), as “epidemiological transitions”. The 19th century saw a gradual decrease in infectious disease mortality and, at the same time, an increase in the number of deaths resulting from civilization illnesses and other external reasons which became the main cause of deaths. Waves of epidemics which had haunted Europe for centuries, now gave way to chronic and degenerative diseases related to the ageing population. Growing industrialisation brought about civilisation diseases, allergies and depression (Gagnon 2012). This change, known as the second epidemiological transition, was first observed in Sweden, England and Wales, Germany, France and Italy in the mid-19th century and is directly associated with the ongoing industrial revolution, technological development, improved sanitation and progress in medicine (Barrett et al. 1998; Omran 1971). The area of modern Poland did not experience this transition until later time when, as suggested by A. Budnik in her research on Greater Poland (Budnik 2008), rapid industrialisation process took place in Poznań area in the period 1875–1880. The rural populations of Greater Poland waited for this same transition for two decades until the late 19th century (1896–1900) as was the case with Kujawy region. The present research indicates that the onset of the transition in this area fell on the last five years of the 19th century when the epidemics, which had regularly decimated the population, suddenly stopped being the main factor shaping the mortality patterns. Interestingly, then, the second epidemiological transition in the rural community of Kujawy was not delayed by the economic underdevelopment of the region resulting from specific political, economic and social conditioning of this part of the Russian partition (Dziki 2007b; 2021; Drozd-Lipińska, Bartczak, Dziki 2021b; 2021a).
The period directly preceding the second epidemiological transition was the time of many sudden increases in the number of deathsfalling into the category of demographic crises. The methods described earlier in the article enable researchers to identify them in a relatively precise manner without investigating their root causes (Miodunka 2013; Hinde 2010; Kuklo 2009; Appleby 1978; Edvinsson 2015; Turner 1973; Schofield 1972; Hoch 1998; Humphreys 1987; Lebrun 1977). A further analysis of sources other than record books – annuals, diaries, letters, legal documents, or later, daily press, makes it possible to tie the periods of increased mortality with epidemic episodes, climatic phenomena or historical events (Sawchuk et al. 2013), sometimes also offering a chance to capture the phenomenon of social selectivity (SES) which may have resulted in differing rates of mortality between rural and urban communities, or between various social classes (Healey 2008; Breschi, Manfredini, Fornasin 2011).
Most of the identified 19th-century demographic crises were triggered by Asian cholera whose recurrent waves decimated the population of Europe since 1817 (Smith 1978; Straszak-Chandoha 2008; 2013; Rüttimann and Loesch 2012). All of the 5 (in 1817–1823; 1826–1837; 1846–1862; 1864–1875, 1883–1896 (Siudikas 1998) or in 1817–1823; 1826–1837; 1841–1862; 1864–1875; 1882–1896 (Winkle 1999)) or 6 (in 1817–1823; 1826–1837; 1842–1859; 1863–1875; 1881–1896; 1899–1923 (Evans 1988)) strikes of epidemics would decrease the number of marriages due to a natural tendency to postpone vital decisions for better times. Initially, the number of births dropped, yet the number of conceptions went up periodically at the peak moments of an epidemic, which may have been a result of tightening family bonds in harsh times (Kuklo 2009; Miodunka 2013). Owing to this mechanism, at the final stages of an epidemic an increased number of christenings were often recorded, though it was not a rule. Cholera epidemics observed and recorded in Poland (Czapliński 2012; Berner 2008; Budnik, Liczbińska 1997; Liczbińska, Sosinko, Budnik 2007; Liczbińska 2009; 2013; Piasecki 1990; Wrębiak 2010; Rejmanowski 2001; Korpalska 2011; Dorobek 1979; Włodarczyk 1998) perfectly correspond to demographic crises which occurred in 1831–1832, 1848 and 1852 on a given area.
Sources suggest a correlation between the growth in the number of deaths, a decline in the number of marriages and conceptions and an increase in grain prices or the periods of food crises (Appleby 1973; Nelson 1991; Miodunka 2013; Humphreys 1987). Historically, epidemic diseases would frequently strike following periods of famine when the levels of immunity in the population was greatly lowered (Kuklo 2009; Gieysztorowa 1976; Lebrun 1977).
Negative environmental factors are reflected in historical sources especially in relations to the 1840s and the late 1870s. During the first crisis period of 1828–1832 the population of the parish of Kowal most probably failed to resist the negative influence of economic hardships and resulting famine, which led to an increased number of deaths combined with a decreased number of conceptions. Simultaneously, the weakened population became more susceptible to the upcoming waves of epidemics brought by the Russian troops in 1831 and still decimating the population of Kujawy in the following year (Puzyrewski 1899; Włodarczyk 1998).
Similarly, negative events of economic character (food crisis of the mid-1840s caused by failing harvest and widespread damage to potato plantations) (Myszczyszyn 2013) scarred the population of Kowal for the whole period of 1846-1857 marked by three waves of cholera epidemics in 1848 (Włodarczyk 1998), 1852 and 1855 when another demographic crisis appeared (Rejmanowski 2001; Włodarczyk 1998).
The article was an attempt to identify and evaluate the intensity of demographic crises occurring among the catholic rural population in the 19th century. Identification and evaluation of mortality crises in Polish population was carried, thus far, for Gdansk, Warsaw, Poznan and Gubin (17th–18th Centuries) (Guzowski, Kuklo, Poniat 2016; Kuklo 2009). Guzowski et al. (Guzowski, Kuklo, and Poniat 2016) mentioned, that Dupȃquier’s method works better for years when epidemics and plagues have occurred at significant intervals. Otherwise, the high number of deaths in previous years overestimates the average. Furthermore DCIR values are based only on number of deaths and could falsify results during rapid increase in the population size. Hence it seems that Standardised Demographic Dynamics Rate, based both deaths and births numbers, could be the better method to crises identification.
Goubert’s method, because of its poor sensitivity, turned out to be the least useful for crises identification in such small, rural population.
Standardised indices are widely used to identify and evaluate the level of intensity of events also in other fields of natural sciences such as climatology (McKee, Doesken, Kleist 1993; Guttman 1999; Karavitis et al. 2011; Łabędzki 2007; Bonaccorso et al. 2003) or hydrology (Bartczak, Glazik, and Tyszkowski 2014). Standardised index in demography, based on births and deaths numbers, provides information about the condition of a population, disregarding the size of the group. Nevertheless, only by combining the statistically obtained data with the information derived from written records is it possible to attempt to answer the question of the possible root cause of a demographic crisis.
Conflict of interests
All authors declared no conflict of interests.
Authors’ contribution
AD-L, AB, MK performed modelling work; AD-L, AB, TD analysed output data; AD-L and AB wrote the manuscript with assistance of MK and TD. All authors substantially contributed to revisions.
The work was a result of a NSC project no. 2017/25/B/HS3/00243
Ajdacic-Gross V, Lauber C, Sansossio R, Bopp M, Eich D, Gostynski M, Gutzwiller F, Rossler W. 2006. Seasonal Associations between Weather Conditions and Suicide–Evidence against a Classic Hypothesis. American Journal of Epidemiology 165(5):561–569, https://doi.org/10.1093/aje/kwk034
Appleby, Andrew B. 1973. Disease or Famine? Mortality in Cumberland and Westmorland 1580-1640. The Economic History Review 26(3):403–432, https://doi.org/10.1111/j.1468-0289.1973.tb01944.x; https://doi.org/10.2307/2593543
Appleby, Andrew B. 1978. Famine in Tudor and Stuart England. Stanford, Calif : Stanford UP.
Barrett R, Kuzawa ChW, McDade T, Armelagos GJ. 1998. Emerging and Re-Emerging Infectious Diseases: The Third Epidemiologic Transition. Annual Review of Anthropology 27:247–271, https://doi.org/10.1146/annurev.anthro.27.1.247
Bartczak A, Glazik R, Tyszkowski S. 2014. The Application of Box-Cox Transformation to Determine the Standardised Precipitation Index (SPI), the Standardised Discharge Index (SDI) and to Identify Drought Events: Case Study in Eastern Kujawy (Central Poland). Journal of Water and Land Development 22(1):3–15, https://doi.org/10.2478/jwld-2014-0017
Berner W. 2008. Stan Sanitarny, Ochrona Zdrowia i Sytuacja Epidemiologiczna Chorób Zakaźnych w Krakowie w Okresie Autonomii Galicyjskiej (Lata 60./70. XIX w. – Do 1914 r.). Przegląd Epidemiologiczny 62:181–91.
Bishai D, Opuni M. 2009. Are Infant Mortality Rate Declines Exponential? The General Pattern of 20thcentury Infant Mortality Rate Decline. Population Health Metrics 7:13, https://doi.org/10.1186/1478-7954-7-13
Bonaccorso B, Bordi I, Cancelliere A, Rossi G, Sutera A. 2003. Spatial Variability of Drought: An Analysis of the SPI in Sicily. Water Resources Management 17(4):273–296, https://doi.org/10.1023/A:1024716530289
Bouckaert A. 1989. Crisis Mortality: Extinction and near-Extinction of Human Populations. In: Ruzicka L, Wunsch G, Kane P. (Eds.), Differential Mortality: Methodological Issues and Biosocial Factors. Oxford: Clarendon Press, 217–230.
Box GEP, Cox DR. 1964. An Analysis of Transformations. Journal of the Royal Statistical Society Series B (Methodological) 26(2):211–252, https://doi.org/10.1111/j.2517-6161.1964.tb00553.x
Box GEP, Cox DR. 1982. An Analysis of Transformations Revisited, Rebutted. Journal of the American Statistical Association 77(377):209–210, https://doi.org/10.1080/01621459.1982.10477788
Breschi M, Manfredini M, Fornasin A. 2011. Demographic Responses to Short-Term Stress in a 19th Century Tuscan Population: The Case of Household out-Migration. Demographic Research 25:491–512, https://doi.org/10.4054/DemRes.2011.25.15
Budnik A. 2005. Uwarunkowania Stanu i Dynamiki Biologicznej Populacji Kaszubskich w Polsce: Studium Antropologiczne. Antropologia 22 – Uniwersytet im. Adama Mickiewicza w Poznaniu. Poznań: Wydawnictwo Naukowe UAM.
Budnik A. 2008. Przejścia epidemiczne na ziemiach polskich. In: Dzieduszycki W, Wrzesiński J. (Eds.), Epidemie, klęski, wojny. Funeralia Lednickie. Spotkanie 10, 53–66. Poznań.
Budnik A, Liczbińska G. 1997. Mortality in the Populations of Danzig and the District of Danzig (Regierungsbezirk Danzig) in the Second Half of the Nineteenth Century. Przegląd Antropologiczny 60:13–24, https://doi.org/10.18778/1898-6773.60.02
Czapliński MP. 2012. Epidemie cholery w rejencji opolskiej w latach 1831–1894.
Dorobek F. 1979. Epidemia Cholery w Królestwie Polskim i Guberni Płockiej w 1848 r. Notatki Płockie 24(1–98):25–36.
Drozd-Lipińska A. 2021. Wielkość populacji i ruch naturalny w parafii Kowal w latach 1815–1914. In: Drozd-Lipińska A. (Ed.), Umieralność mieszkańców wsi kujawskiej w latach 1815–1914 na tle zmian społeczno-gospodarczych i przemian elementów klimatu na przykładzie parafii Kowal, Toruń: Wydawnictwo Naukowe Uniwersytetu Mikołaja Kopernika, 57–73.
Drozd-Lipińska A, Bartczak A, Dziki T. 2021a. Demografia, gospodarka, warunki klimatyczne i życie społeczne. In: Drozd-Lipińska A. (Ed.), Umieralność mieszkańców wsi kujawskiej w latach 1815–1914 na tle zmian społeczno-gospodarczych i przemian elementów klimatu na przykładzie parafii Kowal. Toruń: Wydawnictwo Naukowe Uniwersytetu Mikołaja Kopernika, 91–249.
Drozd-Lipińska A, Bartczak A, Dziki T. 2021b. Podsumowanie. In: Drozd-Lipińska A. (Ed.), Umieralność mieszkańców wsi kujawskiej w latach 1815–1914 na tle zmian społeczno-gospodarczych i przemian elementów klimatu na przykładzie parafii Kowal. Toruń: Wydawnictwo Naukowe Uniwersytetu Mikołaja Kopernika, 251–267.
Drozd-Lipińska A, Klugier E, Kamińska-Czakłosz M. 2015. Socioeconomic Differences in Child Mortality in Central Poland At the End of the Nineteenth Century. Journal of Biosocial Science 47(4):449–468, https://doi.org/10.1017/S0021932014000376
Dupâquier J. 1979. L’analyse Statistique Des Crises de Mortalité. In: Charbonneau H, La Rose A. (Eds.), Les Grandes Mortalités: Étude Méthodologique Des Crises Démographiques. Liège: Ordina Editions, 83–112.
Dziki T. 2007a. Z dziejów Kowala w latach 1815–1869. In: Zasada ZJ. (Ed.), Kowal poprzez wieki. Materiały do dziejów Kowala i jego okolicy z konferencji naukowej “Społeczność Kowala i okolic w dawnych czasach oraz dobie współczesnej” zorganizowanej 29 IV 2006 r. w Kowalu. Włocławek–Kowal: Totem, 61–86.
Dziki T. 2007b. Z dziejów Kujaw Wschodnich w II połowie XIX wieku (1851–1914). In: Cieśla A. (Ed.), Spotkanie dwóch cesarzy w Aleksandrowie. Z dziejów miasta i regionu w okresie zaborów, Aleksandrów Kujawski: Miejska Biblioteka Publiczna im. Marii Danilewicz, 11–36.
Dziki T. 2018. Powiat Włocławski w latach 1793–1918. In: Mikulski K, Dziki T. (Eds.), Monografia Powiatu Włocławskiego. Toruń: in press.
Dziki T. 2021. Przynależność administracyjna Kowala i okolic w latach 1815–1914. In: Drozd-Lipińska A. (Ed.), Umieralność mieszkańców wsi kujawskiej w latach 1815–1914 na tle zmian społeczno-gospodarczych i przemian elementów klimatu na przykładzie parafii Kowal. Toruń: Wydawnictwo Naukowe Uniwersytetu Mikołaja Kopernika, 45–56.
Edvinsson RB. 2015. Recalculating Swedish Pre-Census Demographic Data: Was There Acceleration in Early Modern Population Growth? Cliometrica 9(2):167–191, https://doi.org/10.1007/s11698-014-0112-z
Evans RJ. 1988. Epidemics and Revolutions: Cholera in Nineteenth-Century Europe. Past & Present 120:123–146. https://doi.org/10.1093/past/120.1.123
Gagnon A. 2012. Crises and Trends: Mortality in Historical Perspective. Canadian Studies in Population 39(3–4):1–7.
Gieysztorowa I. 1962. Badania Demograficzne Na Podstawie Metryk Parafialnych. Kwartalnik Historii Kultury Materialnej X(1–2):103–121.
Gieysztorowa I. 1976. Wstęp do Domografii Staropolskiej. Warszawa: Państwowe Wydawnictwo Naukowe.
Głowacki PS. 2007. Dzieje parafii pod wezwaniem Św. Urszuli w Kowalu i Dekanatu Kowalskiego. In: Zasada ZJ. (Ed.), Kowal poprzez wieki. Materiały do dziejów Kowala i jego okolicy z konferencji naukowej “Społeczność Kowala i okolic w dawnych czasach oraz dobie współczesnej” zorganizowanej 29 IV 2006 r. w Kowalu. Włocławek–Kowal: Totem, 39–55.
Goubert P. 1960. Beauvais et Le Beauvaisis de 1600 à 1730. Contribution à l’histoire Sociale de La France Au XVIIe Siècle. Paris: S. E. V. P. E. N.
Goubert P. 1968. Cent mille provinciaux au XVIIe siècle: Beauvais et le Beauvaisis de 1600 à 1730. Paris: Flammarion.
Gruszczyńska M, Poraziński J. 2002. Opis statystyczny z dnia 11/23 maja 1860 r. sporządzony przez burmistrza miasta Kowala. In: Kallas M, Leliński S, Stelmach R, Tomczak A, Trojanowska M. (Eds.), Opisy miast Kujaw Wschodnich z 1860 r. (Gubernia Warszawska). Nowe Miscellanea Historyczne, Seria Opisy Miast Królestwa Polskiego w XIX Wieku. Opisy Miast z 1860 Roku, t. VI. Warszawa: Naczelna Dyrekcja Archiwów Państwowych, 29–48.
Guttman NB. 1999. Accepting the Standardized Precipitation Index: A Calculation Algorithm. Journal of the American Water Resources Association 35(2):311–22, https://doi.org/10.1111/j.1752-1688.1999.tb03592.x
Guzowski P, Kuklo C, Poniat R. 2016. O metodach pomiaru natężenia epidemii i zaraz w preindustrialnej Europie w demografii historycznej. In: Polek K, Sroka ŁT. (Eds.), Epidemie w dziejach Europy. Konsekwencje społeczne, gospodarcze i kulturowe. Kraków: Wydawnictwo Naukowe Uniwersytetu Pedagogicznego, 119–144.
Healey J. 2008. Socially Selective Mortality during the Population Crisis of 1727–1730: Evidence from Lancashire. Local Population Studies, no. 81:58–74.
Hinde A. 2010. A Review of Methods for Identifying Mortality ‘crises’ Using Parish Record Data. Local Population Studies 39(84):82–92.
Hoch SL. 1998. Famine, Disease, and Mortality Patterns in the Parish of Borshevka, Russia, 1830–1912. Population Studies 52(3):357–368, https://doi.org/10.1080/0032472031000150526
Hollingsworth TH. 1979. Background Paper to First Theme: An Introduction to Population Crises. In: Charbonneau H, La Rose A. (Eds.), Les Grandes Mortalités: Étude Méthodologique Des Crises Démographiques Du Passé. Liège: Ordina Editions, 17–20.
Holzer JZ. 2003. Demografia. Warszawa: Polskie Wydawictwo Ekonomiczne.
Humphreys R. 1987. Mortality Crises in Sixteenth-Century Dorking. Local Population Studies. ENGLAND.
Hyndman R., Booth H. 2008. Stochastic Population Forecasts Using Functional Data Models for Mortality, Fertility and Migration. International Journal of Forecasting 24(3):323–342, https://doi.org/10.1016/j.ijforecast.2008.02.009
Jura J. 2002. Emigracja z Galicji w drugiej połowie XIX i na początku XX wieku na przykładzie wybranych powiatów. Zeszyty Naukowe Ostrołęckiego Towarzystwa Naukowego 16:227–270.
Kaczmarski B. 1967. Ocena spisów ludności na Śląsku z pierwszej połowy XIX wieku. Przeszłość Demograficzna Polski 1:33–63.
Karavitis ChA, Alexandris S, Tsesmelis DE, Athanasopoulos G. 2011. Application of the Standardized Precipitation Index (SPI) in Greece. Water (Switzerland) 3(3):787–805, https://doi.org/10.3390/w3030787
Korpalska WK. 2011. Pacjenci i Lekarze w Czasie Epidemii Cholery 1831–1832 Na Ziemiach Polskich Pod Pruskim Zaborem. In: Felsmann MZ, Szarek J, Felsmann M. (Eds.), Dawna Medycyna i Weterynaria. Pacjent. Chełmno: Muzeum Ziemi Chełmińskiej w Chełmnie, 69–85.
Kuklo C. 2009. Demografia Rzeczypospolitej Przedrozbiorowej. Warszawa: Wydawnictwo DiG.
Łabędzki L. 2007. Estimation of Local Drought Frequency in Central Poland Using the Standarized Precipitation Index SPI. Irrigation and Drainage 56:67–77, https://doi.org/10.1002/ird.285
Landers J. 2006. Death and the Metropolis Studies in the Demographic History of London, 1670–1830. Cambridge: Cambridge University Press.
Lebrun F. 1977. Les Épidémies En Haute-Bretagne à La Fin de l’Ancien Régime (1770–1789). Présentation d’une Enquête Collective. Annales de Démographie Historique, 181–206, https://doi.org/10.3406/adh.1977.1348
Liczbińska G. 2009. Umieralność i Jej Uwarunkowania Wśród Katolickiej i Ewangelickiej Ludności Historycznego Poznania. Poznań: Biblioteka Telgete.
Liczbińska G. 2013. Fertility Patterns and Reproductive Behaviours in the Lutheran and Catholic Populations from Historical Poland. Advances in Anthropology 03(03):149–156, https://doi.org/10.4236/aa.2013.33020
Liczbińska G, Sosinko A, Budnik A. 2007. Uwarunkowania Stanu Zdrowia w XIX-Wiecznym Poznaniu. Nowiny Lekarskie 76(4):357–362.
McKee TB, Doesken NJ, Kleist J. 1993. The Relationship of Drought Frequency and Duration to Time Scales. AMS 8th Conference on Applied Climatology, no. January 179–184.
Miodunka P. 2013. Staropolskie księgi metrykalne jako źródło do badania klęsk elementarnych. In: Głowiński T, Kosik E. (Eds.), Od powietrza, głodu, ognia i wojny… Klęski elementarne na przestrzeni wieków. Wrocław: Gajt Wydawnictwo 1991 s.c.
Myszczyszyn J. 2013. Kryzys żywnościowy w latach 1845–1847 ze szczególnym uwzględnieniem zarazy ziemniaczanej na przykładzie Prus. In: Głowiński T, Kosik E. (Eds.), Od powietrza, głodu, ognia i wojny… Klęski elementarne na przestrzeni wieków. Wrocław: Gajt Wydawnictwo 1991 s.c., 129–142.
Nelson I. 1991. Famine and Mortality Crises in Mid-Sussex, 1606–1640. Local Population Studies. ENGLAND.
Omran AR. 1971. The Epidemiologic Transition. A Theory of the Epidemiology of Population Change. The Milbank Memorial Fund Quarterly 49(4):509–538, https://doi.org/10.2307/3349375
Piasecki E. 1990. Ludność Parafii Bejskiej (Woj. Kieleckie) w Świetle Ksiąg Metrykalnych z XVIII-XX W. Warszawa–Wrocław: PWN.
Puzyrewski AK. 1899. Wojna Polsko-Ruska 1831 R. Kraków: Krajowa Agencja Wydawnicza.
Razali N, Wah Y. 2011. Power Comparisons of Shapiro-Wilk, Kolmogorov-Smirnov, Lilliefors and Anderson-Darling tests. Journal of Statistical Modeling and Analytics 2:21–33.
Rejmanowski T. 2001. Przyczynek do walki z cholerą na przykładzie jej epidemii w Osięcinach na Kujawach Wschodnich w 1852 r. Archiwum Historii i Filozofii Medycyny, nr 1.
Rüttimann D, Loesch S. 2012. Mortality and Morbidity in the City of Bern, Switzerland, 1805–1815 with Special Emphasis on Infant, Child and Maternal Deaths. HOMO – Journal of Comparative Human Biology 63(1):50–66, https://doi.org/10.1016/j.jchb.2011.11.001
Sakia RM. 1992. The Box-Cox Transformation Technique: A Review. Journal of the Royal Statistical Society. Series D (The Statistician) 41(2):169–178, https://doi.org/10.2307/2348250
Sawchuk LA, Tripp L, Damouras S, Debono M. 2013. Situating Mortality: Quantifying Crisis Points and Periods of Stability. American Journal of Physical Anthropology 152(4):459–470, https://doi.org/10.1002/ajpa.22380
Schofield R. 1972. ‘Crisis’ Mortality. Local Population Studies 9:10–22.
Shang HL. 2015. Selection of the Optimal Box-Cox Transformation Parameter for Modelling and Forecasting Age-Specific Fertility. Journal of Population Research 32(1):69–79, https://doi.org/10.1007/s12546-014-9138-0
Shapiro SS, Wilk MB. 1965. An Analysis of Variance Test for Normality (Complete Samples). Biometrika 52(3/4):591–611, https://doi.org/10.1093/biomet/52.3-4.591
Siudikas V. 1998. Choleros Epidemijos Lietuvoje 1831–1921 Metais : Daktaro Disertacijos Santrauka : Biomedicinos Mokslai, Medicina. Kaunas: Kauno medicinos akademija.
Smith PC. 1978. Crisis Mortality in the Nineteenth Century Philippines: Data from Parish Records. The Journal of Asian Studies 38(1):51–76, https://doi.org/10.2307/2054237, https://doi.org/10.1017/S0021911800139816
Straszak-Chandoha S. 2008. Epidemie cholery a reformy sanitarne w Wielkiej Brytanii w latach 40. i 50. XIX wieku. Prace Naukowe Uniwersytetu Ekonomicznego We Wrocławiu Nr 26. Nauki Humanistyczne 12:187–198.
Straszak-Chandoha S. 2013. Nieudane Próby Opanowania Epidemii Cholery w Wielkiej Brytanii w Latach 1831–1832. In: Głowiński T, Kosik E. (Eds.), Od powietrza, głodu, ognia i wojny… Klęski elementarne na przestrzeni wieków. Wrocław: Gajt Wydawnictwo 1991 s.c., 117–127.
Sułowski Z. 1962. O właściwą metodę wykorzystywania metryk kościelnych dla badań demograficznych. Kwartalnik Historii Kultury Materialnej X(1–2):81–101.
Szczechowicz H. 2013. Kujawy Wschodnie i Ziemia Dobrzyńska w II Rzeczypospolitej. Administracja, Gospodarka, Życie Społeczno-Polityczne, Szkolnictwo 1918–1928. Włocławek: Państwowa Wyższa Szkoła Zawodowa we Włocławku.
Turner D. 1973. ‘Crisis’ Mortality in Nine Sussex Parishes. Local Population Studies 11:40–43.
Winkle S. 1999. Kulturgeschichte Der Seuchen. Frechen : Komet.
Włodarczyk D. 1998. Od Powietrza, Głodu, Ognia i Wojny. Inowrocław: Zakład Poligraficzno-Wydawniczy POZKAL.
Wrębiak A. 2010. Cholera and Typhoid Fever in 19th-Century Bielitzer Zion. Anthropological Review 73(1):37–46, https://doi.org/10.2478/v10044-008-0020-6
Zasada Z.J. 2006. Kowal i okolice w okresie zaborów i walk Narodowowyzwoleńczych (1772–1918). In: Zasada ZJ. (Ed.), Kowal poprzez wieki. Materiały do dziejów Kowala i jego okolicy z konferencji naukowej “Społeczność Kowala i okolic w dawnych czasach oraz dobie współczesnej” zorganizowanej 29 IV 2006 r. w Kowalu. Włocławek–Kowal: Totem, 283–294.
Zasada ZJ. 2006. 2007. Wstęp. In: Zasada ZJ. (Ed.), Kowal poprzez wieki. Materiały do dziejów Kowala i jego okolicy z konferencji naukowej “Społeczność Kowala i okolic w dawnych czasach oraz dobie współczesnej” zorganizowanej 29 IV 2006 r. w Kowalu. Włocławek–Kowal: Totem, 7–10.


Received: 2021.11.24; Revised: 2022.08.19; Accepted: 2022.08.30