Available online at: https://doi.org/10.18778/1898-6773.85.2.08
Government General Degree College, Keshiary, West Bengal, India
Mrinalini Datta Mahavidyapith, West Bengal, India
University of Calcutta, West Bengal, India
Indian Statistical Institute, West Bengal, India
ABSTRACT: Overweight and obesity in adolescent girls are considered a leading global public health issues in recent times. There is a need to evaluate the potential socioeconomic and behavioural factors behind adolescents’ overweight and obesity in different environmental settings. The present study aims to understand the prevalence of overweight and obesity among urban adolescent school girls and to determine the association between selected socioeconomic and behavioural factors and overweight/obesity. This is a cross-sectional study using a multistage stratified cluster sampling with a sample size of 1041 adolescent girls aged 10 to 18 years from schools of Kolkata, India. Overall prevalence of overweight and obesity were 18.9% and 23.7%, respectively. The prevalence of overweight and obesity was higher among those adolescent girls whose parents had completed higher education (49.5%) and had higher monthly per capita household expenditure (48.4%). Stepwise binary logistic regression analysis confirmed that the probability of being overweight/ obese tended to be in adolescents who slept less than 7 hours per day (p<0.001). Overweight /obesity was also higher among those children whose fathers were fatty (p=0.002), taken medicines three months before the survey (p=0.008), and watched television and mobile phones for more than 1 hour a day (p=0.039). Rapid change in modern lifestyles is seemingly decreasing sleep duration in adolescents with subsequent negative impact on their health.
KEY WORDS: Prevalence, Obesity, Body Mass Index, Sleep, Adolescents, India
Obesity, a “pandemic”, has potential consequences for human health (Chincholikar et al. 2016). It generally results from an imbalance between energy intake and energy expenditure. Several international and regional studies indicate that several factors are responsible for developing obesity; these include genetic, behavioural, environmental, cultural, and socioeconomic factors (Okour et al. 2019).
Adolescent obesity is growing very fast and leads to a wide range of health issues regardless of weight during adulthood. It has become increasingly important to identify the risk factors predisposing to overweight and obesity from childhood onwards (Viswambharan et al. 2020). Adolescence is a period of high physical growth and reproductive maturation that generally requires optimal macro or micronutrients or both (Egidaw and Gebremariam 2019; Kumar et al. 2021). It is also the peak time when individuals start to decide on their lifestyle, take fast food, develop sedentary behaviours, etc. (Bjorntorp 2001).
Examining the factors involving weight gain and obesity in developing countries is very sensitive because socioeconomic changes in those countries lead to the problem of managing obesity and have a significant concern about malnutrition (Bharati et al. 2008). Therefore, it is essential to determine which factors are associated most with obesity among adolescents. Chincholikar and Sohani (2016) stated that adolescents belonging to the upper socioeconomic class may be at higher risk of becoming obese than those in lower classes. Several studies found that economic difficulties, educational level, lifestyle behaviours, low cost of energy-dense foods etc., are potential variants in determining the physical health status of adolescent girls (Pigeyre et al. 2012). Ghosh (2014), who studied adolescent girls of Kolkata, found that family monthly income, taking too many fast foods and junk foods, and spending time with computers, were factors in increasing BMI.
In adolescents, sleep is considered an essential factor for physical health. However, adolescent lifestyles often curtail sleep time. For example, adolescents need to wake up early to go to school. There are also social pressures for shortening the amount of sleep, as well as playing with mobile phones, etc. Healthy sleep depends upon the quality and regularity of sleep and proper duration. When sleep is disrupted, health risks ensue (Chaput and Dutil 2016). Reduced sleep time up-regulates appetite by reducing leptin, an increase in ghrelin, and a reduction in insulin sensitivity; these changes increase the risk for obesity (Van Cauter et al. 2008). Adolescent girls experience weight gain when there is insufficient sleep, especially if they sleep less than 6 hours per night (Berkey et al. 2008).
Therefore, this study examines the prevalence of overweight and obesity among urban adolescent school girls, and in determining the association between selected socioeconomic and behavioural factors and overweight/obesity.
Study Population and area: In this cross-sectional study, data was collected from the adolescent girls aged 10–18 years from Government and Government-sponsored higher secondary schools in Kolkata, West Bengal, India. West Bengal is India’s fourth most populous state and is located in the eastern region of India. Kolkata is the capital city of West Bengal and is often known as the cultural capital of India.
Sample size and sampling: The total study sample was 1041 adolescent girls. We calculated the sample size for estimating a reported prevalence of 35.5% (Ghosh 2014) with a margin of error of 5 percentage points and 98% confidence interval, assuming a design effect of two, approximately 5% non-response rate. Therefore, approximately 1041 girls were selected using multistage stratified cluster sampling. Firstly, four sampled schools were selected out of all Bengali medium higher secondary schools in Kolkata, including Government and Government-sponsored schools. The primary differences between Government and Government-sponsored schools are the management system. Government schools are owned and controlled by the local state government in India. In contrast, government-sponsored schools have their private management system but get funds from the state government. However, in the present study these reflected small differences in the students’ socio-economic status between Government and Government-sponsored schools. Then from each group, two schools were selected randomly. Equal weightage was given to all the groups, and two schools were selected from every group. Adolescent girls who were Hindu by religion, whose mother tongue was Bengali and were within the age group 10 to 18 years were selected for this study. We were given prior informed consent from the School Education Directorate, the head of the respective schools, the students’ parents, and the students. Data were collected from September 2018 to January 2020.
Socioeconomic data: Socioeconomic data like age (date of birth), caste, education, and occupation of the parents, household size, and monthly household expenditure data were collected. The data was cross verified from school records and also from the respective parents. A schedule was formulated for the students’ parents. Students filled in information from their parents. Mobile phone numbers were collected from the students and also from the schools for a future response if needed.
Anthropometric data: The height (cm) and weight (kg) of the subjects were measured according to the standard procedures (Weiner and Lourie 1981). We had used an anthropometer and a portable weighing machine for the measurements of height and weight. Before taking the measurement, each subject was asked to stand erect without footwear. Height was recorded to the nearest 0.1 cm and weight to the nearest 0.5 kg. Body mass index (BMI) was calculated by dividing weight in kilogram by square of height in meter. Calculated BMI was categorized using the BMI for Age Girls (5 to 19 years) World Health Organization percentiles guidelines (WHO 2006): normal (<5th – 85th percentile), overweight (<85th – 95th percentile), obese (>95th percentile). The individual with physical deformities was excluded from the study. Technical error of measurements (TEM) was incorporated and found within accepted limits (Ulijaszek and Kerr 1999).
Behavioural data: Physical activity (do you exercise regularly? Yes or No.), sedentary behaviour data (Do you watch television and mobile? If yes, how many hours do you spend on television and mobile in a day?), sleeping duration data (What time do you go to sleep? What time do you wake up?) were collected. We also collected health-related data such as taking medicine in the last three months before the survey and subjective perception of their each parent’s body physique (obese, slim, or normal?).
Categorisation of socio-economic and demographic and also habits related characteristics: The ages of the adolescent girls were categorised into two groups, i.e. 10–13 years and 14–17 years. The family type was classified into two groups, i.e. nuclear (1–4 members) and joint (Above 4 members) families. Father’s and mother’s education status was combined to form a new category as parental educational status. Four quartile ranges (1st, 2nd, 3rd and 4th) were calculated to understand the household per capita monthly expenditure patterns. Sleeping duration (≤ 7 hours vs > 7 hours) and watching TV and Mobile (≤ 1 hour vs > 1 hour) per day were categorised by using the median values (50th percentile).
Statistical Analysis: Overall prevalence and age-specific prevalence rates of overweight and obesity were estimated. We calculated the percentages of socioeconomic, demographic, and habit-related data. We evaluated the association between overweight and obesity and other of socioeconomic, demographic, and habit-related variables through the chi-square (χ2) test. Lastly, stepwise binary logistic regression analysis (forward confidential) was performed to get the most significant predictors of overweight and obesity in studied adolescent girls. In the stepwise binary logistic analysis, the dependent variable as overweight and obesity status among the adolescent girls was considered binary and coded as “Overweight and obese adolescent girls” = 1 and “rest of the children” = 0. In the stepwise binary logistic analysis, all significantly distributed socioeconomic, demographic, and habit-related variables in the chi-square (χ2) test were chosen as independent variables except mother education and father education variables. We selected only our new combined variable parental education status as an independent variable in the stepwise binary logistic analysis. Nagelkarke R2 was calculated for the final step of stepwise binary logistic regression analysis to find out the amount of variation in the overweight/obesity explained by the independent variables in the model. Data were analyzed using software named IBM SPSS (Statistical Package for Social Sciences) statistics version 16.0. A p-value <0.05 and <0.001 were considered statistically significant.
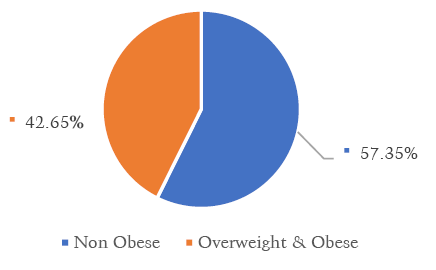
Table 1 shows the age-specific prevalence of overweight and obesity among the studied adolescent girls. The overall prevalence for overweight was 18.92%, and obesity was 23.73%. The maximum prevalence of overweight girls (29.17%) was 16 years, while obesity was 31.58% at 17 years. In general, the prevalence of overweight and obesity rose with increasing age. The combined prevalence of overweight and obesity was 42.65% among the studied adolescent girls of Kolkata (Fig. 1).
Table 1. Age specific prevalence of overweight and obesity among the studied girls
| BMI for age (percentiles) | |||||||||
| Age (years) | Total (n) |
Underweight (<5th) |
Normal (5th – 85th) |
Overweight (>85th ) |
Obese (>95th ) |
||||
| n | % | n | % | n | % | n | % | ||
| 10 | 84 | 13 | 15.48 | 33 | 39.29 | 19 | 22.62 | 19 | 22.62 |
| 11 | 173 | 28 | 16.18 | 73 | 42.20 | 30 | 17.34 | 42 | 24.28 |
| 12 | 174 | 26 | 14.94 | 73 | 41.95 | 33 | 18.97 | 42 | 24.14 |
| 13 | 167 | 28 | 16.77 | 79 | 47.31 | 34 | 20.36 | 26 | 15.57 |
| 14 | 112 | 10 | 8.93 | 53 | 47.32 | 18 | 16.07 | 31 | 27.68 |
| 15 | 116 | 13 | 11.21 | 56 | 48.28 | 17 | 14.66 | 30 | 25.86 |
| 16 | 120 | 10 | 8.33 | 48 | 40.00 | 35 | 29.17 | 27 | 22.50 |
| 17 | 95 | 13 | 13.68 | 41 | 43.16 | 11 | 11.58 | 30 | 31.58 |
| Total | 1041 | 141 | 13.54 | 456 | 43.80 | 197 | 18.92 | 247 | 23.73 |
Fig. 1. Overall prevalence of obesity (overweight and obese) among the studied girls.
Table 2 represents the socioeconomic and demographic and also habits-related characteristics of the studied participants. The result showed that the majority of the participants (57.4%) were within the age group of 10–13 years, studied in Government schools (52.8%), staying in nuclear families (1–4 members) (67.1%), and belonged to a general caste group (67.5%). The majority of the parents among the participants had graduated and undertaken higher education (39.0%), engaged in government or private services (40.6%), and the per capita monthly expenditure was Rs ≥ 5001 (29.6%, 4th quartiles). It also showed that 28.7% of students sleep was ≤ 7 hours per night (71.3%), did not engage in any physical exercise (81.2%), and consumed regular fast food (54.9%). Nearly 24% of girls watched television and mobile phones for more than one hour per day, and 37.4% had taken medicine three months before the survey. The perception of studied participants towards their parent’s body physiques showed that 13.5% of fathers and 18.2% of mothers looked “fatty”.
Table 2. Socio-economic and demographic and also habits related characteristics of the studied participants
| Characteristics | Adolescent girls (n = 1041) | |
| n | % | |
| Age group (years) 10–13 14–17 |
598 443 |
57.4 42.6 |
| School status Government sponsored Government |
491 550 |
47.2 52.8 |
| Family type Nuclear (1–4 members) Joint (Above 4 members) |
698 343 |
67.1 32.9 |
| Social group General Caste Others (SC, ST & OBC) |
703 338 |
67.5 32.5 |
| Father educational status Up to Higher Secondary Graduation and above |
432 609 |
41.5 58.5 |
| Mother’s educational status Up to Higher Secondary Graduation and above |
565 476 |
54.3 45.7 |
| Parental educational status Both of them studied upto Higher Secondary One of them studied graduation and above Both of them studied graduation and above |
362 273 406 |
34.8 26.2 39.0 |
| Father occupation Self employed Service Business Others |
40 423 395 183 |
3.8 40.6 37.9 17.6 |
| Household per capita monthly expenditure 1st quartile (≤ Rs. 2250) 2nd quartile (Rs. 2251 – Rs. 3333) 3rd quartile (Rs. 3334 – Rs. 5000) 4th quartile (≥ Rs. 5001) |
266 231 236 308 |
25.6 22.2 22.7 29.6 |
| Sleeping duration per day ≤ 7 hours > 7 hours |
299 742 |
28.7 71.3 |
| Doing regular exercisea No Yes |
845 196 |
81.2 18.8 |
| Consume regular fast-foodb No Yes |
571 470 |
54.9 45.1 |
| Watching TV and Mobile in a day ≤ 1 hour > 1 hour |
790 251 |
75.9 24.1 |
| x̅ | Adolescent girls (n = 1041) | |
| n | % | |
| Taking medicine 3 months prior to surveyc No Yes |
652 389 |
62.6 37.4 |
| Children perception on father’s body physique Slim Normal Fatty |
134 766 141 |
12.9 76.6 13.5 |
| Children perception on mother’s body physique Slim Normal Fatty |
101 751 189 |
9.7 72.1 18.2 |
a = Bicycling, running and dancing, b = Drinking cold drink, cake and pastry and potato chips
c = medicines related to cold and cough, fever, thyroid, menstrual problem, etc
SC = Scheduled Caste, ST = Scheduled Tribe, OBC = Other Backward Caste
Table 3 depicts the prevalence of overweight and obesity among adolescent girls and the association with different socioeconomic and habit-related characteristics. Out of all factors, parental educational status found a significant association with overweight and obesity. The prevalence of overweight and obesity was higher among parents who both had graduated and undertaken higher education (49.5%, p<0.001) than other educational groups. Overweight and obesity were higher among the participants whose fathers engaged in service (44.9%) and business sectors (45.3%), and where the distribution was significant (p<0.05). In household per capita monthly expenditure, the 4th quartile group had the highest prevalence of overweight and obesity (48.4%, p<0.05). It found that children who slept ≤ 7 hours per night had a higher prevalence of overweight and obesity (52.8%) than the ≥ 7 hours group (38.5%). Here the distribution was highly significant (p<0.001).
Table 3. Percentage distribution of overweight and obesity according to characteristics of students
| Characteristics | Adolescent girls (n = 1041) | Chi-square values | |
| n | % | ||
| Age group (years) 10–13 14–17 |
245 199 |
41.0 44.9 |
1.624ns |
| School status Government sponsored Government |
210 234 |
42.8 42.5 |
0.005ns |
| Family type Nuclear (1–4 members) Joint (Above 4 members) |
289 155 |
41.4 45.2 |
1.347ns |
| Social group General Hindu Others (SC, ST & OBC) |
308 136 |
43.8 40.2 |
1.193ns |
| Father educational status Up to Higher Secondary Graduation and above |
158 286 |
36.6 47.0 |
11.150** |
| Mother’s educational status Up to Higher Secondary Graduation and above |
212 232 |
37.5 48.7 |
13.290*** |
| Parental educational status Both of them studied upto Higher Secondary One of them studied graduation and above Both of them studied graduation and above |
127 116 201 |
35.1 42.5 49.5 |
16.283*** |
| Father occupation Self employed Service Business Others |
14 190 179 61 |
35.0 44.9 45.3 33.3 |
9.488* |
| Household per capita monthly expenditure 1st quartile (≤ Rs. 2250) 2nd quartile (Rs. 2251 – Rs. 3333) 3rd quartile (Rs. 3334 – Rs. 5000) 4th quartile (≥ Rs. 5001) |
112 99 84 149 |
42.1 42.9 35.6 48.4 |
8.971* |
| Sleeping duration per day ≤ 7 hours > 7 hours |
158 286 |
52.8 38.5 |
17.813*** |
| Doing regular exercisea No Yes |
370 74 |
43.8 37.8 |
2.367ns |
| Consume regular fast-foodb No Yes |
234 210 |
41.0 44.7 |
1.443ns |
| Watching TV and Mobile in a day ≤ 1 hour > 1 hour |
323 121 |
40.9 48.2 |
4.174* |
| Taking medicine 3 months prior to surveyc No Yes |
257 187 |
39.4 48.1 |
7.461** |
| Children perception on father’s body physique Slim Normal Fatty |
44 324 76 |
32.8 42.3 53.9 |
12.612** |
| Children perception on mother’s body physique Slim Normal Fatty |
35 316 93 |
34.7 42.1 49.2 |
6.063* |
a = Bicycling, running and dancing, b = Drinking cold drink, cake and pastry and potato chips, c = medicines related to cold and cough, fever, thyroid, menstrual problem, etc.
*p<0.05; **p<0.01; *p<0.001
On the other hand, the girls who watched television and mobile phones for more than 1 hour a day had a higher prevalence of overweight and obesity (48.2%, p<0.05) than the opposite group. It further identified that girls who had taken medicines related to cold and cough, fever, thyroid, menstrual problem, etc., had higher overweight and obesity (48.1%) than those girls who had not taken medicine three months prior to the survey. When the participants were asked about their perception of the patient’s body physique, it was interesting to find that overweight and obesity were higher among girls whose father looked “fatty” (53.9%) and whose mother looked “fatty” (49.2%). Both the distributions were significantly varied.
Table 4 shows the stepwise binary logistic regression (forward conditional) analysis of significant socioeconomic and other habit-related predictors on overweight and obesity among adolescent girls. In this analysis, highly significant predictors were included, which directly affected overweight and obesity. In Step 1, the first predictor found was sleeping duration which indicates the maximum significance level (β=0.580; p<0.001). This step observed that adolescents who slept ≤ 7 hours per night had higher likelihood of being overweight and obese (OR=1.787, 95%CI = 1.363–2.343, p<0.001) than ≥ 7 hours sleeping duration group. In the next step, parental education (β=0.529; p<0.001) was considered. The analysis indicates that girls who slept ≤ 7 hours per day and had parents with higher education (both of them studied graduation and above) showed a higher prevalence of overweight and obesity. In step 3, children’s perception of their father’s body physique (β=0.797; p=0.002) was detected. This step revealed that adolescents who had perceived their father’s body physique and parents were highly educated and slept ≤ 7 hours per day, had a higher risk of getting overweight and obese. The next step (Step-4) found that taking medicine three months before the survey (β=0.349; p=0.008) was added as a new predictor. Medicines included, menstrual related analgesics, fever, thyroid etc. In step 5, watching television and mobile phones in a day was included as a predictor. Results showed that adolescents who watched television and mobile phones for more than 1 hour per day showed a higher prevalence (β=0.308; p=0.039) of being overweight and obese. This analysis shows that the afore mentioned predictors had conjugated predictors on overweight and obesity among adolescent girls. In step 5, low sleeping duration (≤ 7 hours per day) was still a significant risk factor (OR=1.684, 95% CI = 1.280–2.216, p<0.001) for developing overweight and obesity among the studied girls. The step 5 model explained 10% (Nagelkerke R2) of the variance of overweight and obesity in the studied adolescent girls and correctly classified approximately 59.5% of cases.
Table 4. Step-wise binary logistic regression (forward confidential) analysis of significant socio-economic and habits related predictors on overweight and obesity among the urban adolescent girls
| Step | Characteristics | B | S.E. | Wald | df | Sig. | OR | 95.0% C.I. | |
| Lower | Upper | ||||||||
| Step 1 | Sleeping duration per day ≤ 7 hours (Ref > 7 hours) | 0.580 | 0.138 | 17.623 | 1 | 0.001 | 1.787 | 1.363 | 2.343 |
| Constant | -0.467 | 0.075 | 38.250 | 1 | 0.001 | 0.627 | |||
| Step 2 | Parental educational status | 12.415 | 2 | 0.002 | |||||
| One of them studied graduation and above (Ref = Both of them studied upto Higher Secondary) | 0.299 | 0.166 | 3.256 | 1 | 0.071 | 1.349 | 0.975 | 1.866 | |
| Both of them studied graduation and above (Ref = Both of them studied upto Higher Secondary) | 0.529 | 0.150 | 12.411 | 1 | 0.001 | 1.697 | 1.264 | 2.278 | |
| Sleeping duration per day ≤ 7 hours (Ref > 7 hours) | 0.521 | 0.140 | 13.845 | 1 | 0.001 | 1.684 | 1.280 | 2.216 | |
| Constant | -0.738 | 0.116 | 40.502 | 1 | 0.001 | 0.478 | |||
| Step 3 | Parental educational status | 11.770 | 2 | 0.003 | |||||
| One of them studied graduation and above (Ref = Both of them studied upto Higher Secondary) | 0.276 | 0.167 | 2.748 | 1 | 0.097 | 1.318 | 0.951 | 1.827 | |
| Both of them studied graduation and above (Ref = Both of them studied upto Higher Secondary) | 0.518 | 0.151 | 11.768 | 1 | 0.001 | 1.678 | 1.248 | 2.255 | |
| Sleeping duration per day ≤ 7 hours (Ref > 7 hours) | 0.496 | 0.141 | 12.362 | 1 | 0.001 | 1.642 | 1.245 | 2.164 | |
| Children perception on father’s body physique | 10.018 | 2 | 0.007 | ||||||
| Normal (Ref = slim) | 0.376 | 0.200 | 3.513 | 1 | 0.061 | 1.456 | 0.983 | 2.157 | |
| Fatty (Ref = slim) | 0.797 | 0.254 | 9.878 | 1 | 0.002 | 2.219 | 1.350 | 3.648 | |
| Constant | -1.107 | 0.208 | 28.455 | 1 | 0.001 | 0.330 | |||
| Step 4 | Parental educational status | 12.149 | 2 | 0.002 | |||||
| One of them studied graduation and above (Ref = Both of them studied upto Higher Secondary) | 0.286 | 0.167 | 2.917 | 1 | 0.088 | 1.331 | 0.959 | 1.847 | |
| Both of them studied graduation and above (Ref = Both of them studied upto Higher Secondary) | 0.528 | 0.151 | 12.149 | 1 | 0.001 | 1.695 | 1.260 | 2.282 | |
| Sleeping duration per day ≤ 7 hours (Ref > 7 hours) | 0.485 | 0.141 | 11.754 | 1 | 0.001 | 1.624 | 1.231 | 2.143 | |
| Taking medicine 3 months prior to survey (Yes, Ref = No) | 0.349 | 0.132 | 6.976 | 1 | 0.008 | 1.418 | 1.094 | 1.837 | |
| Children perception on father’s body physique | 9.836 | 2 | 0.007 | ||||||
| Normal (Ref = slim) | 0.399 | 0.202 | 3.924 | 1 | 0.048 | 1.491 | 1.004 | 2.214 | |
| Fatty (Ref = slim) | 0.797 | 0.255 | 9.790 | 1 | 0.002 | 2.219 | 1.347 | 3.655 | |
| Constant | -1.261 | 0.217 | 33.662 | 1 | 0.001 | 0.283 | |||
| Step 5 | Parental educational status | 12.303 | 2 | 0.002 | |||||
| One of them studied graduation and above (Ref = Both of them studied upto Higher Secondary) | 0.281 | 0.168 | 2.802 | 1 | 0.094 | 1.324 | 0.953 | 1.839 | |
| Both of them studied graduation and above (Ref = Both of them studied upto Higher Secondary) | 0.532 | 0.152 | 12.299 | 1 | 0.001 | 1.703 | 1.265 | 2.283 | |
| Sleeping duration per day ≤ 7 hours (Ref > 7 hours) | 0.501 | 0.142 | 12.432 | 1 | 0.001 | 1.650 | 1.249 | 2.179 | |
| Watching TV and Mobile in a day> 1 hour (Ref = ≤ 1 hour) | 0.308 | 0.150 | 4.239 | 1 | 0.039 | 1.361 | 1.015 | 1.825 | |
| Taking medicine 3 months prior to survey (Yes, Ref = No) | 0.325 | 0.133 | 5.984 | 1 | 0.014 | 1.384 | 1.067 | 1.797 | |
| Children perception on father’s body physique | 9.845 | 2 | 0.007 | ||||||
| Normal (Ref = slim) | 0.403 | 0.202 | 3.969 | 1 | 0.046 | 1.496 | 1.007 | 2.223 | |
| Fatty (Ref = slim) | 0.799 | 0.255 | 9.804 | 1 | 0.002 | 2.224 | 1.348 | 3.667 | |
| Constant | -1.335 | 0.221 | 36.389 | 1 | 0.001 | 0.263 | |||
| R2 = 0.10 (Nagelkarke); Correct Percentage = 59.5, Model chi-square = 51.627 (df=7), p < 0.001 | |||||||||
OR = Odd ratio, CI = Confidence interval, Ref = Reference category
The prevalence of overweight and obesity increases daily in Indian adolescents, specifically those living in urban areas. Socioeconomic and behavioural factors play an essential role in developing overweight and obesity risk. This study considers the overall prevalence of overweight and obesity among adolescent school girls of Kolkata. Ghosh (2014) observed that the prevalence of overweight and obesity was 35.5% among 12 to 15-year and 30.4% among 16 to 18-year-old girls in Kolkata. The present result showed that the overall prevalence is 42.65% which is relatively high and concerning.
The present study also investigated socioeconomic and behavioural determinants of overweight and obesity among adolescent girls. The results showed that the prevalence of obesity was higher among those who live in joint families. In supporting the finding, many studies have noted that children belonging to larger families were more likely to become overweight and obese. One reason could be that children from more prominent families receive less parental instruction regardingtheir food choices. Accordingly, smaller families may be more attentive regarding their child’s dietary behaviour and physical activity patterns (Brown et al. 2004; Khader et al. 2009; Lindsay et al. 2006).
Furthermore, socioeconomic status directly influences the nutritional status of adolescents. According to Okour et al. (2019), the main factor influencing children’s BMI was the parental economic status. The present findings showed that parents with the highest education graduation and above and highest household per capita monthly expenditure families reflected a higher prevalence of overweight and obesity among adolescents. The study also suggested that family economic status informed children’s total calorie intake, dietary behaviour and physical activity (Khader et al. 2009). Schoolchildren raised within families of higher economic status had a more comprehensive range of food choices, including food served at restaurants. Moreover, we speculate that a higher daily children’s pocket expenditure could have resulted in less strict control of children’s dietary behaviour by the parents, a factor that might have led to higher consumption of calorie-dense food as noted in this study also (Ahmed et al. 2018; Zhang et al. 2018; Whitaker and Orzol 2006).
Another vital factor significantly associated with obesity among adolescents was sedentary behaviour like television and mobile watching and sleeping duration. The study suggested that obesity was higher among those who watched television and mobile and suffered from sleeplessness. Obesity was associated with television viewing in many studies, and the more the duration of television watching, the higher the prevalence of obesity (Viswambharan et al. 2020). A review by Mech et al. (2016) also found that television viewing mediated the relationship between socioeconomic status and overweight and obesity in children (Gatjens et al. 2020). Other mediation analyses also revealed that the effect of socioeconomic status on overweight and obesity assessed by BMI percentiles was partly mediated by media exposure (Morgenstern et al. 2009). Other than television watching and mobile browsing, sleeping duration directly affected the BMI of adolescents. Less sleep was associated with a more significant increase in BMI from age 14 to 18 years (Mitchell et al. 2013). This consequence provides strong evidence that sleep duration was an im portant risk factor in factoradolescent obesity. It is imperative to ensure that adolescents in the upper half of the BMI distribution at age 14 years accumulate sufficient hours of sleep throughout adolescence. It has also been proposed that less sleep increases adolescent BMI by decreasing physical activity due to fatigue and changes in hormones that regulate energy expenditure (Taheri 2010; Knutson et al. 2008). The reason could be adolescents with short sleep duration may be more likely to be awake at night and be exposed to light during the dark cycle. Such biological consequences could affect the peripheral clock in adipose tissue by releasing adipokines (Bass et al. 2010; Johnston et al. 2009). The secretion of several hormones, including growth hormone, prolactin, cortisol, thyrotropin, and insulin, are influenced by sleep (Copinschi 2005; Hart et al. 2011). In support of this, a cross-sectional study observed that adolescents going to bed late tend to have higher BMIs, independent of sleep duration, compared with adolescents who go to bed early (Olds et al. 2011). However, the present study found the additive impact of socioeconomic and behavioural factors in overweight and obese adolescent children. The adolescents who slept ≤ 7 hours per day, educated parents studied graduation and above, affluent families in terms of household expenditures, spend more time watching television, browsing mobile phones, taking medicines for health problems, and perceiving their fathers as being “fatty” showed a higher prevalence of overweight and obesity. Besides, adolescents with higher educated parents felt pressure in performing well at school, which could be one reason for sleeping late at night and gaining weight.
The study was limited to school-going adolescent girls in Kolkata, India. Thus, it did not represent all adolescents in the area. One should not generalize the results of all adolescent girls of West Bengal. As this was a cross-sectional study, the causal relationship between socioeconomic and behavioural factors and overweight and obesity could not be established. In-depth food habits and physical activity data were not considered in this study. Breakfast skipping data was also not taken into account, but missing breakfast had been associated with an increased tendency to have snacks and fast foods, resulting in weight gain.
This study concludes that socioeconomic status such as family size, father’s occupation, parental education, and total family expenditure influence the increasing prevalence of overweight and obesity among adolescents. Other than these factors, television, mobile watching, and sleeping duration have become critical factors for increasing overweight and obesity in this study. Socioeconomic factors have detrimental effects in developing obesity, but behavioural factors like sleep duration may also significantly influence it. The rapid change in modern lifestyles influences adolescents from having adequate sleeping duration, negatively impacting their health. Therefore, adolescent girls should take preventive measures to reduce overweight/obesity. The government should implement competent nutrition and health promotion strategies towards adolescent girls and their respective parents/guardians to build proper dietary habits, physical activity, and sleeping habits to maintain a healthy lifestyle and reduce the risk of weight disorders..
Acknowledgements
We are thankful to the Indian Statistical Institute and the University of Calcutta for supporting this project. We are grateful to the officials of Paschim Banga Samogro Siksha Abhiyan, Bikash Bhavan, Government of West Bengal for their continuous support to carry out this project. We are also thankful to the headmasters, headmistress of the government, and government-sponsored schools of Kolkata. To those who have made immense contributions to this project and the participants, without them this project would not be possible.
Funding
The University Grants Commission (UGC), Government of India, was extended the financial support as a Junior Research Fellowship to the first author.
Author Contributions
PR developed the aim of the study. PR, SC, PB designed and assisted in drafting the methodology. PR oversaw the data collection. SC did the statistical analysis. PR and SC wrote the final draft of the paper. PB and DC helped in revising the final version of the manuscript. All the authors read and agreed to the final manuscript.
Conflict of Interest
The authors have no conflict of interest to declare.
Ahmed A, Zulaily N, Shahril MR, Abdullah EFHS, Ahmed A. 2018. Association between socioeconomic status and obesity among 12-year-old Malaysian adolescents. PLoS ONE 13(7):e0200577.
Bass J, Takahashi JS. 2010. Circadian integration of metabolism and energetic. Science 330 (6009):1349–54.
Berkey CS, Rockett HRH, Colditz GA. 2008. Weight gain in older adolescent females: the internet, sleep, coffee and alcohol. J Pediatr 153(5):635–39.
Bharati DR, Deshmukh PR, Garg BS. 2008. Correlates of overweight and obesity among school going children of Wardha city, Central India. Ind J Med Res 127(6):539–43.
Bjorntorp P. 2001. International Text Book of Obesity. 1st edition. UK: John Wiley and Sons Ltd.
Brown R, Ogden J. 2004. Children’s eating attitudes and behavior: A study of the modeling and control theories of parental influence. Health Educ Res 19 (3):261–71.
Chaput JP, Dutil C. 2016. Lack of sleep as a contributor to obesity in adolescents: impacts on eating and activity behaviors. Int J Behav Nutr Phys Act 13:103–11.
Chincholikar S, Sohani A. 2016. Epidemiological determinants of obesity in adolescent population, Maharastra, India. Ind J Commun Health 28(2):157–62.
Copinschi G. 2005. Metabolic and endocrine effects of sleep deprivation. Essent Psychopharmacol 6(6):341–47.
Egidaw MT, Gebremariam AD. 2019. Prevalence and associated factors of stunning and thinness among adolescent Somalian refugee girls living in eastern Somali refugee camps, Somali regional state, Southeast Ethiopia. Confl Health 13(1):17–24.
Gatjens I, Hasler M, di Giuseppe R, Bosy-Westphal A., Plachta-Danielzik S. 2020. Family and lifestyle factors mediate the relationship between socioeconomic status and fat mass in children and adolescents. Obes Facts 13:596–607.
Ghosh A. 2014. Explaining overweight and obesity in children and adolescents of Asian Indian Origin: The Calcutta childhood obesity study. Indian J Public Health 58(2):125–28.
Hart CN, Cairnsb A, Jelalian E. 2011. Sleep and obesity in children and adolescents. Pediatr Clin North Am 58(3):715–33.
Johnston JD, Frost G, Otway DT. 2009. Adipose tissue, adipocytes and the circadian timing system. Obes Rev 10(S2):52–60.
Khader Y, Irshaidat O, Khasawneh M, Amarin Z, Alomari M, Bateiha A. 2009. Overweight and obesity among school children in Jordan: Prevalence and associated factors. Matern Child Health J 13(3):424–31.
Knutson KL, Van Cauter E. 2008. Associations between sleep loss and increased risk of obesity and diabetes. Ann N Y Acad Sci 1129:287–304.
Kumar P, Srivastava S, Chauhan S, Patel R, Marbaniang SP, Dhillon P. 2021. Associated factors and socioeconomic inequality in the prevalence of thinnesss and stunting among adolescent boys and girls in Uttar Pradesh and Bihar, India. PLoS ONE 16(2):e0247526.
Lindsay AC, Sussner KM, Kim J, Gortmaker S. 2006. The role of parents in preventing childhood obesity. Future Children 16(1):169–86.
Mech P, Hooley M, Williams J. 2016. Parent- related mechanisms during underlying the social gradient of childhood overweight and obesity: A systematic review. Child: Care Health Dev 42(5):603–24.
Mitchell JA, Rodriguez D, Schmitz KH, Audrain McGovern J. 2013. Sleep duration and adolescent obesity. Pediatr 131:e1428–34.
Morgenstern M, Sargent JD, Hanewinkel R. 2009. Relation between socio economic status and body mass index: Evidence of an impact path via television use. Arch Pediatr Adolesc Med 163(8):731–38.
Okour AM, Saadeh RA, Hijazil MH, Khalaileh HEA, Alfaqih MA. 2019. Socioeconomic status, perceptions and obesity among adolescents in Jordon. Pan Afr Med J 34:148.
Olds TS, Maher CA, Matricciani L. 2011. Sleep duration or bedtime? Exploring the relationship between sleep habits and weight status and activity patterns. Sleep 34(10):1299–1307.
Pigeyre M, Duhamel A, Poulain JP, Rousseaux J, Barbe P, Jeanneau S, Tibere L, Romon M. 2012. Influence of social factors on weight-related behaviours according to gender in the French adult population. Appetite 58:703–9.
Taheri S. 2006. The link between short sleep duration and obesity: We should recommend more sleep to prevent obesity. Arch Dis Child 91(11):881–84.
Ulijaszek SJ, Kerr DA. 1999. Anthropometric measurement error and the assessment of nutritional status. Br J Nutr 82(3):165–77.
Van Cauter E, Spiegel K, Tasali E, Leproult R. 2008. Metabolic consequences of sleep and sleep loss. J Sleep Med 9(1):S23–S28.
Viswambharan JK, Bina T and Raphael L. 2020. Prevalence and determinants of obesity among adolescent school children of North Kerala. Int J Community Med Public Health 7(8):3142–48.
Weiner JS, Lourie JA. 1981. Practical human biology. Oxford: Blackwell Scientific.
Whitaker RC, Orzol SM. 2006. Obesity among US urban preschool children: Relationships to race, ethnicity, and socio economic status. Arch Pediatr Adolesc Med 160(6):578–84.
World Health Organization Multicentre Growth Reference Study Group. 2006. WHO Child growth standards: length/height for age, weight for age, weight for length, weight for height and body mass index for age methods and development. WHO, Geneva.
Zhang J, Zhai Y, Feng X Q, Li WR, Lyu YB, Astell-Burt T, Yu Zhao P, Ming Shi X. 2018. Gender differences in the prevalence of overweight and obesity, Associated behaviors, and weight related perceptions in a National Survey of Primary School Children in China. Biomed Environ Sci 31(1):1–11.


Received: 2021.09.08; Revised: 2022.05.13; Accepted: 2022.05.18