Introduction
The plague is an acute infectious disease caused by Yersinia pestis, a bacilliform bacterium. It can be spread by various routes of transmission. Certain rodent species, especially rats, are animal reservoir hosts of the plague, and the fleas which live in rat fur are vectors of the disease; other vector species, as has been recently proven, include human ectoparasites such as human fleas and lice (Scott and Duncan 2001; Karpiński 2012; Kacki 2017; Dean et al. 2018; Bosio et al. 2020).
There are three clinical forms of the plague; the most common one is the bubonic plague, which manifests itself in abnormally swollen glands (“buboes”) and subcutaneous haemorrhages, which shortly turn dark blue, hence the name “Black Death.” Formally speaking, although this variety of the plague was the least deadly one, in the past, when antibiotic therapy was not available, it caused death in 40% to 90% of cases, depending on time and place. Two other forms of the plague: pneumonic plague and septicemic plague were fatal in nearly 100% cases (Margerison and Knüsel 2002; Karpiński 2012; Pechous et al. 2015; Kacki 2017; Dean et al. 2018). This dramatically high mortality and extremely high infectiousness allowed the plague to spread rapidly over the world and repeatedly return in the form of a pandemic, killing millions.
The first large-scale, historically and more recently genetically documented pandemic, was the Plague of Justinian dated to the sixth century AD. However, Yersinia pestis is much older and was endemic as early as over 5000 years ago (Rasmussen et al. 2015). The Plague of Justinian probably started in Africa. It came to Europe from Egypt and affected mostly Byzantium with its capital in Constantinople. Its first wave killed 20–30% of the pre-pandemic population (Scott and Duncan 2001; Byrne 2008; Gładykowska-Rzeczycka 2008; Wójcik 2011; Harbeck et al. 2013; Feldman et al. 2016; Keller et al. 2019). The outbreak of the bubonic plague triggered the second pandemic known as the Black Death. It was the largest and most severe pandemic, which spread from the steppes of Asia to North Africa, the Levant and Europe. In Europe, it appeared 1347 and kept recurring for four hundred years until the 18th century. It caused dramatic loss of life; according to various estimates, it killed 1/3 to 2/3 of the continent’s population (Scott and Duncan 2001; Byrne 2008; Gładykowska-Rzeczycka 2008; Możejko 2012). It reached Poland as well. The third pandemic started in the 1830s in East Asia, mainly in China, and by 1960 it spread across the globe. Already in its early stages, in China alone, it caused deaths of several million people (Byrne 2008). Today, the world is not yet entirely free from this deadly disease. Yersinia pestis is still endemic in Asia, Africa and even in Americas. Admittedly, in the age of modern medicine this has not led to such death tolls as previously. However, the WHO still considers it a serious public health risk (Byrne 2008).
According to historical sources, the Black Death was brought to Poland in 1348 or 1349 on a sea vessel. It wrought havoc in Gdańsk, Pomerania and Prussia, and went on to infect Lesser Poland and Greater Poland. It returned to Poland many times throughout the 15th century. The city of Gdańsk was the gate through which the plague made its entry.
A port dating back to early Middle Ages, 15th and 16th century Gdańsk was a rapidly growing economic centre. Its location on the southern shore of the Baltic Sea (Gdańsk Bay) at the estuary of River Vistula ensured numerous business contacts. Vistula was used to float commodities made in Poland and neighbouring countries down to the Baltic Sea. The sea, in turn, offered trade opportunities with Scandinavian, German and other merchants. Gdańsk’s membership in the Hanseatic League, a commercial confederation of market towns, brought enormous profits and an economic boom. Still, the city’s geographic and commercial position had both benefits and drawbacks; the latter included constant exposure to epidemics brought by incoming vessels. In the 15th century, there were 6 to 7 outbreaks of the plague in the city (source documents reveal varying numbers): once or twice at the beginning of the century, and every 10 to 14 years by 1450. A substantial decline in population was reported in 1464. In that year, 5800 people, i.e. 19% of the then residents of Gdańsk, died of the plague. Various historical sources contain accounts of that wave of the pandemic. In 1463, before reaching Gdańsk, it struck the Netherlands (towns and villages), Cologne, Braunschweig, and then Salzburg (the Holy Roman Empire). In 1465 it spread to Saxony, Hamburg, Lübeck, followed by Prussia and Gdańsk. The plague returned to Gdańsk 4 to 5 times in the following two centuries. In 1564, it killed more than 23,000 people, which amounted to 30% of the city’s population. The last wave of the epidemic in Gdańsk was recorded in 1709, but at that time it took the greatest number of lives in the city’s history: Gdańsk lost approximately 40% of its population. Of the 24,535 deaths reported at that time, 90% were due to the plague (Kizik 2012; Możejko 2012; Trzoska 2012).
Many DNA studies have confirmed long-term persistence of Yersinia pestis in Europe, along with the pathogen’s genetic diversity (Bos et al. 2016; Seifert et al. 2016; Klunk et al. 2019; Morozowa et al. 2020).
In 2017, Morozowa et al. were the first to confirm the presence of the plague caused by 15th/16th century Yersinia pestis bacterium in Gdańsk in DNA tests. Three years later, using 14C carbon, the dating of bone samples tested for the disease was refined to the years 1425-1469. In addition, rat bones were discovered among plague-altered human remains. DNA tests helped determine that the bones belonged to the black rat species (Rattus rattus). In this way, a potential animal reservoir of the plague in late mediaeval Europe was identified (Morozowa et al. 2020).
In the past, a contagious and deadly disease such as the plague was a powerful population size regulator. Historians often emphasize the extremely high mortaliy caused by the plague. Nevertheless, its detailed demographic outcomes have been scantily examined.
Generally speaking, as pointed out by various palaeodemographers, mortality patterns in historical human populations reveal a high degree of uniformity. It is characterised by a remarkably high death rate for small children, especially infants, a clear drop in mortality among adolescents, and a gradual increase in the number of deaths among adults. This type of mortality pattern is referred to as attritional mortality. Its has its reverse in catastrophic mortality, a pattern emerging in the course of sudden, dramatic events such as an epidemic, hunger, natural disaster etc. and manifests itself by a relatively short mortality crisis, in which all age groups are exposed to elevated risk of death. In a catastrophic mortality profile, the likelihood of death for all individuals is approximately equal. Accordingly, it should reflect the age structure of a living population (Paine 2000; Gowland and Chamberlain 2005; Chamberlain 2006). With regard to the plague, it has been discussed whether it killed people indiscriminately or selectively, depending on age and sex. Attempts were made to attribute such differences to health, as expressed by the severity of various stress markers on bones. However, the results presented by researchers are inconclusive. Some authors report differences in mortality rate for men and women during the plague (Hollingsworth and Hollingsworth 1971; Scott et al. 1996; De Witte 2009; 2010; Curtis and Roosen 2017), while others do not point to such relationships (Waldron 2001-02; Kacki 2017; Bramanti et al. 2018). Certain researchers claim that the plague caused deaths regardless of age (De Witte 2010; Kacki 2017; Bramanti et al. 2018), while others found marked differences in the distribution of mortality between the deceased from epidemic and non-epidemic graveyards, sometimes indicating clearly catastrophic mortality patterns due to the plague (Hollingsworth and Hollingsworth 1971; Prechel 1996; Scott et al. 1996; Margerison and Knusel 2002; Gowland and Chamberlain 2005).
The aim of the present work was to evaluate the biodemographic effects of the plague epidemic on the basis of ossuary material from 15th/16th century Gdańsk. Mortality profiles in the plague-stricken city were compared to non-epidemic mortality in early mediaeval Gdańsk (Pudło 2016) and mortality reported for a mass grave of plague victims in the 14th century Lübeck (Prechel 1996; Pudło 2012). The assessment also included the rate of natural increase and life table parameters. Diseases, especially epidemics such as the plague have been a significant modifier of gene pool changes and the condition of a population, and as such they constitute a crucial (and previously basic) factor in human microevolution. Therefore, this article is also aimed at determining the opportunity for natural selection in the analysed Gdańsk population from the early modern period.
Material and methods
Human bone remains used in this study derived from Ossuary 3009 – one of the ossuaries discovered during archaeological excavations in Dominikański Square in Gdańsk. Work at the site was carried out by the Archaeological Museum in Gdańsk in the years 2009–2011 (Szyszka 2017). The bones collected from the ossuaries were subjected to multi-disciplinary analyses in fields such as archaeology, anthropology and history.[1] Ossuary 3009 was related to the the church/monastery compound, which consisted of St. Nicholas’s Church and the Dominican Monastery. Both the church and the monastery were built in the mid-14th century. The Dominicans stayed there until 1813, when the monastery was destroyed by Russian artillery fire during Napoleonic wars, and subsequently pulled down. The church functions to this day (Szyszka 2017). The bones from Ossuary 3009 were deposited in a pit dug in the cloister garth, under the eastern wall of the lavatory. The ossuary was dated to the 15th/16th centuries by means of archaeological methods (the period when the lavatory was built, metal artefacts discovered during bone exploration) (Szyszka 2017; Trawicka 2017).
Skeletal material from the ossuary was radically mixed and the bones were laid down without any anatomical order (Figure 1). The ossuary was special in terms of the way in which the bones had been treated. Substantial amounts of lime were found in it, almost entirely covering the upper layer of the bones.
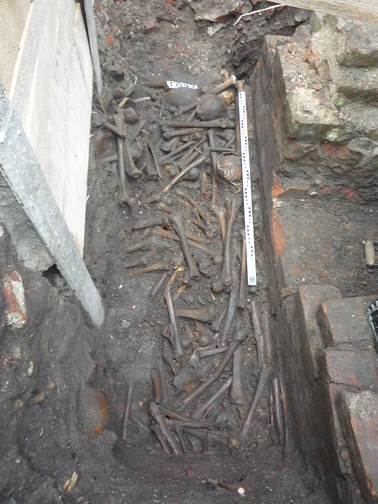
Fig. 1. Ossuary 3009. Photo. M. Szyszka.
As a result, some skeletal material that reacted with lime was severely damaged, which prevented its use in the study. The determination of the exact size of the ossuary proved impossible, as the archaeological survey at the site was performed as a rescue excavation, hence its limited scope. Nevertheless, it provided valuable information on the history of Gdańsk.
Ossuaries offer unique and particularly challenging material for anthropological reconstruction. Due to the accumulation of loose and mixed bones in Ossuary 3009, the first step of anthropological analysis was to determine the number of individuals buried at the site. The details of the analysis are presented in a separate publication (Pudło et al. 2017). All of the bone types unearthed at the site were subjected to in-depth analysis. They were assessed in terms of their original location within the skeleton, body side (right- or left-hand), as well as their condition, size, shape, colour, age and sex of the individual, if permitted by the extant diagnostic features. In addition to main bones (frontal, occipital, temporal, mandibular, humeral, pelvic, femoral, tibial), the analysis involved smaller bones, such as vertebrae, clavicles, forearm bones, fibular bones, sternum, ribs, and bones of the palm and the foot. A total of 11,578 bones were examined, of which 72% were main bones and 38% small bones. Over 90% of them belonged to adult individuals, 9.4% to children, and only 0.5% to adolescents. The right- and left-hand side of the body were represented by similar number of bones. The most common bone fragments present in the material were used to estimate the so-called minimum number of individuals (MNI) (Szczepanek 2013). Since femoral bones are the longest and strongest parts of the skeleton (Bochenek and Reicher 1990; White and Folkens 2005), they are usually best-preserved in the material from excavations. The MNI for Ossuary 3009, estimated on the basis of (left) femoral bones, indicates that it contained the remains of at least 715 individuals. Interestingly, femoral bones were also the largest extant bone group in other ossuaries, providing the basis for determining MNI (Henneberg and Henneberg 2002, 2006; Georges 2007; Rost 2011; Szczepanek 2013; Blanchard et al. 2014).
Sex and age was determined on the basis of several types of bones. For this purpose, we used a set of diagnostic features commonly applied in anthropology. The research methods were discussed in the aforementioned publication, which also cites relevant literature (Pudło et al. 2017). The age of individuals with less precise features were estimated as members of relevant age categories according to mortality sequence. Sex was successfully determined for 140 men and 92 women. The remains of 283 individuals (37 children and 246 adults) were ultimately considered suitable for paleodemographic analyses.
The deceased were grouped by age on the basis of estimated age at death, both for the entire material and separately for adult men and women. Regression curves for changes in death rate across ages (trend lines) were also introduced to emphasize the shape of mortality distributions generated in this manner. In addition, cumulative mortality distributions depending on age at death were also created. In order to find whether they could be considered catastrophic or attritional, distributions for early mediaeval Gdańsk (Pudło 2016) and 14th century Lübeck (Prechel 1996) were prepared on the basis of data available from publications. The early mediaeval graveyard in Gdańsk dated from the mid-10th century to 1227 represents pre-epidemic mortality profiles. The material from Lübeck includes victims of the Black Death from a mass grave at the city’s Holy Spirit Hospital. Differences between distributions were compared by means of the Kolmogorov-Smirnov test (Blalock 1997).
Death rates in successive age categories were also used to create life tables. The tables were used for two model situations: the stationary population model, using the classical Halley method (Acsádi and Nemeskéri 1970) and the stable population model, adjusted for a non-zero value of natural increase (Pressat 1966; Holzer 1999).
Natural increase estimation for pre-historic and early historical populations is very difficult and challenging. The rate of natural increase corresponds to the difference between the number of births and deaths at a given time and place, and is standardised for population size. If death rate is the only reliable indicator, we may merely attempt to reconstruct the value of natural increase. In the present study a number of life tables were created for various model assumptions (different numbers of children per woman at the end of the reproductive period and different natural increase levels). Life tables built in this way were juxtaposed with Weiss’s model life tables (1973). The table closest to the model was selected as the most representative one. In this way the most likely value of natural increase was determined.
As previously mentioned, the ossuary contained the remains of very few children. Insufficiency of child bones in skeletal material from excavation sites is a common issue. In this study the probable number of children in the ossuary was reconstructed according to the formula proposed by Henneberg (1977):
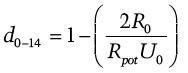
where d0-14 is the death rate at a pre-reproductive age, R0 is the net reproductive rate, Rpot is the potential gross reproductive rate, and Uc is the number of children per woman after the reproductive period. It was assumed that an average woman from the analysed population gave birth to 5 or 6 children.
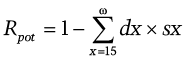
The potential gross reproductive rate Rpot is one of the measures of the opportunity for natural selection by varied mortality (Henneberg 1975; 1976). It is a combination of death rate among adults from successive age categories (from age 15 up to and including the age of the oldest individual in the group, ω) and the so-call reproductive loss rate sx. The sx comes from the “fertility archetype” for non-Malthusian populations, in which reproduction occurs according to the natural fertility regime. It stands for the likelihood of an individual aged x not having the total number of children. The potential gross reproductive rate is expressed by the formula:
Its value ranges from 0 to 1. It is a component of the biological state index Ibs (Henneberg and Piontek, 1975; Henneberg 1976; Stephan and Henneberg 2001):
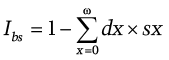
The structure of the index is the same as the structure of Rpot, and its value also ranges from 0 to 1. However, it includes both adult and child death rates. The intensity of natural selection is inversely proportional to the value of the index.
Last but not least, the intensity of natural selection only among children is measured by Crow’s Im (1958). It stands for the proportion of children who did not survive until the reproductive age (Pd) to the children who reached the reproductive age (Ps):

In life table categories, it corresponds to the proportion of the fraction of individuals deceased at a pre-productive age (d0-14) to the fraction of individuals who reached the age of 15 (l15).
All calculations were performed by means of a standard Microsoft Excel 2016 spreadsheet, in which the authors of this study wrote their own subroutines. Life table parameters were computed using proprietary software “Population dynamics modelling for anthropological situations” by Maciej Henneberg and Martyna Steyn, developed for the purposes of their publication (Henneberg and Steyn 1994). The software was also applied to determine errors in life expectancy ex and 95% confidence intervals for those values.
The significance tests in this study were carried out with the use of one level of significance p=0.05.
Results
Mortality distributions
Figure 2 shows age-at-death structure for the individuals from Ossuary 3009 in early modern Gdańsk in comparison with the corresponding structure from a non-epidemic graveyard in early mediaeval Gdańsk.
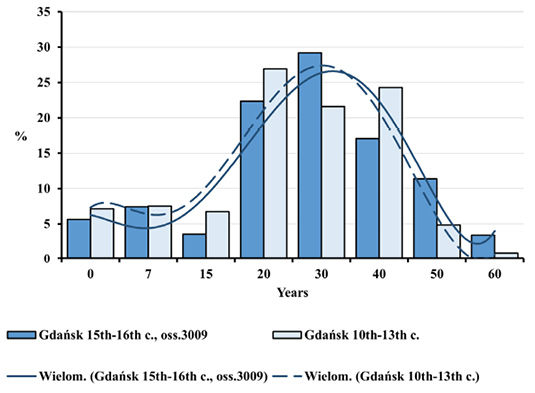
Fig. 2. Distributions of deceased by age in Gdańsk in the early Middle Ages and during the plague epidemic (oss. 3009, 15th–16th centuries).
One may easily notice a high degree of similarity between the two distributions, as indicated by the trend lines included. Dominant age categories of the deceased from both populations were as follows: 20–29.9; 30–39.9 and 40–49.9 years. There were few children, individuals in the Juvenis and persons aged above 60. Slight differences between various age categories from both populations were not statistically significant. The equality of distributions was also confirmed by cumulative mortality distributions (Figure 3).
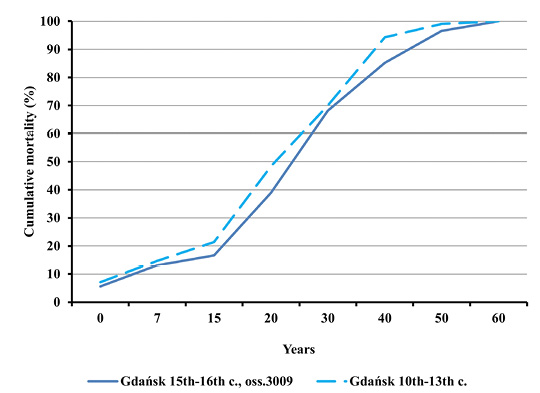
Fig. 3. Cumulative mortality distributions in Gdańsk in the early Middle Ages and during the plague epidemic (oss. 3009, 15th–16th centuries).
Adult-only mortality distributions were also analysed (Figures 4–7) due to the small size of fractions from both child categories, ranging from 5.6% to 7.5% of all deceased, which may suggest the absence of child remains at burial sites. Since the threshold of adulthood and the start of the reproductive age for historical populations is conventionally set at the age of 15, adult-only distributions charts included the 15–19.9 age category. Also in this case their shapes proved similar. Figures 4 and 5 juxtapose age-at-death distributions for men and women for Ossuary 3009.
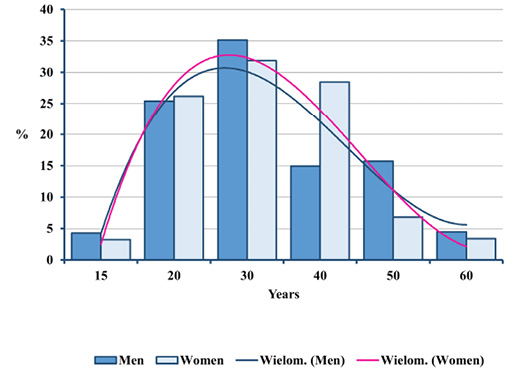
Fig. 4. Distributions of deceased men and women by age in Gdańsk during the plague epidemic (oss. 3009, 15th–16th centuries).
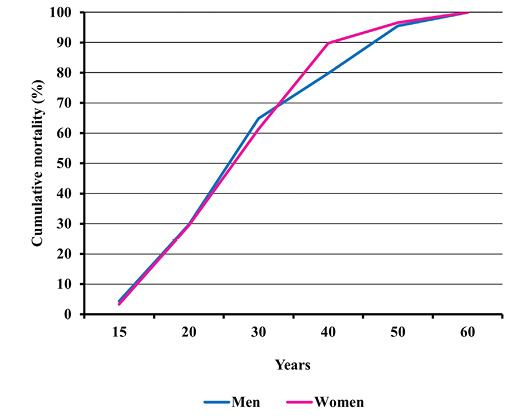
Fig. 5. Cumulative distribution of adult male and female mortality in Gdańsk during the plague epidemic (oss. 3009, 15th–16th centuries).
Peak death rate for both sexes was present in the age category of 30 to 39.9 years. Formally speaking, women prevailed in the higher age category, yet the differences were statistically insignificant (Figure 4). The similarity of the mortality profile for both sexes is also demonstrated by cumulative mortality distributions (Figure 5). No significant differences in mortality for adults from the ossuary and pre-pandemic early mediaeval Gdańsk were observed, either (Figures 6 and 7). In the light of Kolmogorov-Smirnov test, no statistically significant difference between the two distributions were found.
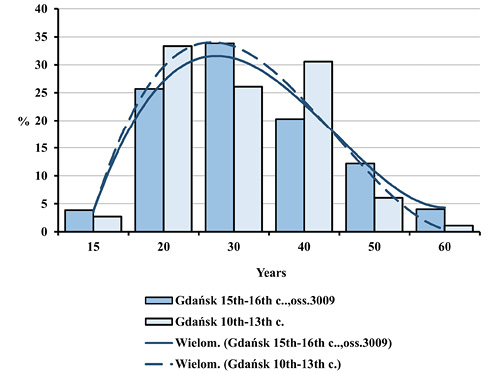
Fig. 6. Distributions of deceased adults by age in Gdańsk in the early Middle Ages and during the plague epidemic (oss. 3009, 15th–16th centuries).
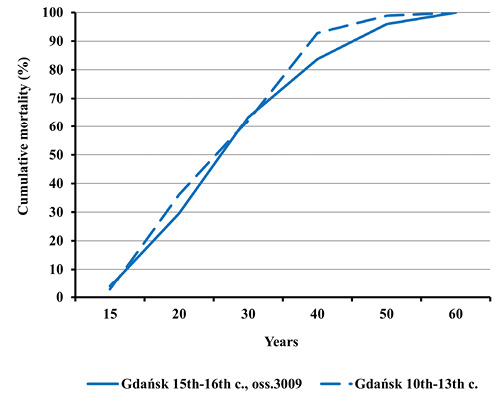
Fig. 7. Cumulative distribution of adult mortality in Gdańsk in the early Middle Ages and during the plague epidemic (oss. 3009, 15th–16th centuries).
Nevertheless, such differences were noticed between mortality profiles for the Gdańsk Ossuary 3009 and the 14th century mass grave in Lübeck. This concerns both the entire population and adults (Figures 8–11). All differences between the distributions assessed by the Kolmogorov-Smirnov test proved statistically significant. In Lübeck, the proportions of the deceased in consecutive age categories were more even than in Gdańsk. In comparison to Gdańsk, the number of deaths was higher in age categories such as Infans I and Infans II, and, above all, in the Juvenis category. The Kolmogorov-Smirnov test also showed statistically significant differences across mortality profiles for Lübeck and pre-pandemic Gdańsk (10th to 13th century).
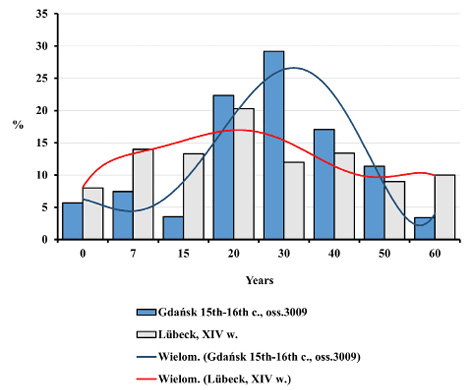
Fig. 8. Distributions of the deceased by age in Gdańsk during the plague epidemic (oss. 3009, 15th–16th centuries) and in the ossuary of plague victims in Lübeck from the 14th century.
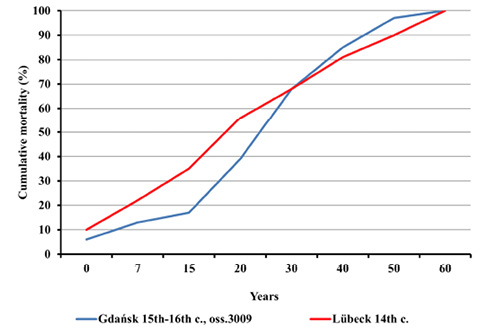
Fig. 9. Cumulative mortality distribution in Gdańsk during the plague pandemic in the 15th–16th centuries (oss. 3009) and in the ossuary of plague victims in Lübeck in the 14th century.
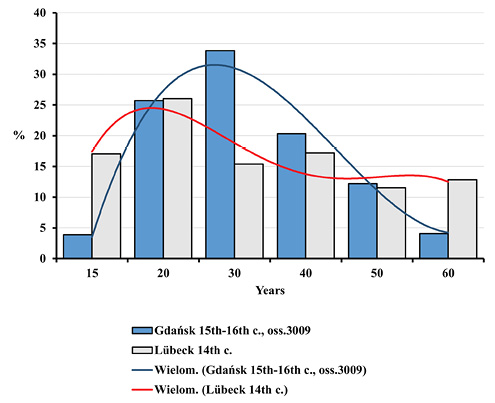
Fig. 10. Distributions of the deceased adults by age in Gdańsk during the plague epidemic (oss. 3009, 15th–16th centuries) and in the ossuary of plague victims in Lübeck from the 14th century.
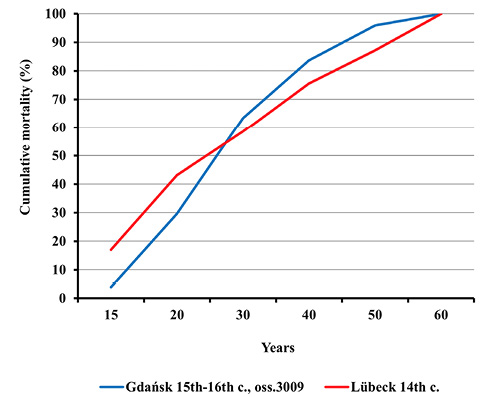
Fig. 11. Cumulative adults mortality distribution in Gdańsk during the plague pandemic in the 15th–16th centuries (oss. 3009) and in the ossuary of plague victims in Lübeck in the 14th century.
Natural increase reconstruction and life tables
Life tables were created based on the mortality sequence discovered in the analysed material. Table 1 contains base table parameters calculated for initial data assuming the stationary population model. One may easily notice that in the two first age categories death rates for children are implausibly low and amount to only 13%. This translates into overly “optimistic” values of other parameters in the life table. For example, the percentage of individuals who survived until the age of 7 exceeded 94%, and reached almost 87% for those who attained 15 years of age. Life expectancy for a newborn e0 was 33.6 years. We shall return to the problem of insufficient child remains in excavation materials later on.
| Age | Dx | dx | lx |
qx (per year) |
Lx | Tx | ex | cx |
| 0 | 16 | 5.65 | 100.00 | 0.01 | 680.21 | 3358.73 | 33.59 | 20.25 |
| 7 | 21 | 7.42 | 94.35 | 0.01 | 725.09 | 2678.52 | 28.39 | 21.59 |
| 15 | 10 | 3.53 | 86.93 | 0.01 | 425.80 | 1953.43 | 22.47 | 12.68 |
| 20 | 63.29 | 22.36 | 83.39 | 0.03 | 722.10 | 1527.63 | 18.32 | 21.50 |
| 30 | 82.60 | 29.19 | 61.03 | 0.05 | 464.35 | 805.53 | 13.20 | 13.83 |
| 40 | 48.27 | 17.06 | 31.84 | 0.05 | 233.13 | 341.18 | 10.72 | 6.94 |
| 50 | 32.18 | 11.37 | 14.78 | 0.08 | 90.99 | 108.06 | 7.31 | 2.71 |
| 60-x | 9.66 | 3.41 | 3.41 | 0.10 | 17.07 | 17.07 | 5.00 | 0.51 |
The next step involved the reconstruction of the low number of children in the ossuary. In this step, two following scenarios were assumed: 1/ women from the analysed population during their reproductive period gave birth to six children on average (Uc=6), 2/ because of the pandemic, reproductive dynamics was lower and after the reproductive period, a woman had on average five children (Uc=5). The first scenario was already discussed in a different study (Budnik, Pudło 2017). Table 2 presents values of life table parameters re-calculated for new age category durations. Table 3 contains the values of life table parameters calculated in the present study for Uc=5. We can observe that the values of life table parameters changed considerably after the adjustment for under-representation of children. Life expectancy values for children e0 fell by a statistically significant amount. Percentages of individuals surviving until their adulthood dropped, and infant mortality rate increased (Tables 2 and 3).
| Age | Dx | dx | lx |
qx (per year) |
Lx | Tx | ex | cx |
| 0 | 184 | 36.29 | 100.00 | 0.05 | 572.98 | 2112.27 | 21.12 | 27.13 |
| 7 | 77 | 15.19 | 63.71 | 0.03 | 448.92 | 1539.29 | 24.16 | 21.25 |
| 15 | 10 | 1.97 | 48.52 | 0.01 | 237.67 | 1090.37 | 22.47 | 11.25 |
| 20 | 63.29 | 12.48 | 46.55 | 0.03 | 403.07 | 852.70 | 18.32 | 19.08 |
| 30 | 82.60 | 16.29 | 34.07 | 0.05 | 259.19 | 449.64 | 13.20 | 12.27 |
| 40 | 48.27 | 9.52 | 17.77 | 0.05 | 130.13 | 190.44 | 10.72 | 6.16 |
| 50 | 32.18 | 6.35 | 8.25 | 0.08 | 50.79 | 60.32 | 7.31 | 2.40 |
| 60-x | 9.66 | 1.91 | 1.91 | 0.10 | 9.53 | 9.53 | 5.00 | 0.45 |
| Age | Dx | dx | lx |
qx (per year) |
Lx | Tx | ex | cx |
| 0 | 120.76 | 28.57 | 100.00 | 0.04 | 600.00 | 2426.42 | 24.26 | 24.73 |
| 7 | 55.92 | 13.23 | 71.43 | 0.02 | 518.52 | 1826.41 | 25.57 | 21.37 |
| 15 | 10 | 2.37 | 58.20 | 0.01 | 285.09 | 1307.89 | 22.47 | 11.75 |
| 20 | 63.29 | 14.97 | 55.83 | 0.03 | 483.47 | 1022.81 | 18.32 | 19.93 |
| 30 | 82.6 | 19.54 | 40.86 | 0.05 | 310.90 | 539.33 | 13.20 | 12.81 |
| 40 | 48.27 | 11.42 | 21.32 | 0.05 | 156.09 | 228.44 | 10.72 | 6.43 |
| 50 | 32.18 | 7.61 | 9.90 | 0.08 | 60.92 | 72.35 | 7.31 | 2.51 |
| 60-x | 9.66 | 2.29 | 2.29 | 0.10 | 11.43 | 11.43 | 5.00 | 0.47 |
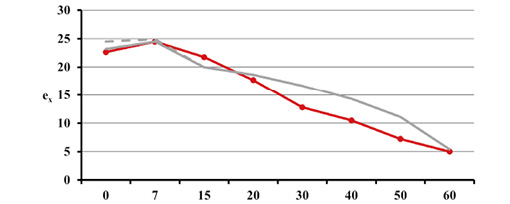
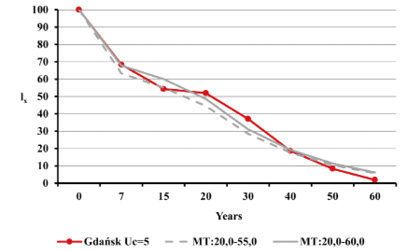
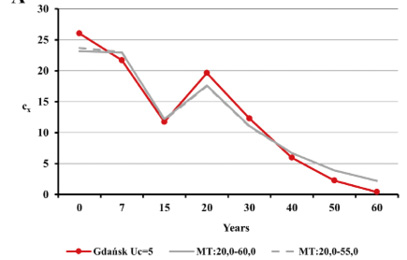
Estimated natural increase value (r) was determined by the juxtaposition of life tables prepared by the authors with model tables by Weiss (1973) as well as related biometric functions. The best fit was obtained for negative value r=–0.005 both for Uc=5 and Uc=6. This natural increase level corresponded to model tables MT:20.0–55.0 and MT:20.0–60.0, assuming that Uc=5; and MT:20.0–50.0, assuming that Uc=6. Figures below present values of life expectancy (ex), percentages of individuals surviving until consecutive age categories (lx) and percentages of individuals living in consecutive age categories (cx) against the values from model tables (Figures 12, 13 and 14).
A


B
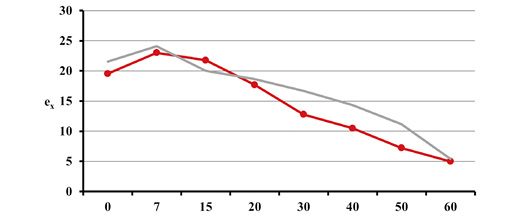


Fig. 12. Life expectancy values ex in Gdańsk from the 15th–16th centuries (oss. 3009) assuming r=–0.005 for Uc=5 (A) and Uc=6 (B) against the model Weiss curves.
A
B
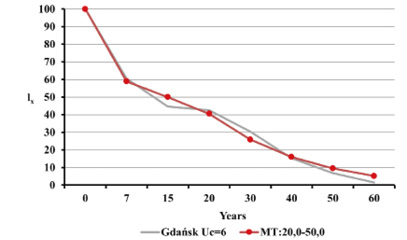
Fig. 13. The survival curves lx in Gdańsk from the 15th–16th centuries (oss. 3009) assuming r=–0.005 for Uc=5 (A) and Uc=6 (B) against the model Weiss curves.
A
B
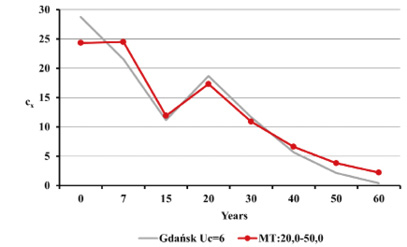
Fig. 14. Age structure of the living population cx for Gdańsk from the 15th–16th century (oss. 3009) assuming r=–0.005 for Uc=5 (A) and Uc=6 (B) against the model Weiss curves.
Table 4 lists life table parameters for the stable condition of population due to the reconstructed value of natural increase (r=–0.005) for Uc=5, in Table 5 for Uc=6. Adjustments for a negative value of r led to decreased values of lx. This is particularly noticeable where adjustment was made for the number of children at the level of Uc=6 (Table 5). In this situation even 45% individuals did not survive until adulthood. Life expectancy for a newborn did not reach 20 years. The decline in ex in both child age categories proved statistically significant. Statistically significant were also differences in e0 and e7 obtained for both model scenarios, with the assumption that a woman gave birth to five or six children on average. Other ex values did not vary.
| Age | Dx | dx | lx |
qx (per year) |
Lx | Tx | ex | cx |
| 0 | 118.66 | 31.57 | 100.00 | 0.05 | 589.49 | 2264.38 | 22.64 | 26.03 |
| 7 | 52.92 | 14.08 | 68.43 | 0.03 | 491.08 | 1674.89 | 24.48 | 21.69 |
| 15 | 9.16 | 2.44 | 54.34 | 0.01 | 265.62 | 1183.81 | 21.78 | 11.73 |
| 20 | 55.84 | 14.86 | 51.91 | 0.03 | 444.77 | 918.19 | 17.69 | 19.64 |
| 30 | 69.31 | 18.44 | 37.05 | 0.05 | 278.27 | 473.41 | 12.78 | 12.29 |
| 40 | 38.52 | 10.25 | 18.61 | 0.06 | 134.81 | 195.14 | 10.49 | 5.95 |
| 50 | 24.43 | 6.50 | 8.36 | 0.08 | 51.06 | 60.33 | 7.22 | 2.25 |
| 60-x | 6.97 | 1.86 | 1.86 | 0.10 | 9.28 | 9.28 | 5.00 | 0.41 |
| Age | Dx | dx | lx |
qx (per year) |
Lx | Tx | ex | cx |
| 0 | 180.80 | 39.48 | 100.00 | 0.06 | 561.80 | 1953.85 | 19.54 | 28.75 |
| 7 | 72.87 | 15.91 | 60.52 | 0.03 | 420.47 | 1392.05 | 23.00 | 21.52 |
| 15 | 9.16 | 2.00 | 44.60 | 0.01 | 218.00 | 971.58 | 21.78 | 11.16 |
| 20 | 55.84 | 12.19 | 42.60 | 0.03 | 365.04 | 753.58 | 17.69 | 18.68 |
| 30 | 69.31 | 15.14 | 30.41 | 0.05 | 228.39 | 388.54 | 12.78 | 11.69 |
| 40 | 38.52 | 8.41 | 15.27 | 0.06 | 110.64 | 160.16 | 10.49 | 5.66 |
| 50 | 24.43 | 5.33 | 6.86 | 0.08 | 41.90 | 49.52 | 7.22 | 2.14 |
| 60-x | 6.97 | 1.52 | 1.52 | 0.10 | 7.62 | 7.62 | 5.00 | 0.39 |
Due to the lack of possibility to determine sex in the case of many child remains, sex-dependent differences in survivability were characterised only for adult individuals. Tables below present life table parameters for men (Tables 6 and 8) and women (Tables 7 and 9). With the exception of the survivability of 40-year-olds, no statistically significant differences in values of life expectancy were found. Value e40 was significantly greater in men than in women, both in stationary and stable population model for r=–0.005.
| Age | Dx | dx | lx |
qx (per year) |
Lx | Tx | ex | cx |
| 15 | 6 | 4.29 | 100.00 | 0.01 | 489.29 | 2269.07 | 22.69 | 12.98 |
| 20 | 35.59 | 25.42 | 95.71 | 0.03 | 830.04 | 1779.79 | 18.59 | 22.02 |
| 30 | 49.2 | 35.14 | 70.29 | 0.05 | 527.21 | 949.75 | 13.51 | 13.99 |
| 40 | 20.94 | 14.96 | 35.15 | 0.04 | 276.71 | 422.54 | 12.02 | 7.34 |
| 50 | 21.99 | 15.71 | 20.19 | 0.08 | 123.39 | 145.82 | 7.22 | 3.27 |
| 60-x | 6.28 | 4.49 | 4.49 | 0.10 | 22.43 | 22.43 | 5.00 | 0.60 |
| Age | Dx | dx | lx |
qx (per year) |
Lx | Tx | ex | cx |
| 15 | 3 | 3.26 | 100.00 | 0.01 | 491.85 | 2204.67 | 22.05 | 13.28 |
| 20 | 24.08 | 26.17 | 96.74 | 0.03 | 836.52 | 1712.83 | 17.71 | 22.58 |
| 30 | 29.32 | 31.87 | 70.57 | 0.05 | 546.30 | 876.30 | 12.42 | 14.75 |
| 40 | 26.18 | 28.46 | 38.70 | 0.07 | 244.67 | 330.00 | 8.53 | 6.60 |
| 50 | 6.28 | 6.83 | 10.24 | 0.07 | 68.26 | 85.33 | 8.33 | 1.84 |
| 60-x | 3.14 | 3.41 | 3.41 | 0.10 | 17.07 | 17.07 | 5.00 | 0.46 |
| Age | Dx | dx | lx |
qx (per year) |
Lx | Tx | ex | cx |
| 15 | 5.50 | 4.73 | 100.00 | 0.01 | 488.17 | 2195.32 | 21.95 | 13.21 |
| 20 | 31.40 | 27.04 | 95.27 | 0.03 | 817.46 | 1707.15 | 17.92 | 22.12 |
| 30 | 41.28 | 35.55 | 68.23 | 0.05 | 504.49 | 889.69 | 13.04 | 13.65 |
| 40 | 16.71 | 14.39 | 32.67 | 0.04 | 254.76 | 385.20 | 11.79 | 6.89 |
| 50 | 16.69 | 14.38 | 18.28 | 0.08 | 110.92 | 130.44 | 7.14 | 3.00 |
| 60-x | 4.53 | 3.90 | 3.90 | 0.10 | 19.52 | 19.52 | 5.00 | 0.53 |
| Age | Dx | dx | lx |
qx (per year) |
Lx | Tx | ex | cx |
| 15 | 2.75 | 3.59 | 100.00 | 0.01 | 491.02 | 2146.03 | 21.46 | 13.47 |
| 20 | 21.24 | 27.76 | 96.41 | 0.03 | 825.28 | 1655.01 | 17.17 | 22.63 |
| 30 | 24.60 | 32.15 | 68.65 | 0.05 | 525.71 | 829.74 | 12.09 | 14.42 |
| 40 | 20.89 | 27.30 | 36.50 | 0.07 | 228.44 | 304.02 | 8.33 | 6.27 |
| 50 | 4.77 | 6.23 | 9.19 | 0.07 | 60.77 | 75.58 | 8.22 | 1.67 |
| 60-x | 2.27 | 2.96 | 2.96 | 0.10 | 14.81 | 14.81 | 5.00 | 0.41 |
The structure of the living population was also reconstructed on the basis of the number of deceased from Ossuary 3009. Percentages of individuals living in consecutive age categories (cx) are contained in Tables 1–9. The youngest children were the most numerous fraction among the living, followed by children from the 7–14.9 years of age category. Individuals aged 20–29.9 were the most sizeable category among adults.
Opportunity for natural selection through varied mortality
Values of natural selection measures were calculated for each model situation in this study (Tables 10).
| Im | Ibs | Rpot | |
| Stationary population model | |||
| Uc=5 | 0.718 | 0.400 | 0.687 |
| Uc=6 | 1.061 | 0.334 | 0.687 |
| Stable population model (r=–0.005) | |||
| Uc=5 | 0.840 | 0.366 | 0.673 |
| Uc=6 | 1.242 | 0.300 | 0.673 |
The introduction of a negative natural increase value brought about a slight drop in biological state index Ibs, gross reproductive potential ratio Rpot, and an increase in Crow’s Im. Values of Crow’s Im fluctuated around 1, which suggests considerable force of natural selection against children. Quite striking are also low Ibs levels, ranging from only 0.3 to 0.4, and reduced Rpot values, which did not reach 0.7.
Discussion
This study analysed biodemographic effects of the plague pandemic found in the ossuary material from 15th and 16th century Gdańsk. As previously mentioned, the fact that the plague occurred is confirmed not only on the basis of historical accounts, bone remains dating and a unique type of burial, in which the remains were covered with a thick layer of lime, but also based on genetic tests. The latter revealed the presence of the DNA of the plague bacterium, i.e. Yersinia pestis, in bone remains. What is more, partial reconstruction of the genome of Yersinia pestis from the remains of the rat discovered in the ossuary among human bones supplied novel information on natural sources of the disease and the way in which it spread over Europe (Morozowa et al. 2017; 2020).
A dangerous, acute and extremely contagious disease with high death rate, the plague was capable of causing catastrophic mortality. Catastrophic mortality profiles have been previously reported by many authors. For example, the graveyard of the victims of the Black Death at Royal Mint in London, dating to 1349. Age-at-death distributions for the deceased from the graveyard were starkly different from the distributions from various non-epidemic graveyards and model profiles for attritional mortality (Margerison and Knüsel 2002; Gowland and Chamberlain 2005). In addition, Gowland and Chamberlain (2005) confirmed the catastrophic distribution for the remains from Royal Mint using Bayesian statistics. They analysed mortality distributions according to the age of adult individuals and concluded that all age groups had been equally affected by the plague. The Penrith graveyard in England, where distributions from the plague period in 1597 and 1598 were compared with pre- and post-pandemic mortality distribution, could also be described as catastrophic. A dramatic rise in mortality rate in all age categories was reported during the epidemic, especially in children and individuals aged 15 to 44 (Scott et al. 1996; Scott and Duncan 2001). Finally, in a cluster of Black Death victims in mid-14th century Lübeck, a clear peak in the number of catastrophic deaths among children, adolescents and adults aged 20 to 30 was discovered (Prechel 1996). Although recent aDNA studies of some bones from this archaeological site suggest an outbreak of entheric paratyphoid fever rather than plague (Haller et al. 2021), the fact is that the plague was affecting Lübeck at that time and the mortality distribution there is clearly catastrophic.
In order to determine the character of mortality in the analysed osteological material, mortality distributions of individuals buried at the ossuary were evaluated. The intention was to ascertain whether the plague was selective in terms of age and sex. It has been repeatedly suggested in the literature of the subject that the plague did not kill indiscriminately; rather, it affected people at a specific age or of a given sex to a greater extent. As observed by Sharon De Witte (2010), most contemporary populations display differences in incidence and mortality rate depending on sex, and those differences tend to favour women. De Witte examined material from the East Smithfield Black Death cemetery in London and found that the proportion of deceased men to deceased women was 1.37:1.00, which means that most victims were male. Higher male mortality rate during the following plague event in London in 1603 was also reported by Holingsworth and Holingsworth (1971). In their study, the men-to-women ratio was 1.29 to 1.00 (0.89 to 1.00 before the plague). Holingsworth and Holingsworth concluded that excessive male mortality during the pandemic was attributable to lifestyle and social habits, greater mobility and lower standards of hygiene of the body and attire. In contrast, Curtis and Roosen (2017), studying plague victim records in southern Netherlands, found that both the epidemic from 1349–1351 and subsequent recurrent epidemic events until 1450 killed more women than men. In non-epidemic years, both in cities and villages, male deaths prevailed: male to female death ratio was respectively 1.20:1.00 and 1.17:1.00. In the years of the epidemic it dropped to 0.89:1.00 in cities and 0.95:1.00 in villages. Female deaths were also dominant in Penrith (England). The proportion between the sexes among plague victims was 1.37:1.00 to women’s disadvantage, whereas before and after the epidemic it corresponded to a generic 1.00:1.00 (Scott et al. 1996).
There were more adult men than women in our material, with the proportion of 1.52:1.00. Still, this does not have to be indicative of selective mortality due to the plague. Note that the proportion of men to women had already been strongly distorted in pre-pandemic Gdańsk and significantly diverged from the normal, given as 1.00:1.00. It was 1.70:1.00 in the early Middle Ages, and as much as 2.47:1.00 in the late Middle Ages (Pudło 2016). It seems logical that a harbour and commercial city like Gdańsk attracted crowds of men from Poland and overseas. Female and male mortality distributions (Figures 4 and 5) obtained in this study do not differ to a statistically significant extent. They also do not vary significantly from adults mortality distributions in pre-pandemic Gdańsk (Figures 6 and 7). Although formally the percentage of women who died at the age of 40 to 49.9 years was larger than men, such excessive mortality may have been due to complications during pregnancy, birth and confinement in the final phase of the reproductive period. As late as the 19th century, in rural Greater Poland nearly ¼ of women in the reproductive age died after childbirth, and the percentage increased with age (Budnik 2005). The equality of mortality distributions between individuals from Ossuary 3009 and early mediaeval Gdańsk was also obtained for the entire population (Figures 2 and 3). The extremely low percentage of child deaths is a striking phenomenon in both groups. Underrepresentation of child remains in osteological material is a quite frequent phenomenon, due to various reasons. A key role is played by taphonomic processes, leading to quick decomposition of delicate bones due to their chemical structure (considerable organic content). Inhumation rites and the manner in which bones are excavated are also of significance (Krenz-Niedbała 2008; Budnik and Henneberg 2009; Pudło 2016; Budnik and Pudło 2017). The two last reasons could be vital with regard to the material analysed in this study. Generally, ossuaries are secondary mass graves, in which human remains transferred from another location were placed. Some bones could have been easily “lost” in the course of such activities, involving intentional selection due to limited burial space or by accident. In any case, one cannot see any excess infant mortality like the one in the Black Death ossuary in Lübeck (Prechel 1996) or other burial sites representative of catastrophic mortality (e.g. Gowland and Chamberlain 1996; Scott et al. 1996; Margerison and Knüsel 2002).
Certain researchers suggest that the plague was selective for health. Excess mortality caused by the plague was attributed to certain physiological stress markers in bones. It was reported that previous stress increased risk of death during the pandemic (De Witte 2009, 2010a; Crtis and Roosen 2017). It seems that this does not hold true for the analysed ossuary. Kozłowski et al. (2017) concluded that in the analysed ossuary non-specific stress markers such as cribra orbitalia occurred less frequently than in other, later Gdańsk ossuaries. Moreover, there were fewer cases of tooth decay, degenerative alterations in the spine and joints. Based on palaeopathological studies, the authors made a careful suggestion that the material was characterised by a relatively low frequency of most of the analysed pathological alterations. Few alterations were also reported for pre-pandemic Gdańsk: not only was the level of physiological stress markers such as cribra orbitalia or enamel hypoplasia low, but the degree of sexual dimorphism in stature and other morphological traits was high, indicating absence of intense environmental and cultural stressors. In addition, if we consider no significant differences in male and female diets and lack of severe lesions in the mastication apparatus and other systems, the claim that living conditions and health of the inhabitants of mediaeval Gdańsk were relatively good compared to other mediaeval populations seems justified (Pudło 2016).
This would partly explain why the mortality profile reported for the 15th/16th century ossuary was attritional rather than catastrophic. This explanation is confirmed by the absence of significant differences in mortality distributions for the ossuary and for population from early mediaeval Gdańsk, as well as the absence of such differences in comparison to mortality distributions from Lübeck (Figures 8–11). Some mortality distributions for the plague epidemic obtained by other authors seem to confirm that a non-catastrophic mortality model in the case of the plague is possible. De Witte (2010 b) concludes that in spite of its destructive nature the disease generated mortality patterns which were not entirely different from those characteristic of normal, non-epidemic mortality in the Middle Ages. This finding is in line with Kacki (2017) and Bramanti et al. (2018), who did not observe any selectiveness for various biological traits in the plague’s victims, which means that the plague killed indiscriminately, regardless of age, sex and health.
It also seems that the attritional mortality profile of Ossuary 3009 may be due to other factors. The ossuary has a wide dating range. Although 14C dating of bone samples from Gdańsk examined for plague traces was refined to the period from 1425 to 1469 (Morozowa et al. 2020), it relates to only some bones. Archaeological dating is very wide and includes, as previously mentioned, the 15th and the 16th centuries. We may, thus, reasonably expect that the ossuary may have contained bones of plague victims, as well as individuals deceased in non-epidemic periods.
This scenario would account for other results obtained in biodemographic and genetic analyses. Since mortality profiles found for early modern Gdańsk were not catastrophic, it seemed advisable to reconstruct the number of children missing from the ossuary. The reconstruction method applied was based on mortality distribution for adults, reproduction patterns characteristic of non-Malthusian populations, reproductive rate and the number of children per each woman after the end of the reproductive period (Henneberg 1977). Following the adjustment, the probable number of children in the ossuary should range from 41.80% to 51.48% of all deceased individuals, depending on whether we assume that an average woman who survived until the end of her reproductive period had five or six children (Uc=5 or Uc=6). Based on this reconstruction of the number of the deceased, life tables were created for the stationary population model and stable population model due to a non-zero natural increase value. Determining natural increase solely on the basis of the number of deceased individuals from consecutive age categories is considerably difficult, often impossible. For this purpose Weiss’s (1973) model tables were used in this study. As previously mentioned, the best fit between the authors’ life tables and model tables was obtained for natural increase r=–0.005. Here, a remarkably good fit was obtained with Weiss’s MT 20.0-55.0 and MT 20.0-60.0, assuming that Uc=5, and MT 20.0-50.0, assuming that Uc=6 (Figures 12-14). A slightly negative value of natural increase in epidemic conditions may be surprising. Note, however that the value probably results from natural movement during epidemic and non-epidemic periods. Also, we do not know which type of the plague was prevalent in the population. As mentioned in the introduction, not every form of the disease was equally virulent, yet, overall, in the age of insufficient medical knowledge and no antibiotics, all of its forms were dangerous. Furthermore, some authors pointed to the possibility of achieving a certain degree of immunity by population who had previous contact with the disease, as well as potentially reduced virulence due to changes occurring in the pathogen over time (Ampel 1991; Gowland and Chamberlain 2005). Historical accounts reveal that the plague struck Gdańsk as early as the mid-14th century and kept returning in later periods (Kizik 2012; Możejko 2012; Trzoska 2012).
Negative natural increase translated into altered life table values. In particular, life expectancies ex dropped. For example, a newborn’s life expectancy e0 decreased to 22.64 or even 19.54 depending on the model assumptions (Uc=5 or Uc=6). Mean life expectancy of a 20-year-old was 17.7 years. The conventional threshold of adulthood (fifteenth year of life) was reached by 44.6% to 54.3% of individuals, and only slightly over 7% of people survived until their 50th year of life (Tables 4 and 5). Such low natural increase led to the situation in which all ex values, except for e0 and e7, proved statistically insignificant regardless of the assumed model scenario. Finally, the authors’ analyses reveal a population which could be placed within the lower limits of many mediaeval populations (Gejval 1960; Henneberg and Strzałko 1975; Henneberg and Puch 1989; Kaźmierowska 1989 [1990]; Budnik et al. 2004; Budnik, Fiszer, Białas 2009; Budnik and Henneberg 2009; Kozłowski 2012; Pudło 2016). Life expectancy for a newborn in early mediaeval Gdańsk was slightly over 22 years, and less than 17 years for an adult individual in the Adultus age category (Pudło 2016). In early mediaeval Espenfeld (Germany), a newborn could be expected to live 19 years on average, and a 20-year-old only less than 15.5 years (Bach and Bach – qtd. in: Henneberg and Strzałko 1975). For the Swedish Westerhus graveyard dated to the 11th/mid-14th century, corresponding values amounted to e0=19.9 years, and e20=21.1 years (Gejval 1960). For the early mediaeval site Dziekanowice 22, assuming the stationary population model (e0=19.9 years; e20=17.4 years), albeit after adjustment for positive natural increase, the values rose by several years (e0=25.4 years; e20=19.4 years; Budnik et al. 2004).
In modern times we often notice an extension of human life expectancy. This does not concern only the values of newborn life expectancy, which for a long time, due to immense infant mortality, were incredibly low. Nevertheless, successive ex values increased markedly. Although no clear improvement can be seen in 18th century Gdańsk ossuaries (a newborn had 22 years of life remaining, and a 20-year-old nearly 17.5 to 20.5 years; Budnik, Pudło 2017), examples such as Posada Rybotycka from 17th/18th century reveal e20 rising to 24.5 years, Jaksice from the 15th/18th century show that the value went up to reach 25.9 years, and in Słaboszewo, dated to the period from the second half of the 14th century to the first half of the 17th century, the value increased to 27 years (authors’ own calculations based on: Piontek and Malinowski 1976; Piontek 1977; Piontek 1981). Therefore, the impact of the plague was also visible in our results for Ossuary 3009. We may speculate whether low values reported for the Gdańsk ossuaries from the 18th century were affected by the last wave of the pandemic, which reached Gdańsk in 1709.
A similar picture emerges from the analysis of opportunity for natural selection (Table 10). A striking feature are extremely low values of biological state index Ibs, ranging from 0.3 to 0.4. This means that only 30% to 40% individuals in the analysed population were well-adapted to the environmental and cultural conditions and reached reproductive success, passing on their genes to the next generation’s gene pool. As many as 60% to 70% individuals did not have this opportunity; they had been eliminated along with their genetic outfit by natural selection. Low Ibs values were caused by high child mortality rate. Intensive natural selection among children is confirmed by relatively high Crow’s Im values. However, natural selection worked not only against children, but also, to a lesser extent, against adults. Values of potential gross reproductive rate Rpot demonstrate that reproductive success was achieved by less than 70% adults, and 30% were eliminated by natural selection. The situation observed in Ossuary 3009 was typical of human populations for an exceedingly long time (Piontek 1979; Budnik and Henneberg 2009). Undoubtedly, epidemic infectious diseases which troubled humans could have been a key selective factor. For 15th to 16th century Gdańsk, this was the plague.
Conclusions
The conclusions arising from the above analyses could be summarised as follows:
- Mortality profiles in the material did not reveal a clearly catastrophic character. Age-at-death distributions approximate those for pre-pandemic Gdańsk and do not differ statistically from the latter. However, they do differ significantly from catastrophic distributions for plague-stricken 14th century Lübeck. The authors found no selectiveness of the disease for sex or age of the victims. The shape of distributions, approximating that of non-epidemic ones, were probably due to a wide period of time to which the ossuary was dated (15th to 16th century). As a consequence, apart from individuals who were clearly plague victims, as confirmed by DNA tests, the ossuary could have also contained remains of people buried in non-pandemic periods.
- The mixed epidemic/non-epidemic character of the ossuary seems to be confirmed by the value of natural increase. It was reconstructed at r=–0.005 according to Weiss’s model tables. The value is only slightly negative, yet not exceptionally low, which could be expected from an epidemic-only ossuary given the plague’s notorious virulence and high death rate.
- Negative natural increase had its effect in slightly worsened life table parameters, especially with regard to life expectancy ex. They approached values typical of the Middle Ages rather than the early modern period. Note, however, that the adjustment for natural increase only resulted in radically lower ex values only for children. Differences in other ex values proved statistically insignificant. In the analysed material, the effect of the plague, although undoubtedly marked, was not dramatic.
- Measures of opportunity for natural selection calculated in this study dropped slightly as a result of negative natural increase. However, they were generally contained within the limits typical of early historical populations. The edge of natural selection affected mostly children. This is confirmed by low values of biological state index Ibs and increased levels of Crow’s Im. Natural selection worked against adults, too, although to a smaller extent. This finding is supported by reduced values of potential gross reproductive rate Rpot. The above picture is common for many historical populations. Undoubtedly, the plague acted as an important pool gene regulator, a tool of natural selection in the analysed group. Still, one must not exclude various socio-cultural factors related to the capabilities, organisation and living conditions related to life in a rapidly growing early modern harbour city.
The Author’s contribution
AB was the originator of the work and the main contractor of the project. She participated in the elaboration of osteological materials, and performed all paleodemographic, genetic and statistical analyzes. Moreover, she made the diagrams and wrote a draft and final version of the work. AP was the contractor for the project. She elaborated a large part of the osteological material and provided pictures of the bones. She participated in writing some fragments of the draft of the work. Both authors carefully read and approved the final version of the manuscript.
Conflict of interest
The authors declare that there is no conflict of interest.
Acknowledgements
The authors would like to thank Dr. Justyna Marchewka-Długońska for technical assistance in preparing figures for the article.
This publication was financed by the Minister of Science and Higher Education (Grant No DNK/SP/463728/2020): Excellent Science – Support for scientific conferences. Funeralia Gnieźnieńskie – Man in the perspective of interdisciplinary research.
References
Acsádi Gy, Nemeskéri J. 1970. History of Human Life Span and Mortality. Budapest: Akadémiai Kiadó.
Ampel NM. 1991. Plagues – what’s past is present – thought on the origin and history of new infectious diseases. Rev Infect Dis 13:658–65. https://doi.org/10.1093/clinids/13.4.658
Blalock HM. 1977. Statystyka dla socjologów. Warszawa: Państwowe Wydawnictwo Naukowe.
Blanchard P, Kacki S, Rouquet J, Gaultier M. 2014. Le caveau de l’eglise Saint-Pierre d’Eperon (Eure-et--Loir) et ses vestiges: protocole d’etude et premiers resultats. Revue Archeologique du Centre de la France 53:1–36.
Bochenek A, Reicher M. 1990. Anatomia człowieka 1. Wyd. 10. Warszawa: Państwowy Zakład Wydawnictw Lekarskich.
Bos KI, Herbig A, Sahl J, Waglechner N, Fourment M, Forrest SA, et al. 2016. Eighteenth century Yersinia pestis genomes reveal the long-term persistence of an historical plague focus. eLife 5:e12994. https://doi.org/10.7554/eLife.12994
Bosio CF, Jarrett C, Scott DP, Fintzi J, Hinnebusch J. 2020. Comparison of the transmission efficiency and plague progression dynamics associated with two mechanisms by which fleas transmit Yersinia pestis. PLOS Pathogenes 16(12):e1009092. https://doi.org/10.1371/journal.ppat.1009092
Bramanti B, Zedda N, Rinaldo N, Gualdi-Russo E. 2018. A critival review of anthropological studies on skeletons from European plague pits of different epochs. Nature. Scientific Reports 8(17655):1–12. https://doi.org/10.1038/s41598-018-36201-w
Byrne JP. editor. 2008. Encyclopedia of Pestilence, Pandemics, and Plagues. Westport, Connecticut, London: Greenwood Press.
Budnik A. 2005. Uwarunkowania stanu i dynamiki biologicznej populacji kaszubskich w Polsce. Studium antropologiczne. Poznań: Wydawnictwo Naukowe UAM.
Budnik A, Henneberg M. 2009. Demografia małych populacji w badaniach antropologicznych: wymieralność, płodność i wielkość rodziny. In: B Jerszyńska, and K Kaczanowski, editors. Współczesna antropologia fizyczna. Biodemografia i genetyka populacyjna w badaniach antropologicznych. Poznań: Sorus. 21–34.
Budnik A, Fiszer F, Białas K. 2009. Wartość informacyjna analiz biodemograficznych w badaniach przeszłości człowieka. In: W Dzieduszycki, and J Wrzesiński, editors. Metody. Źródła. Dokumentacja. Poznań: Stowarzyszenie Naukowe Archeologów Polskich. 49–65.
Budnik A, Liczbińska G, Gumna I. 2004. Demographic trends and biological status of historic populations from central Poland: The Ostrów Lednicki Microregion. Am J Phys Anthropol 125:369–81. https://doi.org/10.1002/ajpa.10272
Budnik A, Pudło A. 2017. Biodemografia nowożytnego Gdańska w świetle badań nad ossuariami. Możliwości rekonstrukcji i problemy metodyczne, In: A Pudło, and M Henneberg, editors. Nowożytne ossuaria z klasztoru dominikańskiego w Gdańsku. Wyniki badań interdyscyplinarnych. Gdańsk: Muzeum Archeologiczne w Gdańsku, Seria wydawnicza Fontes Commentationesque ad Res Gestas Gedani et Pomeraniae, t. 6. 139–169.
Chamberlain A. 2006. Demography in Archaeology. New York: Cambridge University Press. https://doi.org/10.1017/CBO9780511607165
Crow JF. 1958. Some possibilities for measuring selection intensities in man. Hum Biol 30:763–75.
Curtis DR, Roosen J. 2017. The sex-selective impact of the Black Death and recurring plagues in the Southern Netherlands, 1349–1450. Am J Phys Anthropol 164:246-59. https://doi.org/10.1002/ajpa.23266
Dean KR, Krauer F, Walløe L, Lingjærde OC, Bramanti B, Stenseth NC, et al. 2018. Human ectoparasites and the spread of plague in Europe during the Second Pandemic. PNAS 115(6):1304–09. https://doi.org/10.1073/pnas.1715640115
DeWitte SN. 2009. The efect of sex on risk of mortality during the Black Death in London, A.D. 1349–1350. Am J Phys Anthropol 139:222-34. https://doi.org/10.1002/ajpa.20974
DeWitte SN. 2010a. Sex differentials in frailty in Medieval England. Am J Phys Anthropol 143(2):285–97. https://doi.org/10.1002/ajpa.21316
DeWitte SN. 2010b. Age patterns of mortality during the Black Death in London, A.D. 1349–1350. J Archeol Sci 37 (1):3394–400. https://doi.org/10.1016/j.jas.2010.08.006
Feldman M, Harbeck M, Keller M, Spyrou MA, Rott A, Trautmann B, et al. 2016. A high-coverage Yersinia pestis genome from a sixth-century Justinianic Plague victim. Mol Biol Evol 33:2911–23. https://doi.org/10.1093/molbev/msw170
Gejvall NG. 1960. Westerhus. Mediaeval population and chuch in the light of skeletal remains. Lund: Ohlsson H. Lund.
Georges P. 2007. Les modifications de surface osseuse d’orgine anthropique de “l’ossuaire” medieval du Clos des Cordeliers de Sens (89). Contribution a l’etude de l’embaumement. In: Ph Charlier, editor. 2e Colloque international de Pathographie, Loches, 6–7 Avril 2007. Paris: De Boccard, 233–292.
Gładykowska-Rzeczycka J. 2008. Paleoepidemiologia – archeoepidemie. In: W Dzieduszycki, and J Wrzesiński, editors. Epidemie, klęski, wojny. Poznań: SNAP o. Poznan and authors. 37–52.
Gowland RL, Chamberlain AT. 2005. Detecting plague: Paleodemographic characterisation of a catastrophic death assemblage. Antiquity 79:146–57. https://doi.org/10.1017/S0003598X00113766
Haller M, Callan K, Susat J, Flux AL, Immel A, Franke A, et al 2021. Mass burial genomics reveals outbreak of enteric paratyphoid fever in the Late Medieval trade city Lübeck. iScience 24, 102419. https://doi.org/10.1016/j.isci.2021.102419
Harbeck M, Seifert L, Hänsch S, Wagner DM, Birdsell D, Parise KL, et al. 2013. Yersinia pestis DNA from skeletal remains from the 6th century AD reveals insights into Justinianic Plague. PLOS Pathogenes 9(5):e1003349. https://doi.org/10.1371/journal.ppat.1003349
Henneberg M. 1975. Notes on the reproduction possibilities of human prehistorical populations. Przegląd Antropologiczny 41:75–89.
Henneberg M. 1976. Reproductive possibilities and estimations of the biological dynamics of earlier human populations, In: RH Ward, KM Weiss, editors. The Demographic Evolution of Human Populations. London, New York, San Francisco: Academic Press. 41-48. https://doi.org/10.1016/0047-2484(76)90098-1
Henneberg M. 1977. Proportion of dying children in paleodemographical studies: Estimation by guess or by methodical approach. Przegląd Antropologiczny 44:105–14.
Henneberg M, Henneberg RJ. 2002. Reconstructing medical knowledge in ancient Pompeii from the hard evidence of bones and teeth. In: J Renn, and G Castagnetti, editors. Homo Faber. Studies on Nature, Technology, and Science at the Time of Pompeii. Presented at a Conference at the Deutsches Museum, Munich, 21–22 March 2000. Roma: „L’Erma” di Bretschneider, 169–187.
Henneberg M, Henneberg RJ. 2006. Human skeletal material from Pompeii. A unique source of information about ancient life. Automata 1:23–37.
Henneberg M, Piontek J. 1975. Biological state index of human groups. Przegląd Antropologiczny 41:191–201.
Henneberg M, Puch AE. 1989. Charakterystyka demograficzna i morfologiczna ludności pochowanej na cmentarzysku w Dziekanowicach stan. 2. Studia Lednickie 1:147–62.
Henneberg M, Steyn M. 1994. A preliminary report on the palaeodemography of K2 and Mapungubwe population (South Africa). Hum Biol 65:105–20.
Henneberg M, Strzałko J. 1975. Wiarygodność oszacowania dalszego przeciętnego trwania życia w badaniach antropologicznych. Przegląd Antropologiczny 41:295–309.
Hollingsworth MF, Hollingsworth TH. 1971. Plague mortality rates by age and sex in the parish of St. Botolph’s without Bishopsgate, London, 1603. Population Studies 26 (1):131–46. https://doi.org/10.1080/00324728.1971.10405789
Holzer J.Z. 1980. Demografia. Warszawa: PWE.
Kacki S. 2017. Influence del’état sanitarie des populations du passésur la mortalité entemps de peste:contribution à la paléoépidémiologie. Bulletins et Mémoires de la Sociétéd’ anthropologie de Paris, Springer Verlag 29 (3-4):202–12. https://doi.org/10.1007/s13219-017-0189-6
Kaźmierowska B. 1988 (1990). Wyniki badań antropologicznych materiałów z cmentarzyska na Ostrowie Lednickim (badania z lat 1978 i 1983–1985). Przegląd Antropologiczny 54:127–33.
Keller M, Spyrou MA, Scheib CL, Neumann GU, Kröpelin A, Haas-Gebhard B, et al. 2019. Ancient Yersinia pestis genomes from across Western Europe reveal early diversification during the First Pandemic (541–750). Proc Natl Acad Sci USA 116:12363–72. https://doi.org/10.1073/pnas.1820447116
Kizik E. 2012. Zarazy w Gdańsku od XIV do połowy XVIII wieku. Epidemie oraz liczba ofiar w świetle przekazów nowożytnych oraz badaczy współczesnych. In: E Kizik, editor. Dżuma, ospa, cholera. W trzechsetną rocznicę wielkiej epidemii w Gdańsku i na ziemiach Rzeczypospolitej w latach 1708–11. Materiały z konferencji naukowej. Gdańsk: Muzeum Historyczne Miasta Gdańska. 62–75.
Klunk J, Duggan AT, Redfern R, Gamble J, Boldsen JL, Golding GB, et al. 2019. Genetic resiliency and the Black Death: No apparent loss of mitogenomic diversity due to the Black Death in medieval London and Denmark. Am J Phys Anthropol 169:240–52. https://doi.org/10.1002/ajpa.23820
Kozłowski T. 2012. Stan biologiczny i warunki życia ludności in Culmine na Pomorzu Nadwiślańskim (X–XIII wiek). Studium antropologiczne. Toruń: Wydawnictwo Naukowe UMK.
Krenz-Niedbała M. 2008. Dziecko w średniowieczu – punkt widzenia antropologa. In: B Jerszyńska, editor. Współczesna antropologia fizyczna. Zakres i metody badań, współpraca interdyscyplinarna. Jedenaste Warsztaty Antropologiczne im. Profesora Janusza Charzewskiego. Poznań: Sorus. 69–78.
Margerison BJ, Knüsel C. 2002. Paleodemographic comparison of a catastrophic and an attritional death assemblage. Am J Phys Anthropol 119:134–43. https://doi.org/10.1002/ajpa.10082
Morozowa I, Cieślik A, Rühli F. 2017. Genetic analysis of plague in Gdańsk ossuaries (15th–18th Centuries): First Findings. In: A Pudło, and M Henneberg, editors. Nowożytne ossuaria z klasztoru dominikańskiego w Gdańsku. Wyniki badań interdyscyplinarnych. Gdańsk: Muzeum Archeologiczne w Gdańsku, Seria wydawnicza Fontes Commentationesque ad Res Gestas Gedani et Pomeraniae, t. 6. 255–260.
Morozowa I, Kasianov A, Bruskin S, Neukamm J, Molak M, Batieva E, et al. 2020. New ancient Eastern European Yersinia pestis genomes illuminate the dispersal of plague in Europe. Phil Trans R Soc B 375: 20190569. https://doi.org/10.1098/rstb.2019.0569
Możejko B. 2012. Zarazy w średniowiecznym Gdańsku. In: E. Kizik, editor. Dżuma, ospa, cholera. W trzechsetną rocznicę wielkiej epidemii w Gdańsku i na ziemiach Rzeczypospolitej w latach 1708–1711. Materiały z konferencji naukowej, Gdańsk: Muzeum Historyczne Miasta Gdańska. 43–61.
Paine RR. 2000. If a population crashes in prehistory, and there is no paleodemographer there to hear it, does it make a sound? Am J Phys Anthropol 112 (2):189–90. https://doi.org/10.1002/(SICI)1096-8644(2000)112:2<181::AID-AJPA5>3.0.CO;2-9
Pechous RD, Sivaraman V, Stasulli NM, Goldman WE. 2015. Pneumonic plague: The darker side of Yersinia pestis. Trends Microbiol 24(3):190–7. https://doi.org/10.1016/j.tim.2015.11.008
Piontek J. 1977. Średniowieczne cmentarzysko w Słaboszewie koło Mogilna: Analiza wymieralności. Przegląd Antropologiczny 43:37–53.
Piontek J. 1979. Procesy mikroewolucyjne w Europejskich populacjach Ludzkich. Poznań: Wydawnictwo Naukowe UAM.
Piontek J. 1981. Cmentarzysko późnośredniowieczne w Jaksicach (woj. bydgoskie). In: A Malinowski, editor. Źrodła do badań biologii i historii populacji słowiańskich. Seria Antropologia 10. Poznań: Wydawnictwo Naukowe UAM. 15–21.
Piontek J, Malinowski A. 1976. Cmentarzysko w Posadzie Rybotyckiej woj. Przemyśl. Przegląd Antropologiczny 42: 297–305.
Prechel M. 1996. Anthropologische Untersuchungen der skelettreste aus einen pestmassengrab am Heiligen-Geist-Hospital zu Lübeck. Lübecker Schriften zur Archäologie und Kulturgeschichte 24:323–39.
Pressat R. 1966. Analiza demograficzna. Warszawa: Państwowe Wydawnictwo Naukowe.
Pudło A. 2012. Pochówek zbiorowy jako przykład grobu w czasie epidemii. In: E. Kizik, editor. Dżuma, ospa, cholera. W trzechsetną rocznicę wielkiej epidemii w Gdańsku i na ziemiach Rzeczypospolitej w latach 1708–1711. Materiały z konferencji naukowej. Gdańsk: Muzeum Historyczne Miasta Gdańska. 237–243.
Pudło A. 2016. Mieszkańcy średniowiecznego Gdańska w świetle wyników badań antropologicznych, Muzeum Archeologiczne w Gdańsku, Gdańsk.
Pudło A, Marchewka J, Budnik A, Henneberg M, Krajewska M, Kozłowski T, et al. 2017. Charakterystyka antropologiczna grobów masowych z placu Dominikańskiego. In: A. Pudło, M. Henneberg, editors. Nowożytne ossuaria z klasztoru dominikańskiego w Gdańsku. Wyniki badań interdyscyplinarnych. Fontes Commentationesque ad Res Gestas Gedani et Pomeraniae 6. Gdańsk: Muzeum Archeologiczne w Gdańsku. 113–40.
Rasmussen S, Allentoft ME, Nielsen K, Orlando L, Sikora M, Sjögren KG, et al. 2015. Early divergent strains of Yersinia pestis in Eurasia 5,000 years ago. Cell 163:571–82. https://doi.org/10.1016/j.cell.2015.10.009
Rost R. 2011. Ossuary internments as a framework for osteological analysis. A critical approach to paleodemography and biological affinity. Totem. The University of Western Ontario Journal of Anthropology 3(2):16–24.
Scott S, Duncan CJ. 2001. Biology of Plagues: Evidence from Historical Populations. Cambridge University Press. https://doi.org/10.1017/CBO9780511542527
Scott S, Duncan CJ, Duncan SR. 1996. The plague in Penrith, Cumbria, 1597/8: its causes, biology and consequences. Ann Hum Biol 23(1):1–21. https://doi.org/10.1080/03014469600004232
Seifert L, Wiechmann I, Harbeck M, Thomas A, Grupe G, Projahn M, et al. 2016. Genotyping Yersinia pestis in historical Plague: Evidence for long-term persistence of Y. pestis in Europe from the 14th to the 17th Century. PLOS ONE 11(1): e0145194. https://doi.org/10.1371/journal.pone.0145194
Stephan CN, Henneberg M. 2001. Medicine may be reducing the human capacity to survive. Medical Hypotheses 57:633–7. https://doi.org/10.1054/mehy.2001.1431
Szczepanek A. 2013. Archeotanatologia pochówków zbiorowych od pradziejów po czasy współczesne, Rzeszów: Mitel.
Szyszka M. 2017. Ossuaria w kontekście badań archeologicznych Kępy Dominikańskiej. In: A. Pudło, M. Henneberg, editors. Nowożytne ossuaria z klasztoru dominikańskiego w Gdańsku. Wyniki badań interdyscyplinarnych. Fontes Commentationesque ad Res Gestas Gedani et Pomeraniae 6. Gdańsk: Muzeum Archeologiczne w Gdańsku. 47–67.
Trawicka E. 2017. Zabytki metalowe z ossuariów odkrytych na Kępie Dominikańskiej w Gdańsku. In: A Pudło, M Henneberg (red.), Nowożytne ossuaria z klasztoru dominikańskiego w Gdańsku. Wyniki badań interdyscyplinarnych. Fontes Commentationesque ad Res Gestas Gedani et Pomeraniae 6. Gdańsk: Muzeum Archeologiczne w Gdańsku. 69–86.
Waldron HA. 2001-02. Are plague pits of particular use to paleoepidemiologists? Int J Epidemiol 30(1):104–8. https://doi.org/10.1093/ije/30.1.104
Weiss KM. 1973. Demographic models for anthropology. Memoirs of the Society for American Archeology 27, DC: Society for American Archeology, Washington.
White T, Folkens P. 2005. The Human Bone. Manual. Burlington: Academic Press.
Wójcik M. 2011. Plaga justyniana: cesarstwo wobec epidemii. Zeszyty Prawnicze 11/1: 377–401.
Footnotes
- Results of anthropological, archaeological and historical studies were analysed in interdisciplinary re-search under the project co-financed by the Ministry of Culture and National Heritage from the funds of the “Cultural Heritage” Program, Priority: “Protection of archaeological relics” (grant no. 04695/16) ↑


Received: 2021-10-18; Revised: 2021-12-20. Accepted: 2022-01-10